Whether it’s Microsoft Excel or Google Sheets, most businesses use spreadsheet tools.
In fact, if you're a small to medium sized business (SME), it’s likely that spreadsheets are your main way of tracking sales performance.
However, there is one huge downside to both Excel and Google Sheets – data visualization. When it comes to visualizing your KPIs, spreadsheets are not a great tool for helping people quickly and easily understand what’s going on.
In the following video, Dale explains how you can create better sales dashboards by connecting your Microsoft Excel spreadsheets to Geckoboard.
Why is it so difficult to create dashboards in Excel?
The truth is, Excel was never really designed as a dashboard tool. Although there are many data visualization features within Excel that can be combined into a data dashboard, the final results leave a lot to be desired.
Excel dashboards often contain lots of visual ‘noise’ which makes it hard for people to see the information they really care about. They are also clunky and difficult to edit.
This also means that free dashboard templates for excel, which you can download online, are rarely a practical solution. 99.9% of the time, you will need to make changes to the original template, and that’s not going to be easy to do.
Should I use a BI tool instead?
If you have the time, Business Intelligence tools (or BI tools) are a better solution for creating live dashboards.
However, they can take a long time to learn how to use (about 4-6 weeks in the case of Microsoft Power BI) and depending on your needs, they can also become very expensive, very quickly. That’s because BI tools, although powerful, are complex to pick up and use. They tend to be aimed at larger organizations who are working with a lot of data. For small to medium-sized businesses (SMEs), they just aren’t a practical solution.
Let’s say you're a Sales Director who just wants to visualize your weekly KPIs, (not a data scientist at a Fortune500 company!) The chances are, you would benefit greatly from a dashboard, but you just don’t have much spare time or money to spend developing one.
Fortunately, there is another way…
What people don’t often realize is that there are tools, such as Geckoboard, which specialize in enabling you to create professional live KPI dashboards, without the cost or difficulty that comes with BI tools.
What’s more, Geckoboard has a free plan for spreadsheet integrations. So if you’re just looking to create a single dashboard for your Excel data, this isn’t even going to cost you anything.
The following dashboards can all be created using just Microsoft Excel (or Google Sheets) and a Geckoboard account.
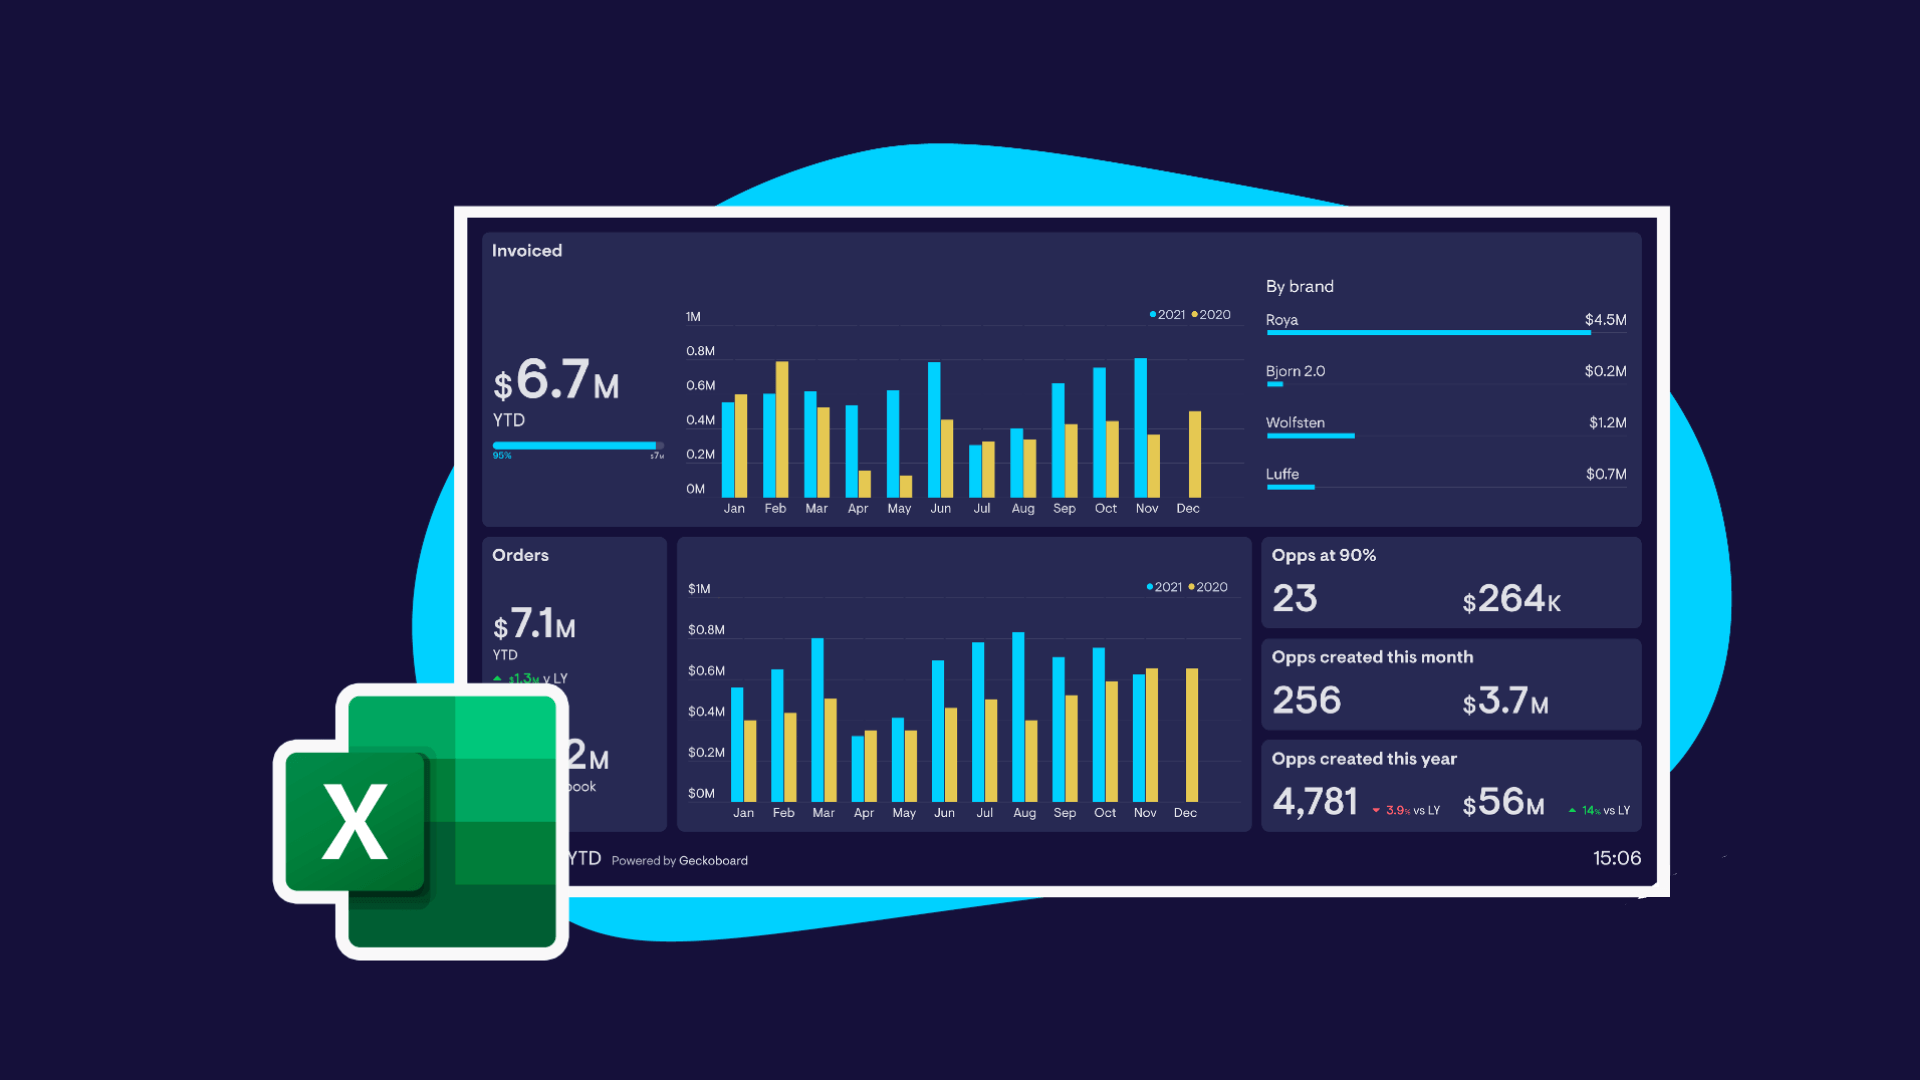
Sales Year to Date
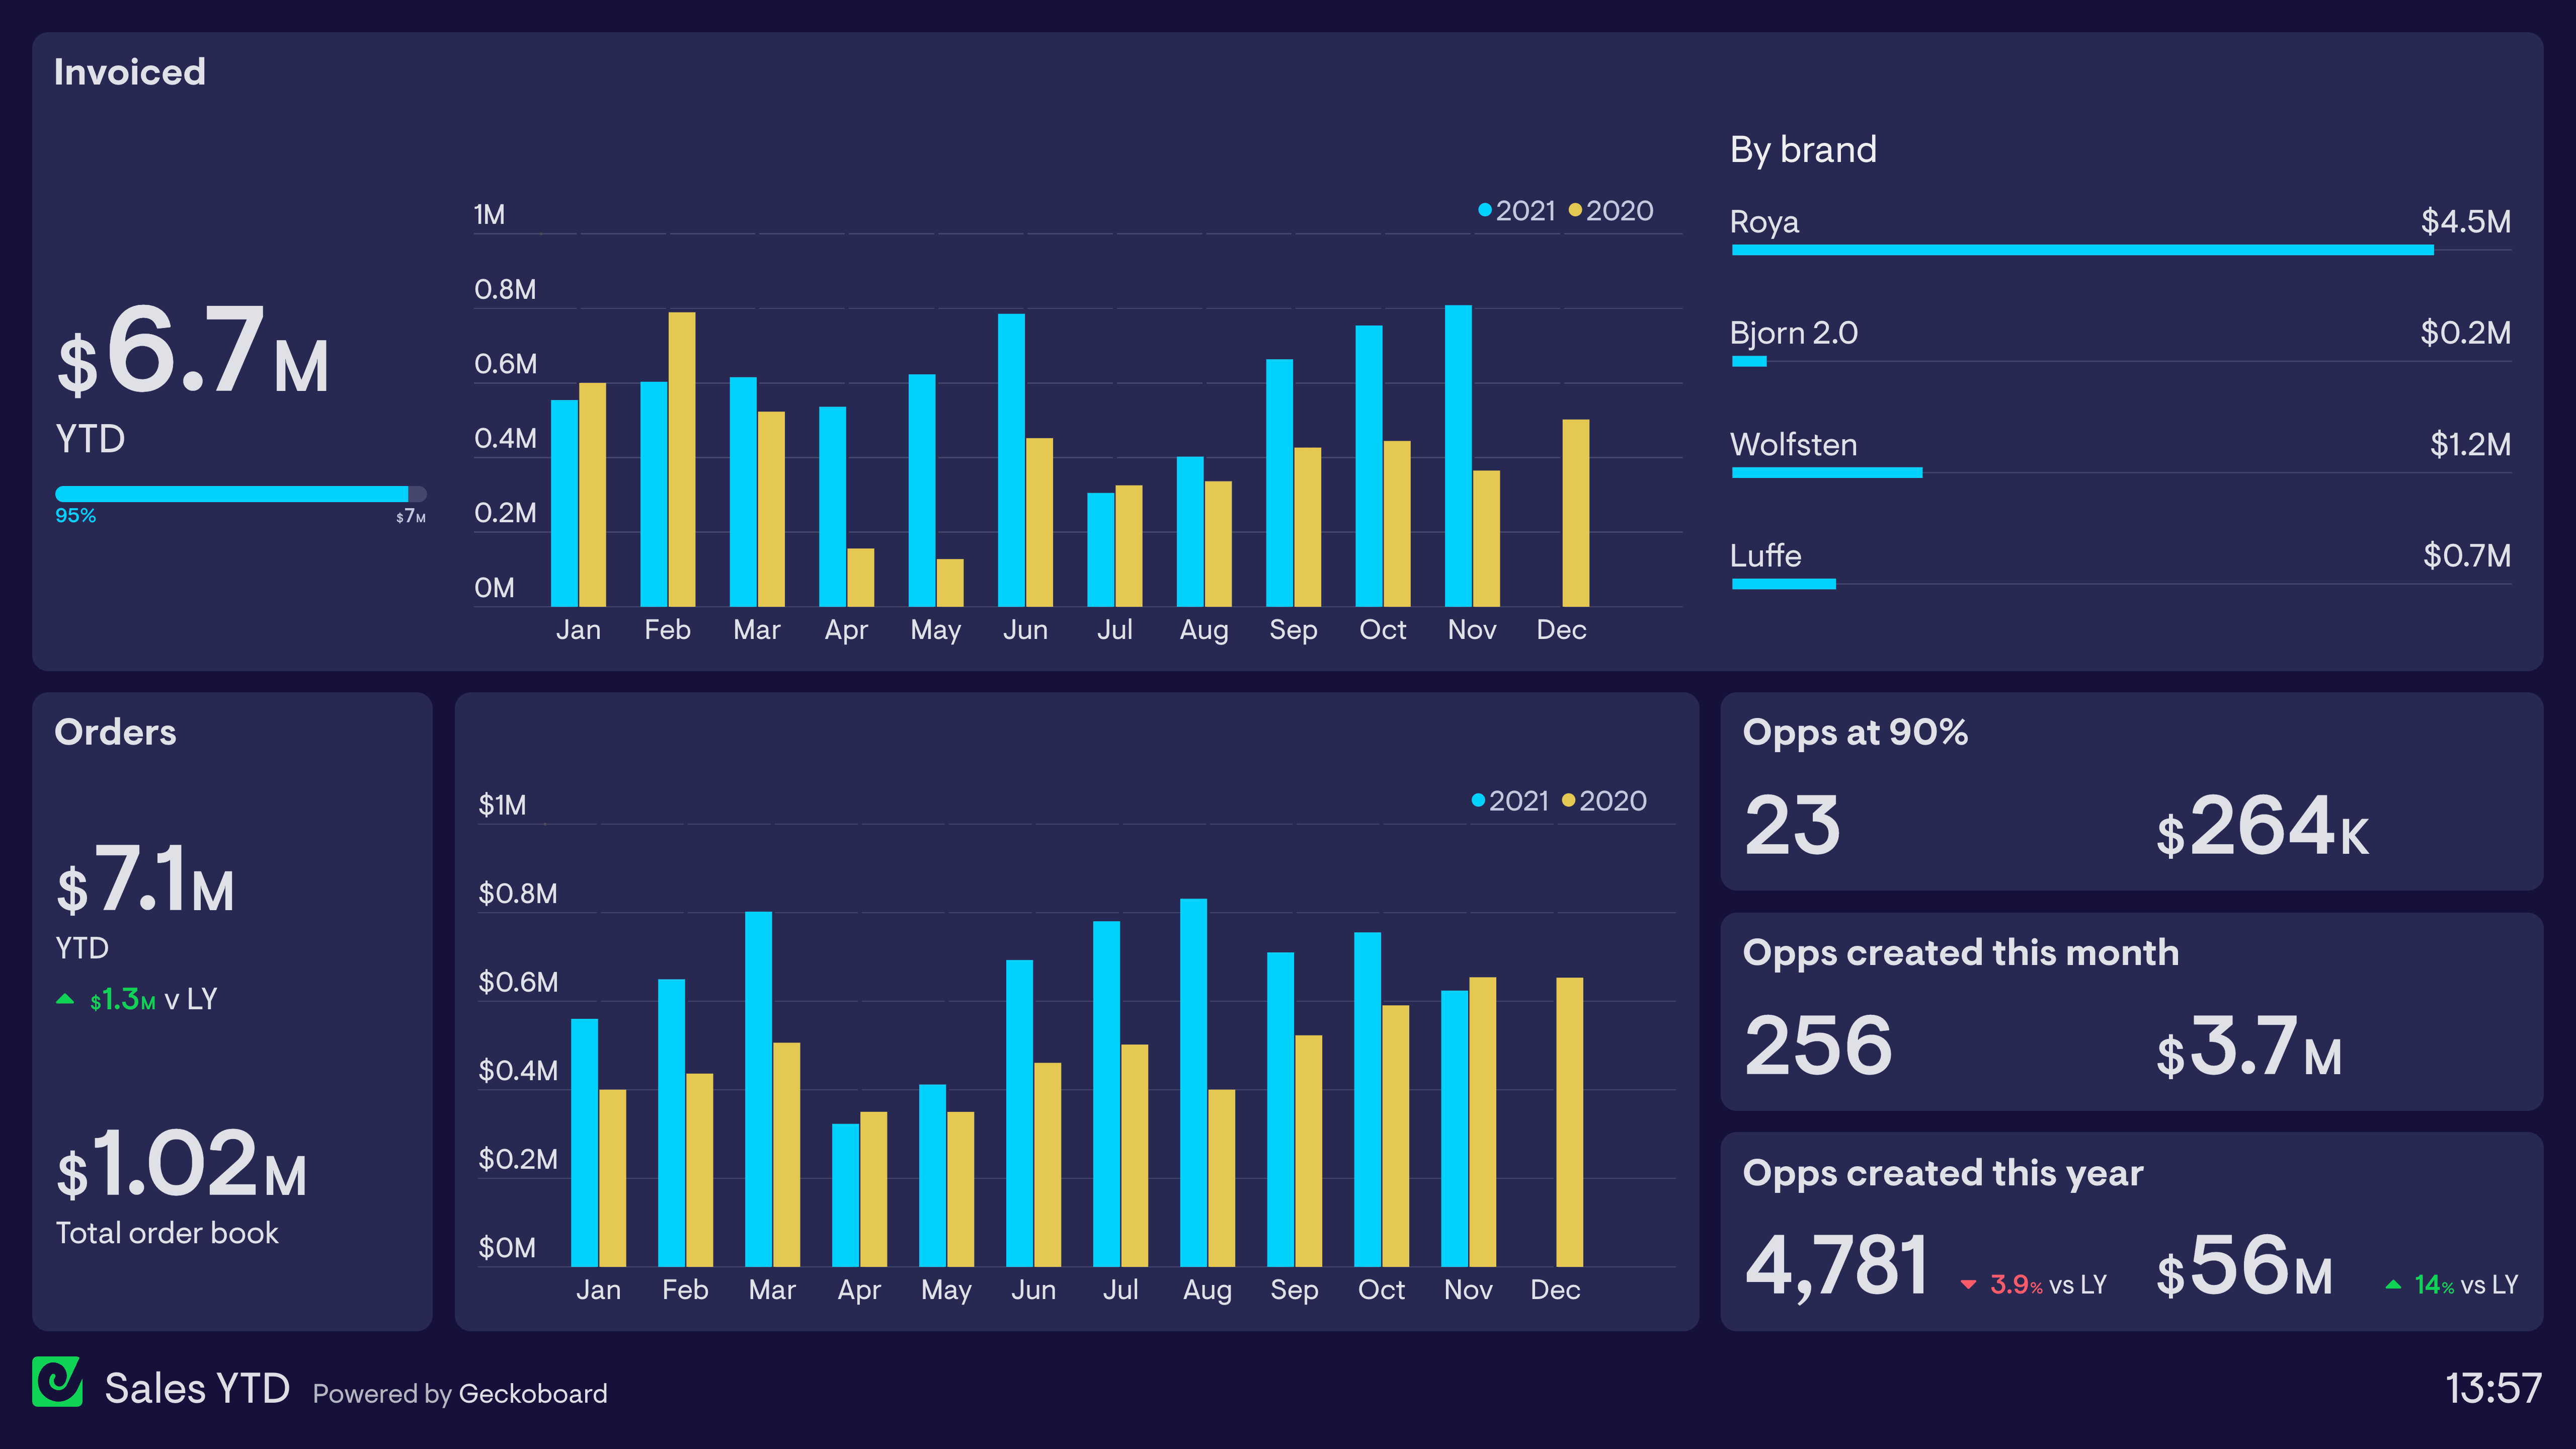
This sales dashboard shows up to date information on both invoices and orders, as well as the sales pipeline.
Sales opportunities
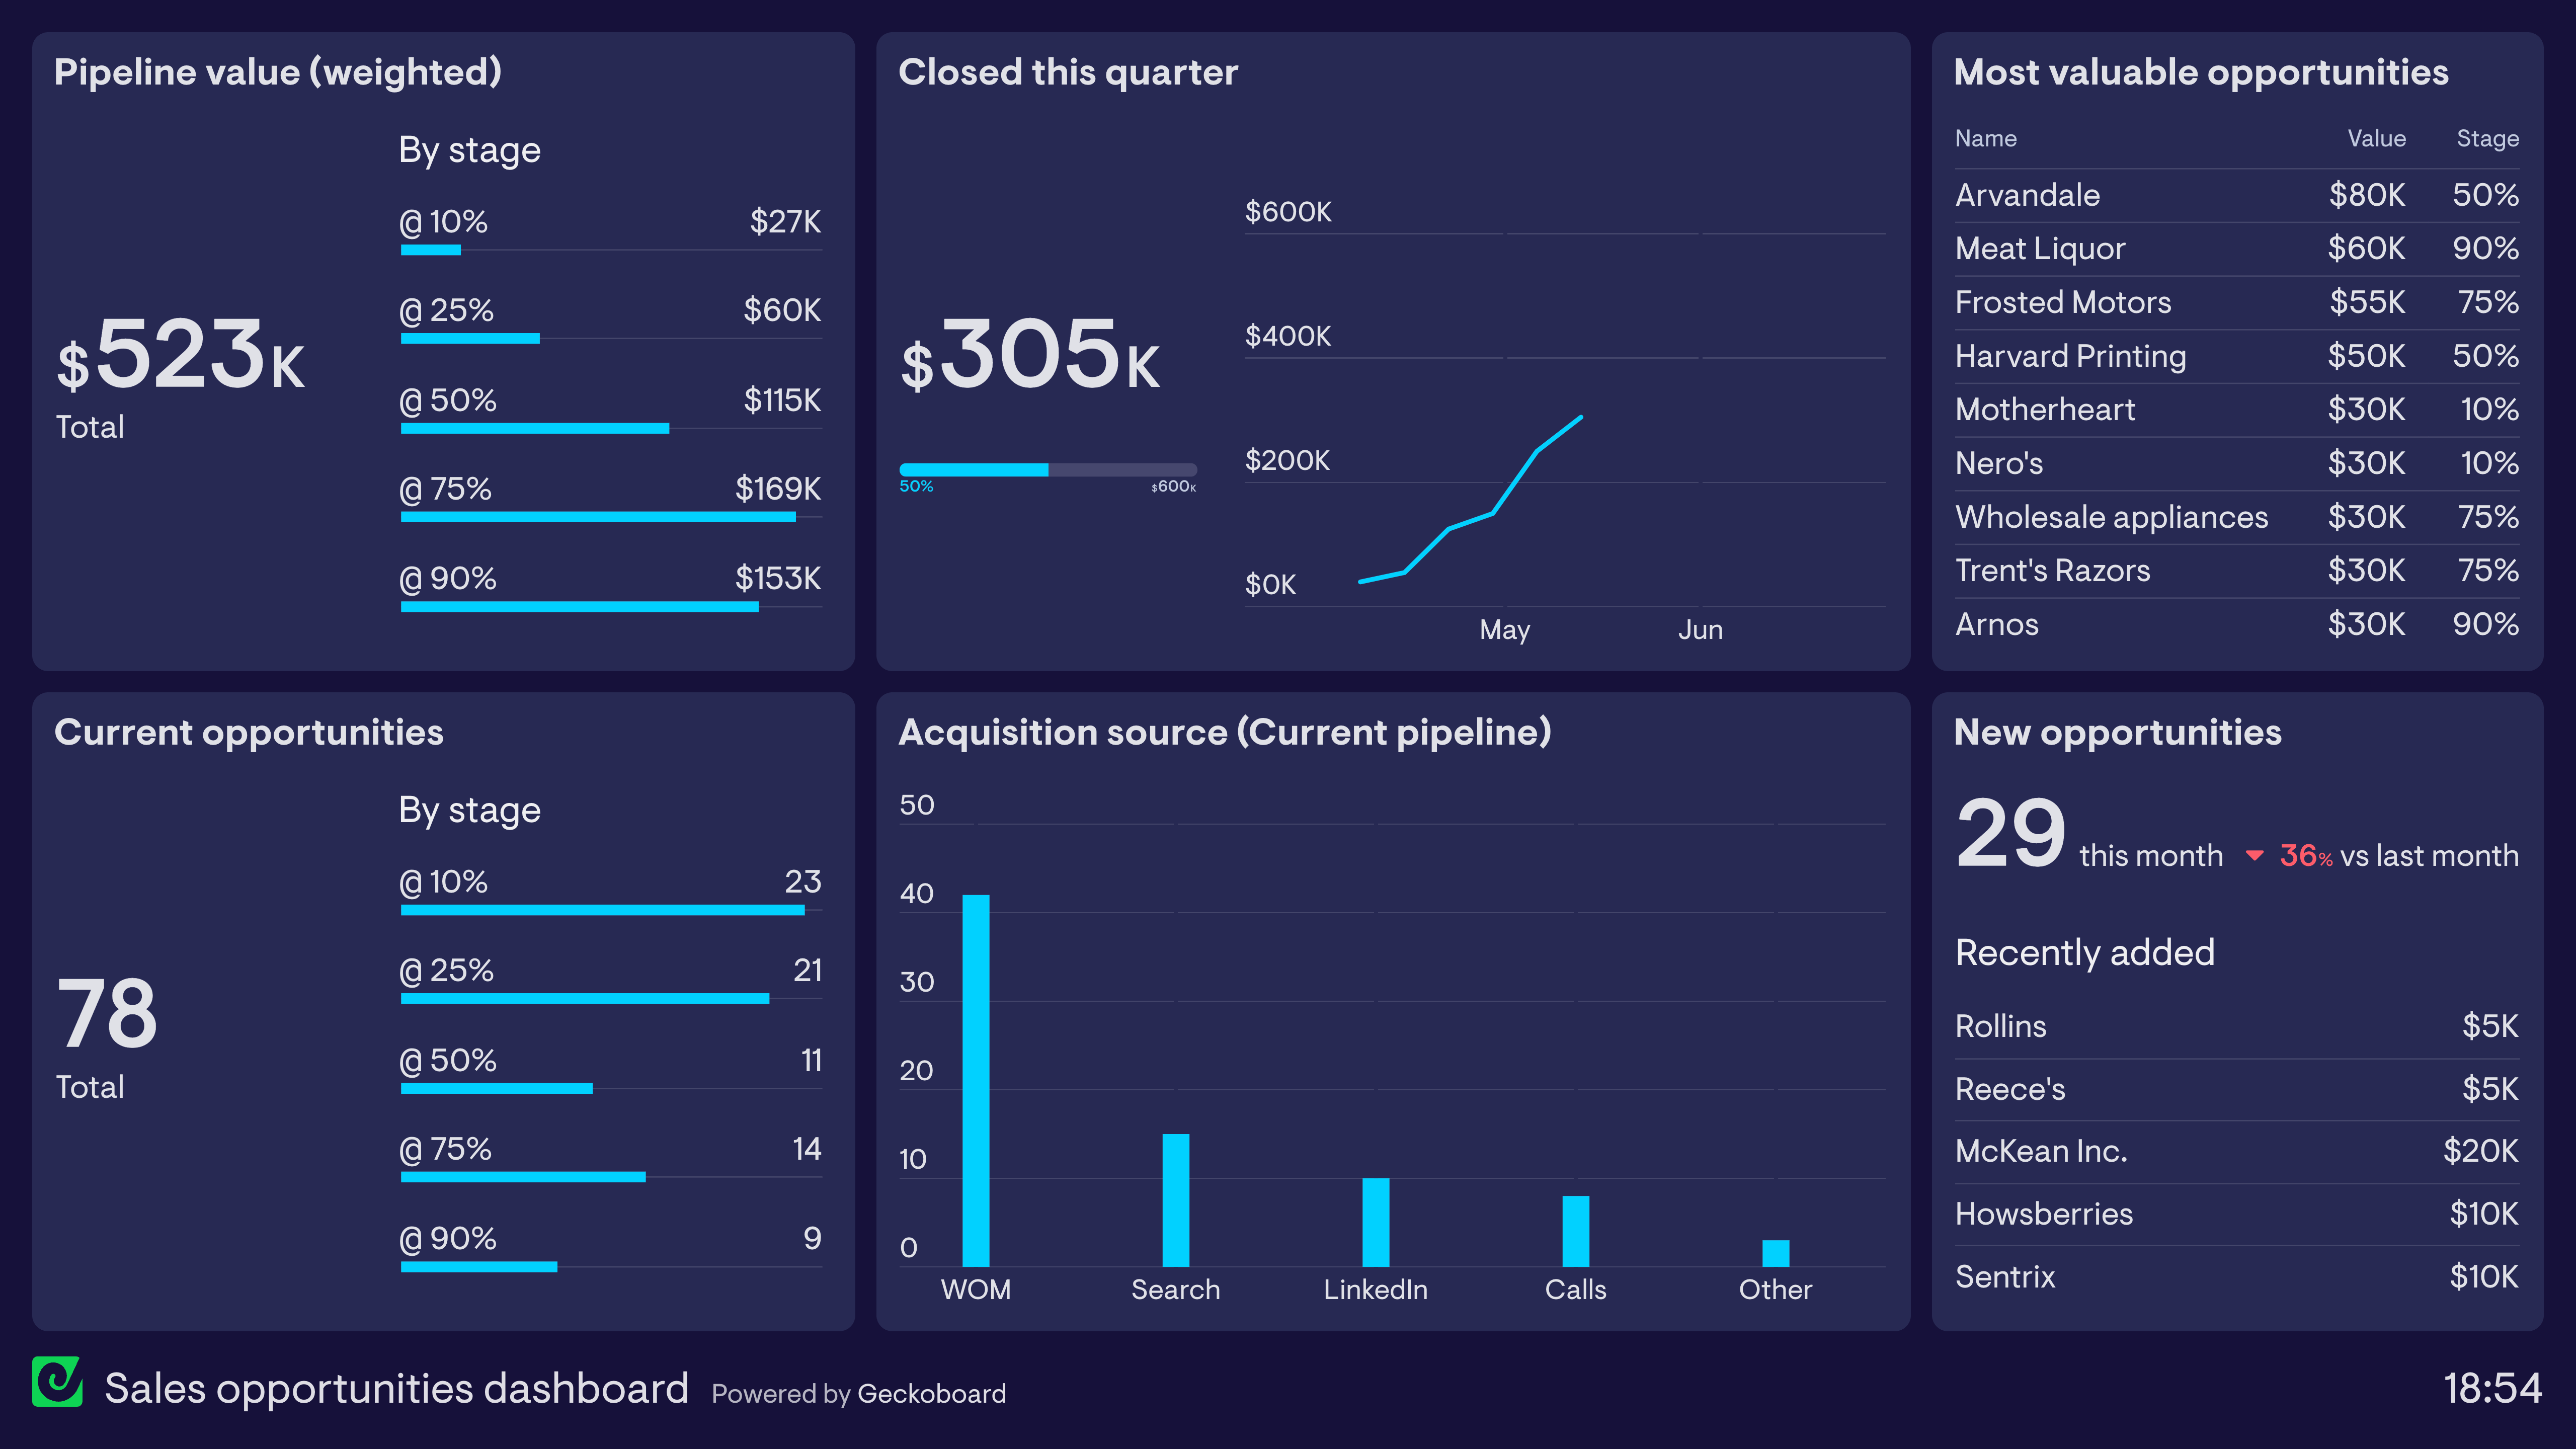
The sales opportunities dashboard shows how potential deals are progressing through the sales pipeline.
Sales team overview
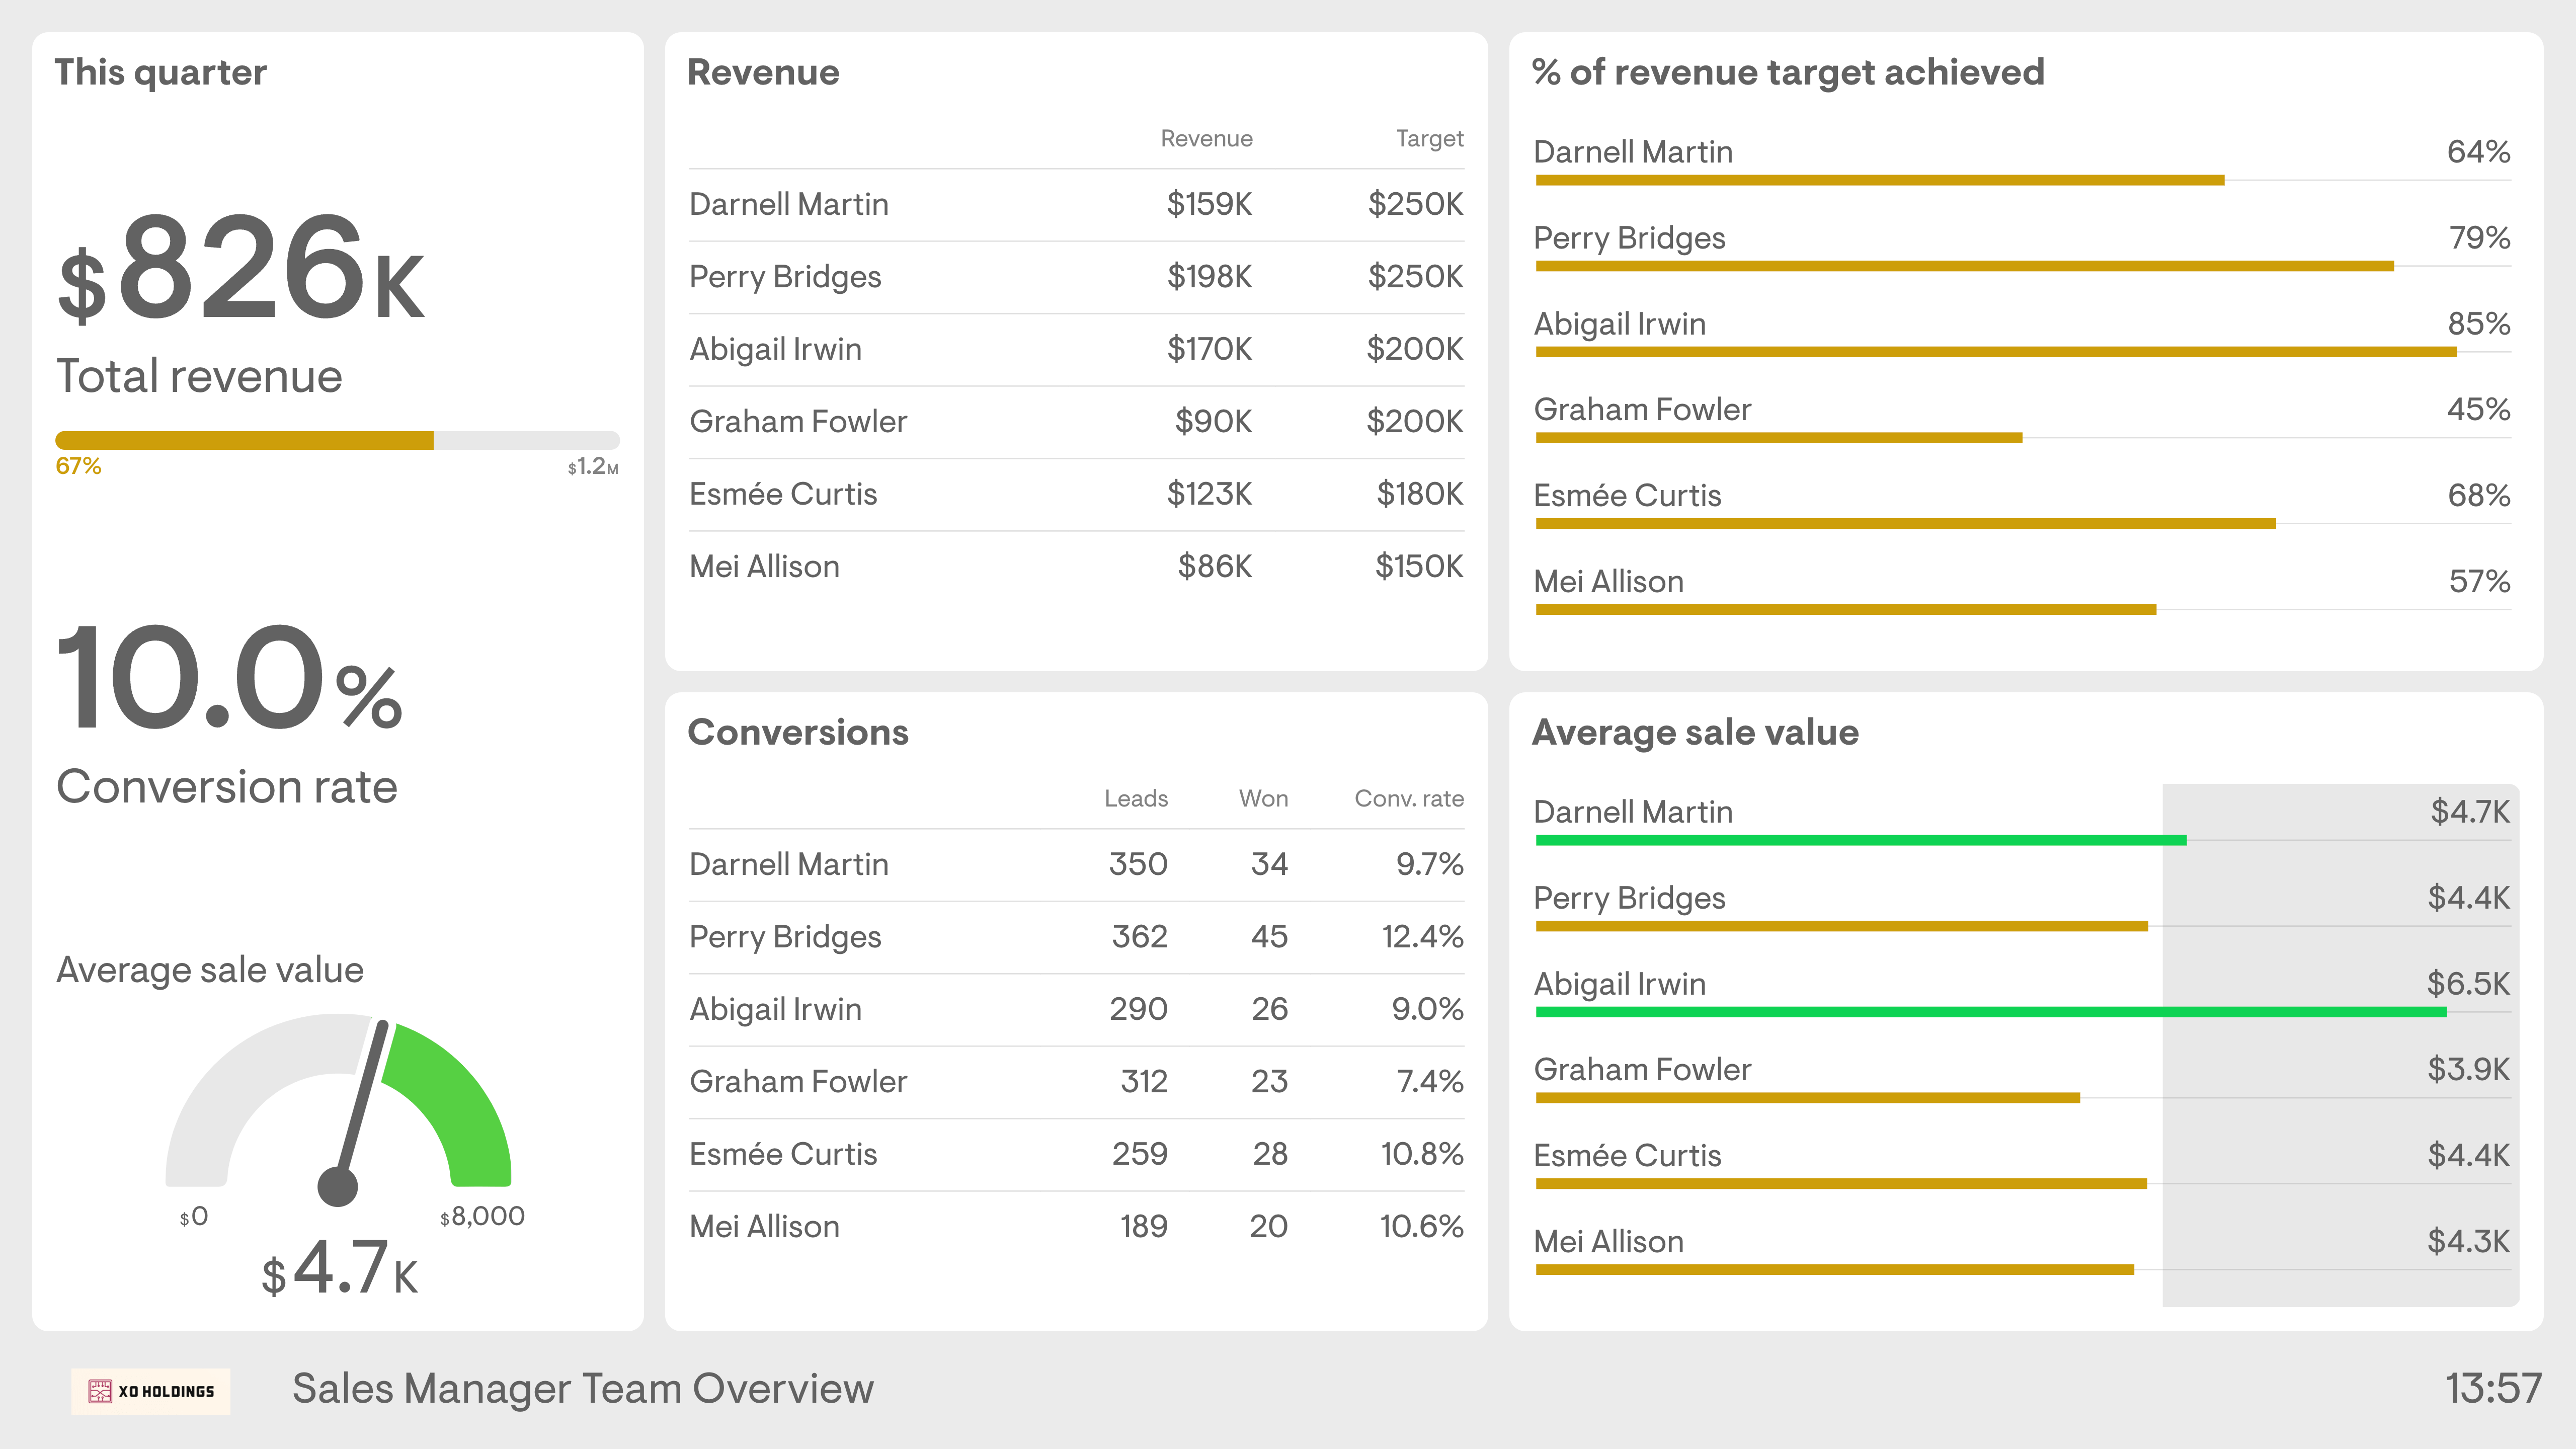
This overview dashboard shows how the individual members of the sales team are performing against their targets.
More sales dashboard examples
You can also check out another 13 Sales dashboard examples on our website. Or why not try Geckoboard for free, connect your spreadsheets, and create your own live sales dashboard today.
