What is a Sales Manager dashboard?
Sales Manager dashboards are designed to give Sales Managers a complete overview of the metrics they need to be effective in their role. The content of these dashboards can vary depending on the type of company they work for, or the product or service they are selling. Generally, these dashboards reflect the fact that Sales Managers have wide ranging responsibilities, such as achieving revenue targets and managing teams.
Different examples of Sales Manager dashboard
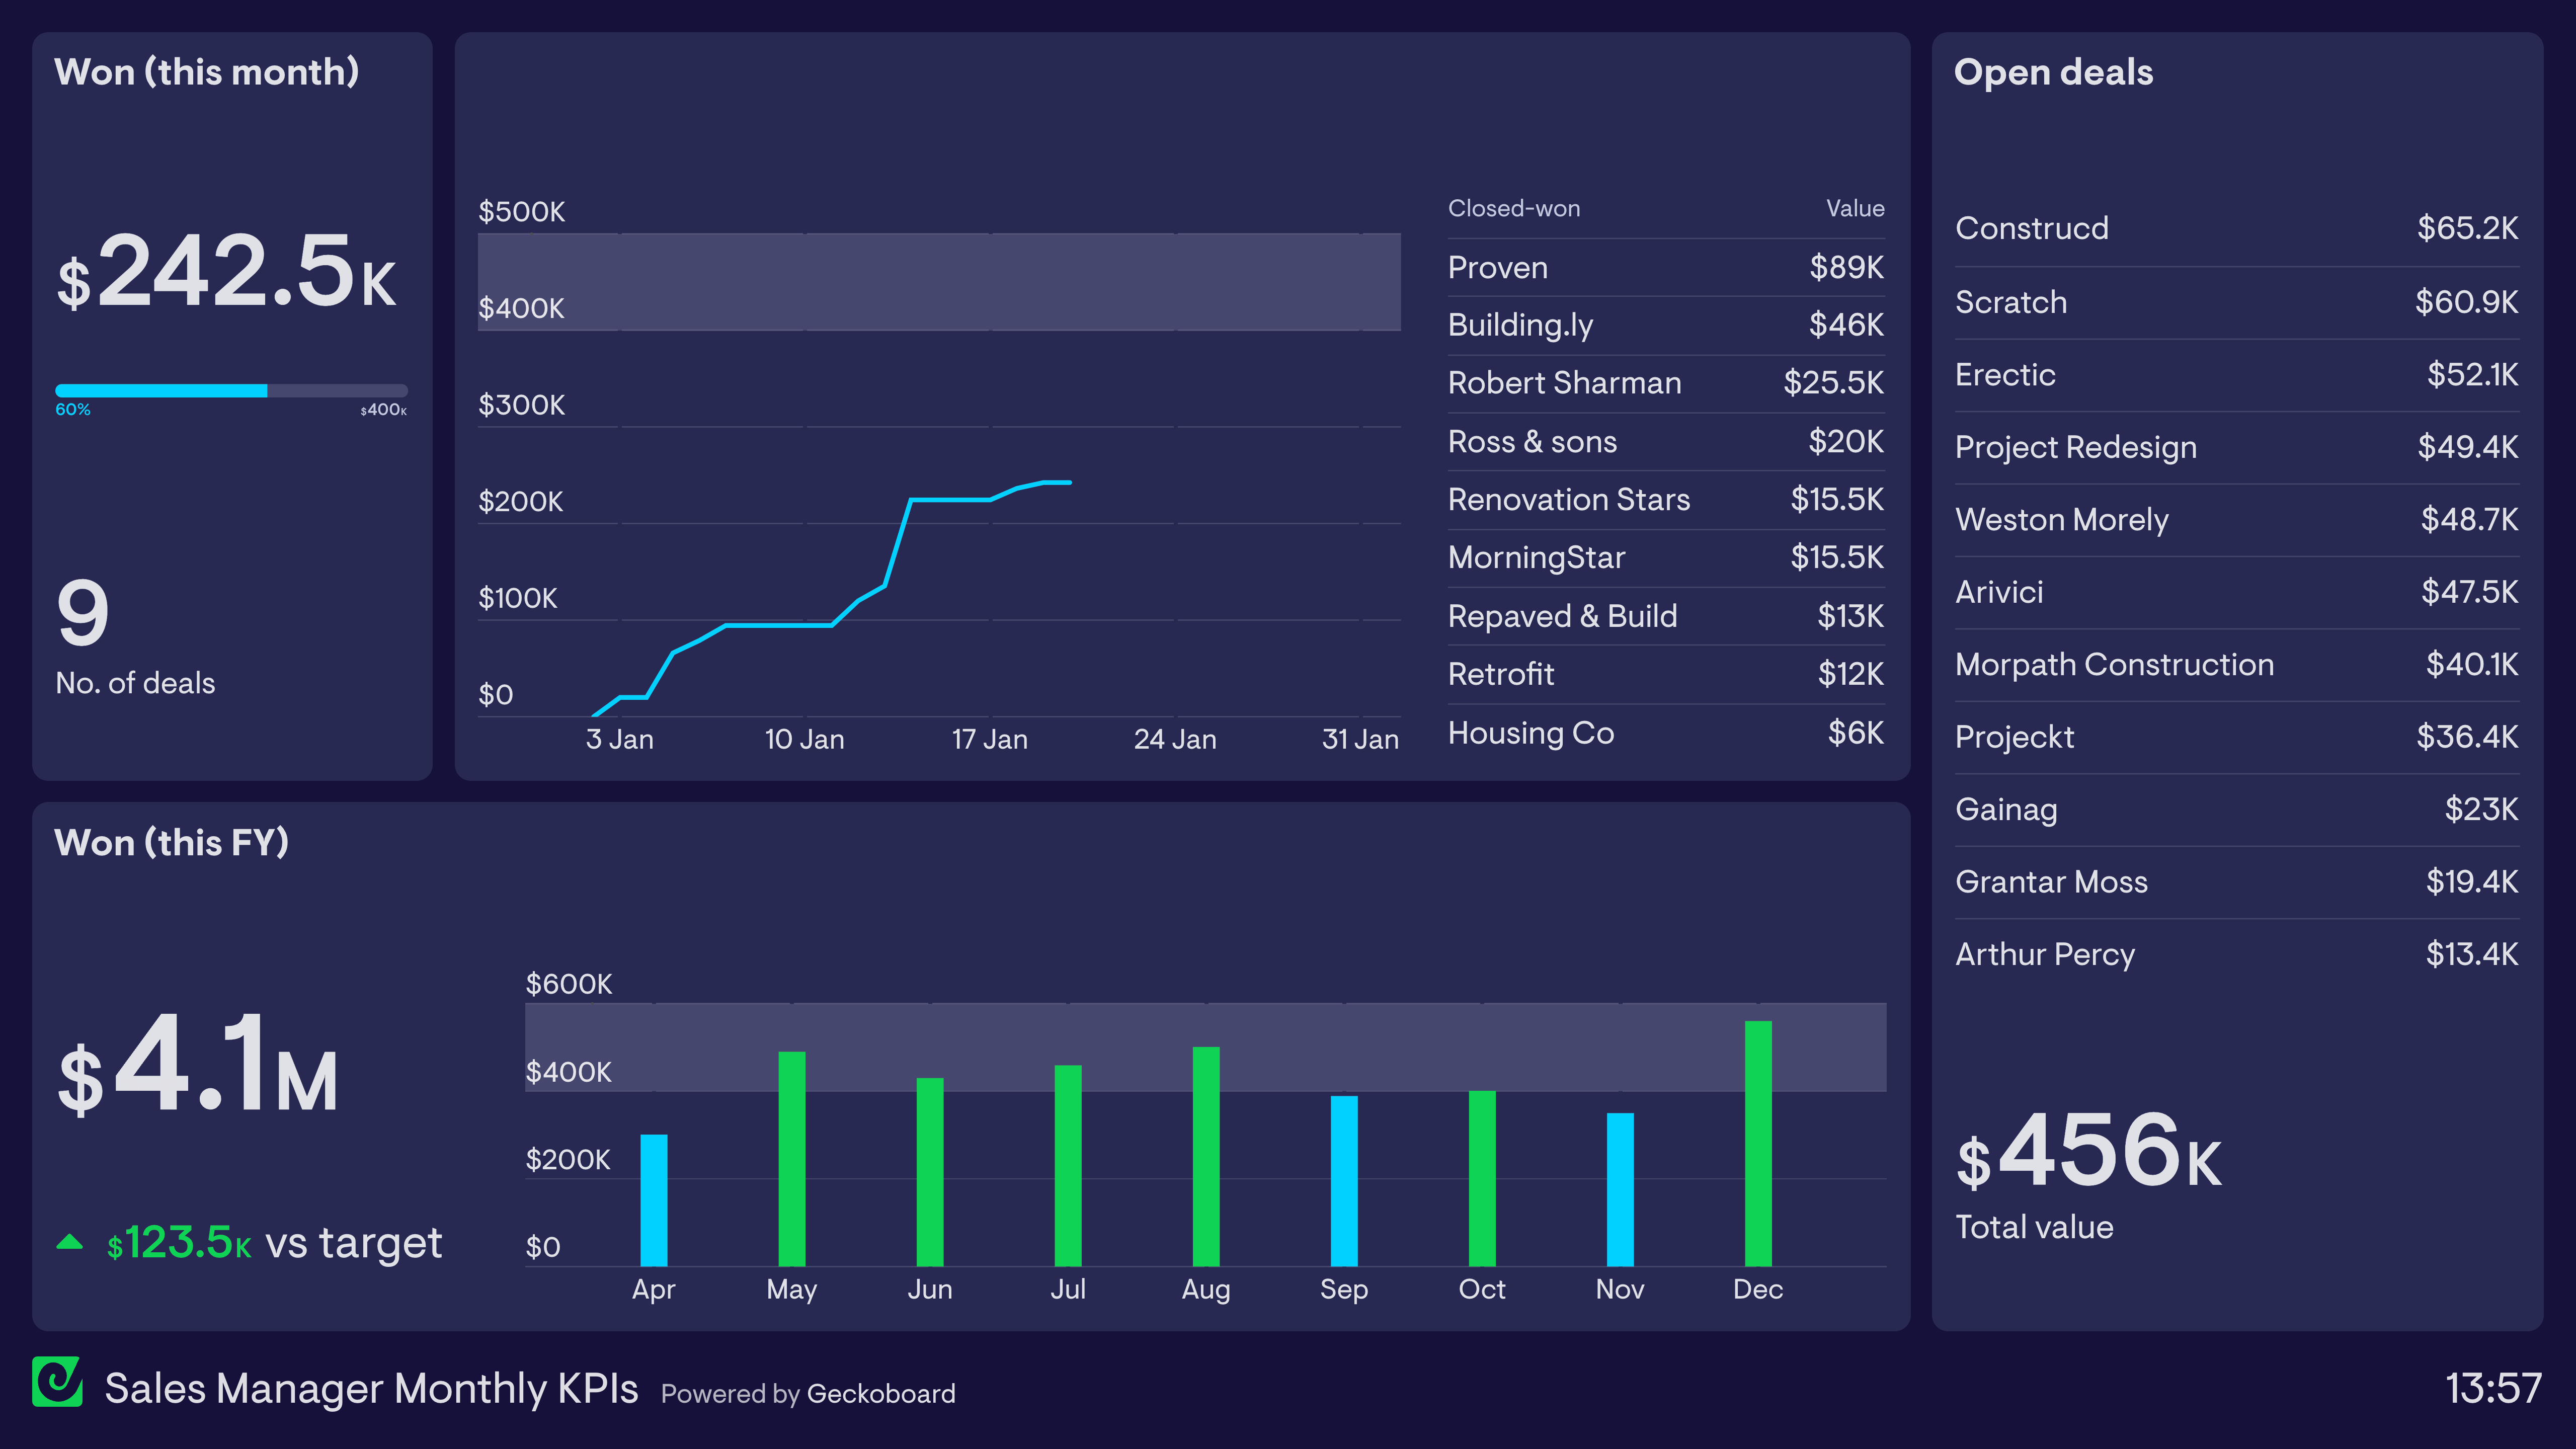
Sales Manager: Monthly KPI Dashboard
This dashboard focuses on the Sales Manager’s progress toward their monthly revenue targets. They can quickly track performance so far, including the deals that have been closed. The dashboard also shows the total value of the immediate pipeline, including the accounts that make up the pipeline. This helps them to calibrate how likely it is they will hit their monthly targets, or if they need to take a different course of action. For added context, the dashboard also includes revenue figures from previous months, including a green status indicator showing the months where the target has been achieved.
Focus area
Monthly targets, immediate sales pipeline
Who looks at it?
Sales Manager, Sales Director, CEO, Sales Team, Finance Director
How often?
Several times a month
- SalesforceGoogle Sheets
Tracking Orders vs Invoices
Many Sales Managers need to track metrics at multiple points of the sales process. The dashboard above is used by a company which supplies new offices and buildings with designer furniture. As a result, there is normally a 2-3 month gap between orders being placed and the actual installation of the product, at which point the invoice is issued. This means their dashboard needs to track both invoices issued and orders completed each month. The ‘total order book’ refers to orders which have been placed which have not yet been invoiced.
Focus area
Invoices issues, purchase orders placed
Who looks at it?
Sales Manager, Sales Director, CEO, Sales Team, Finance Director
How often?
Several times a month
- Google SheetsSalesforceStripe for SaaS
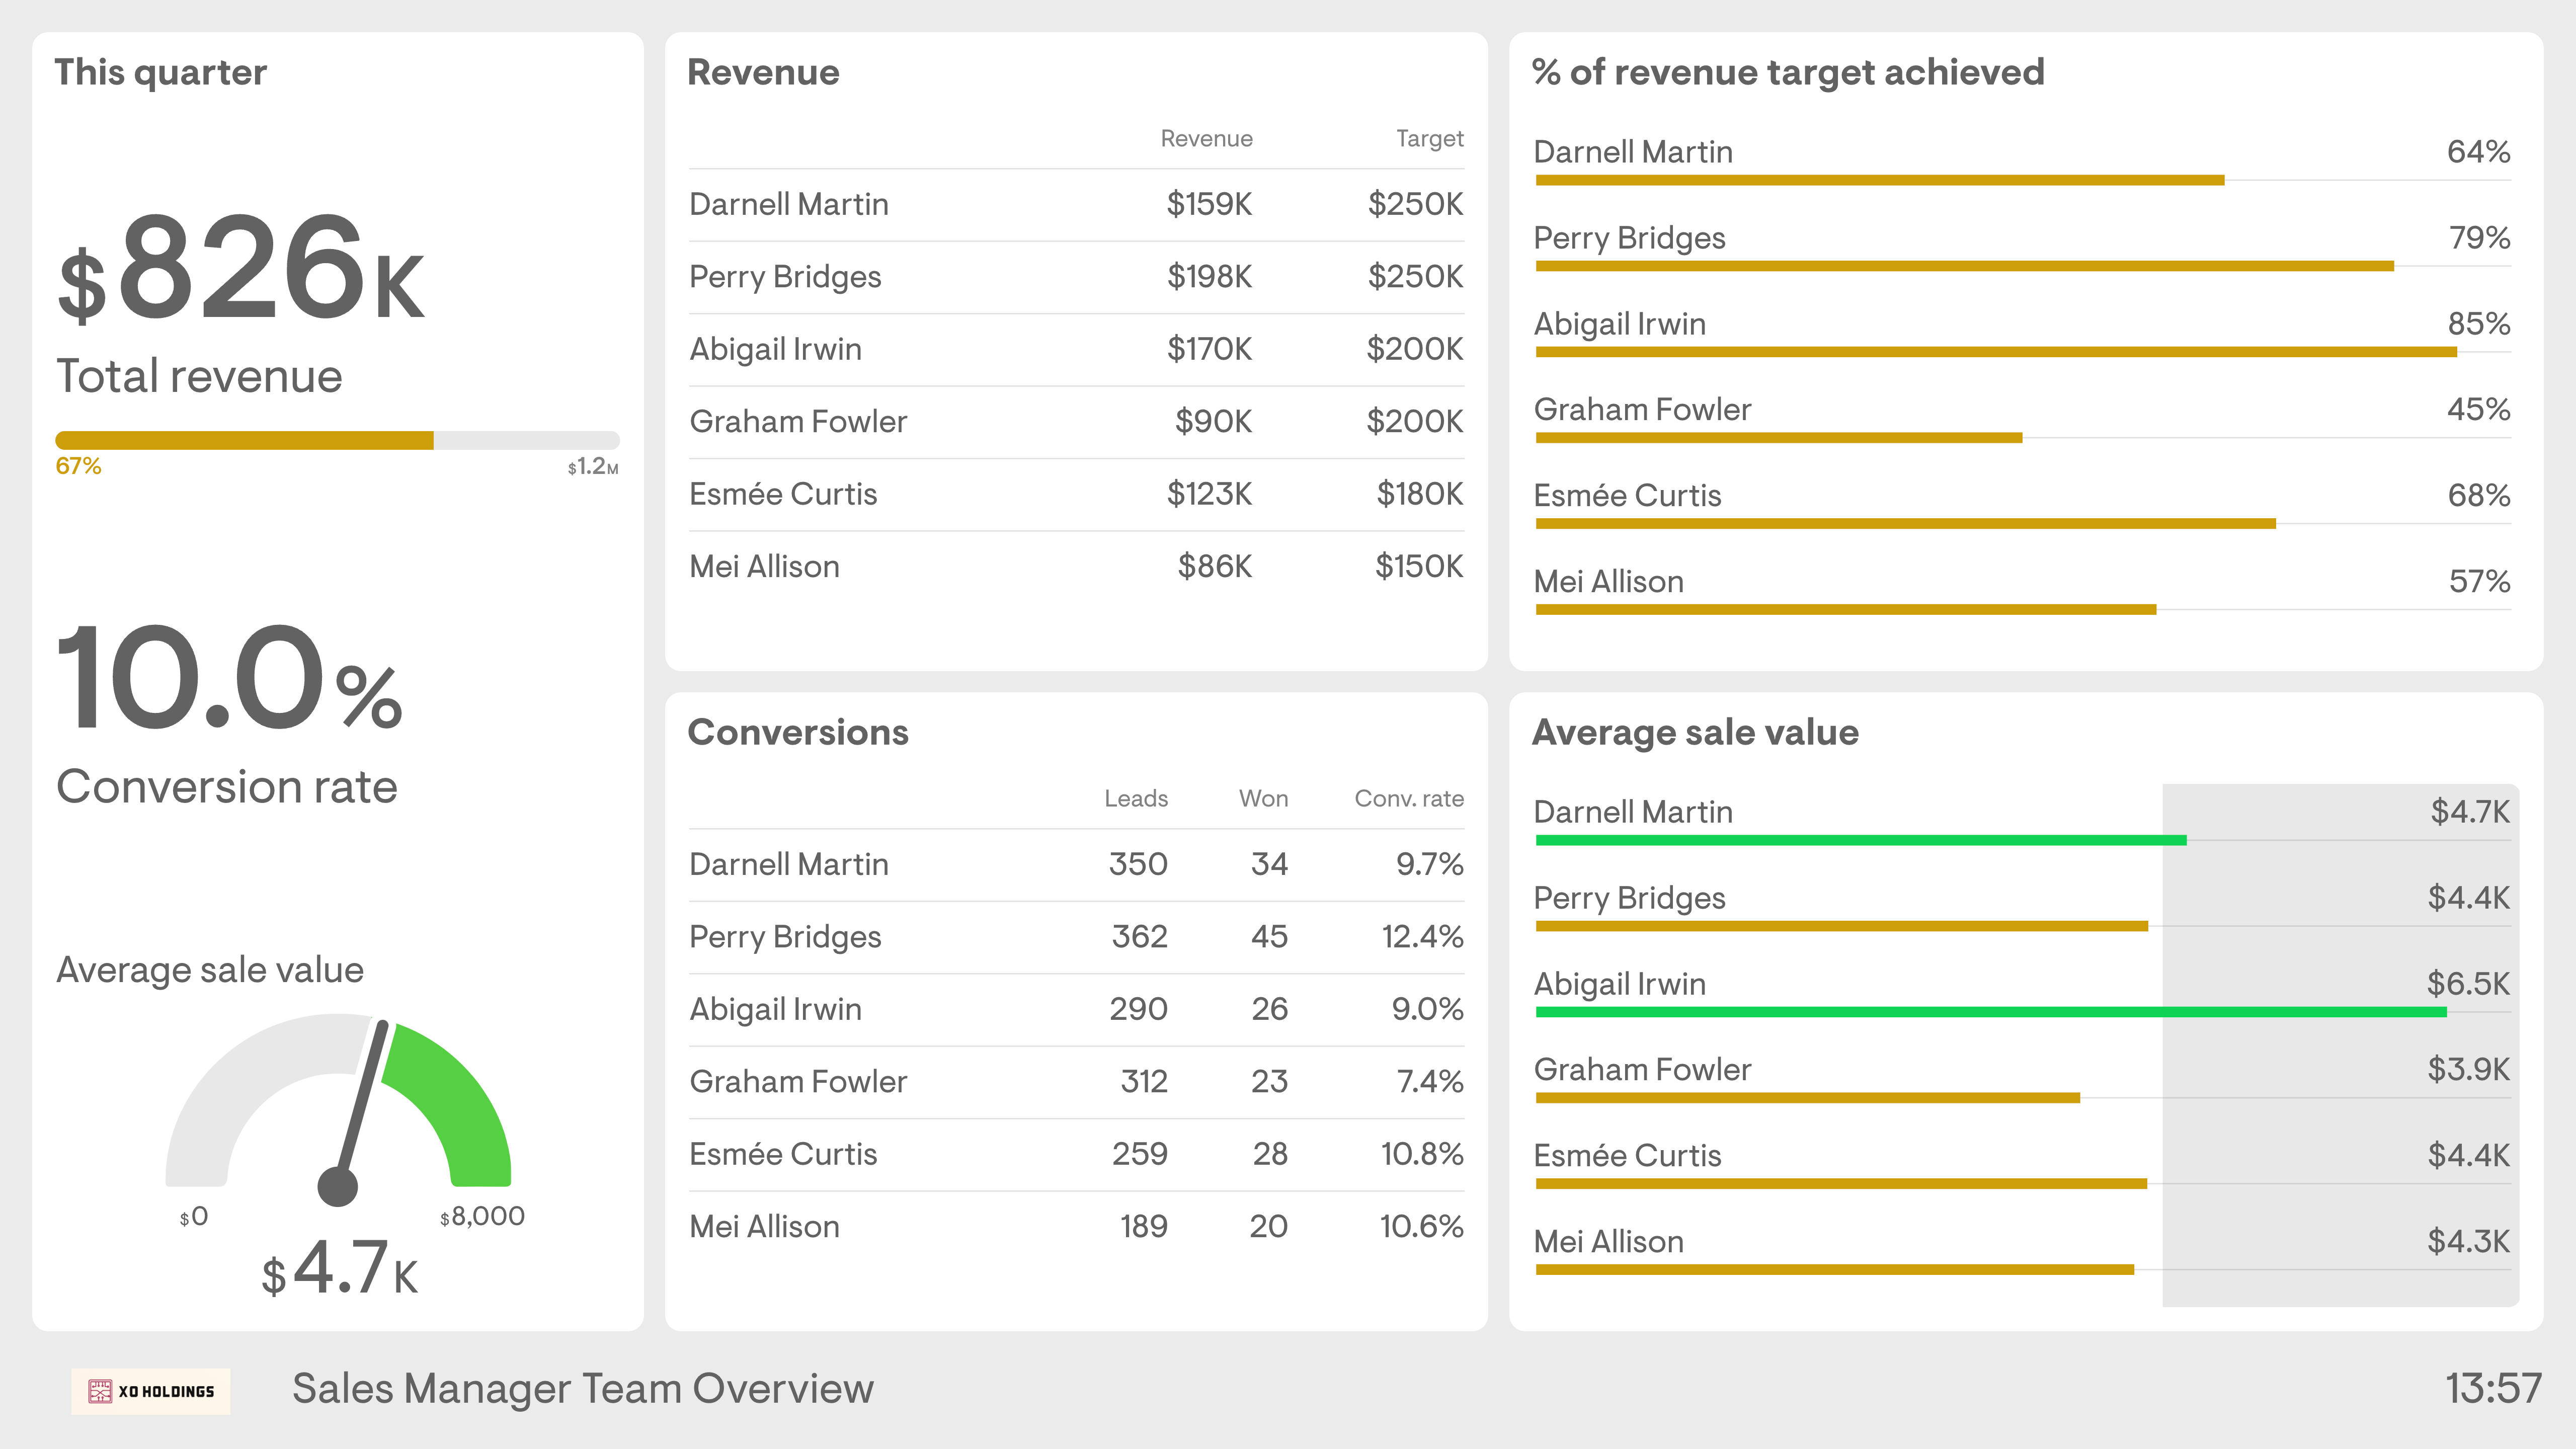
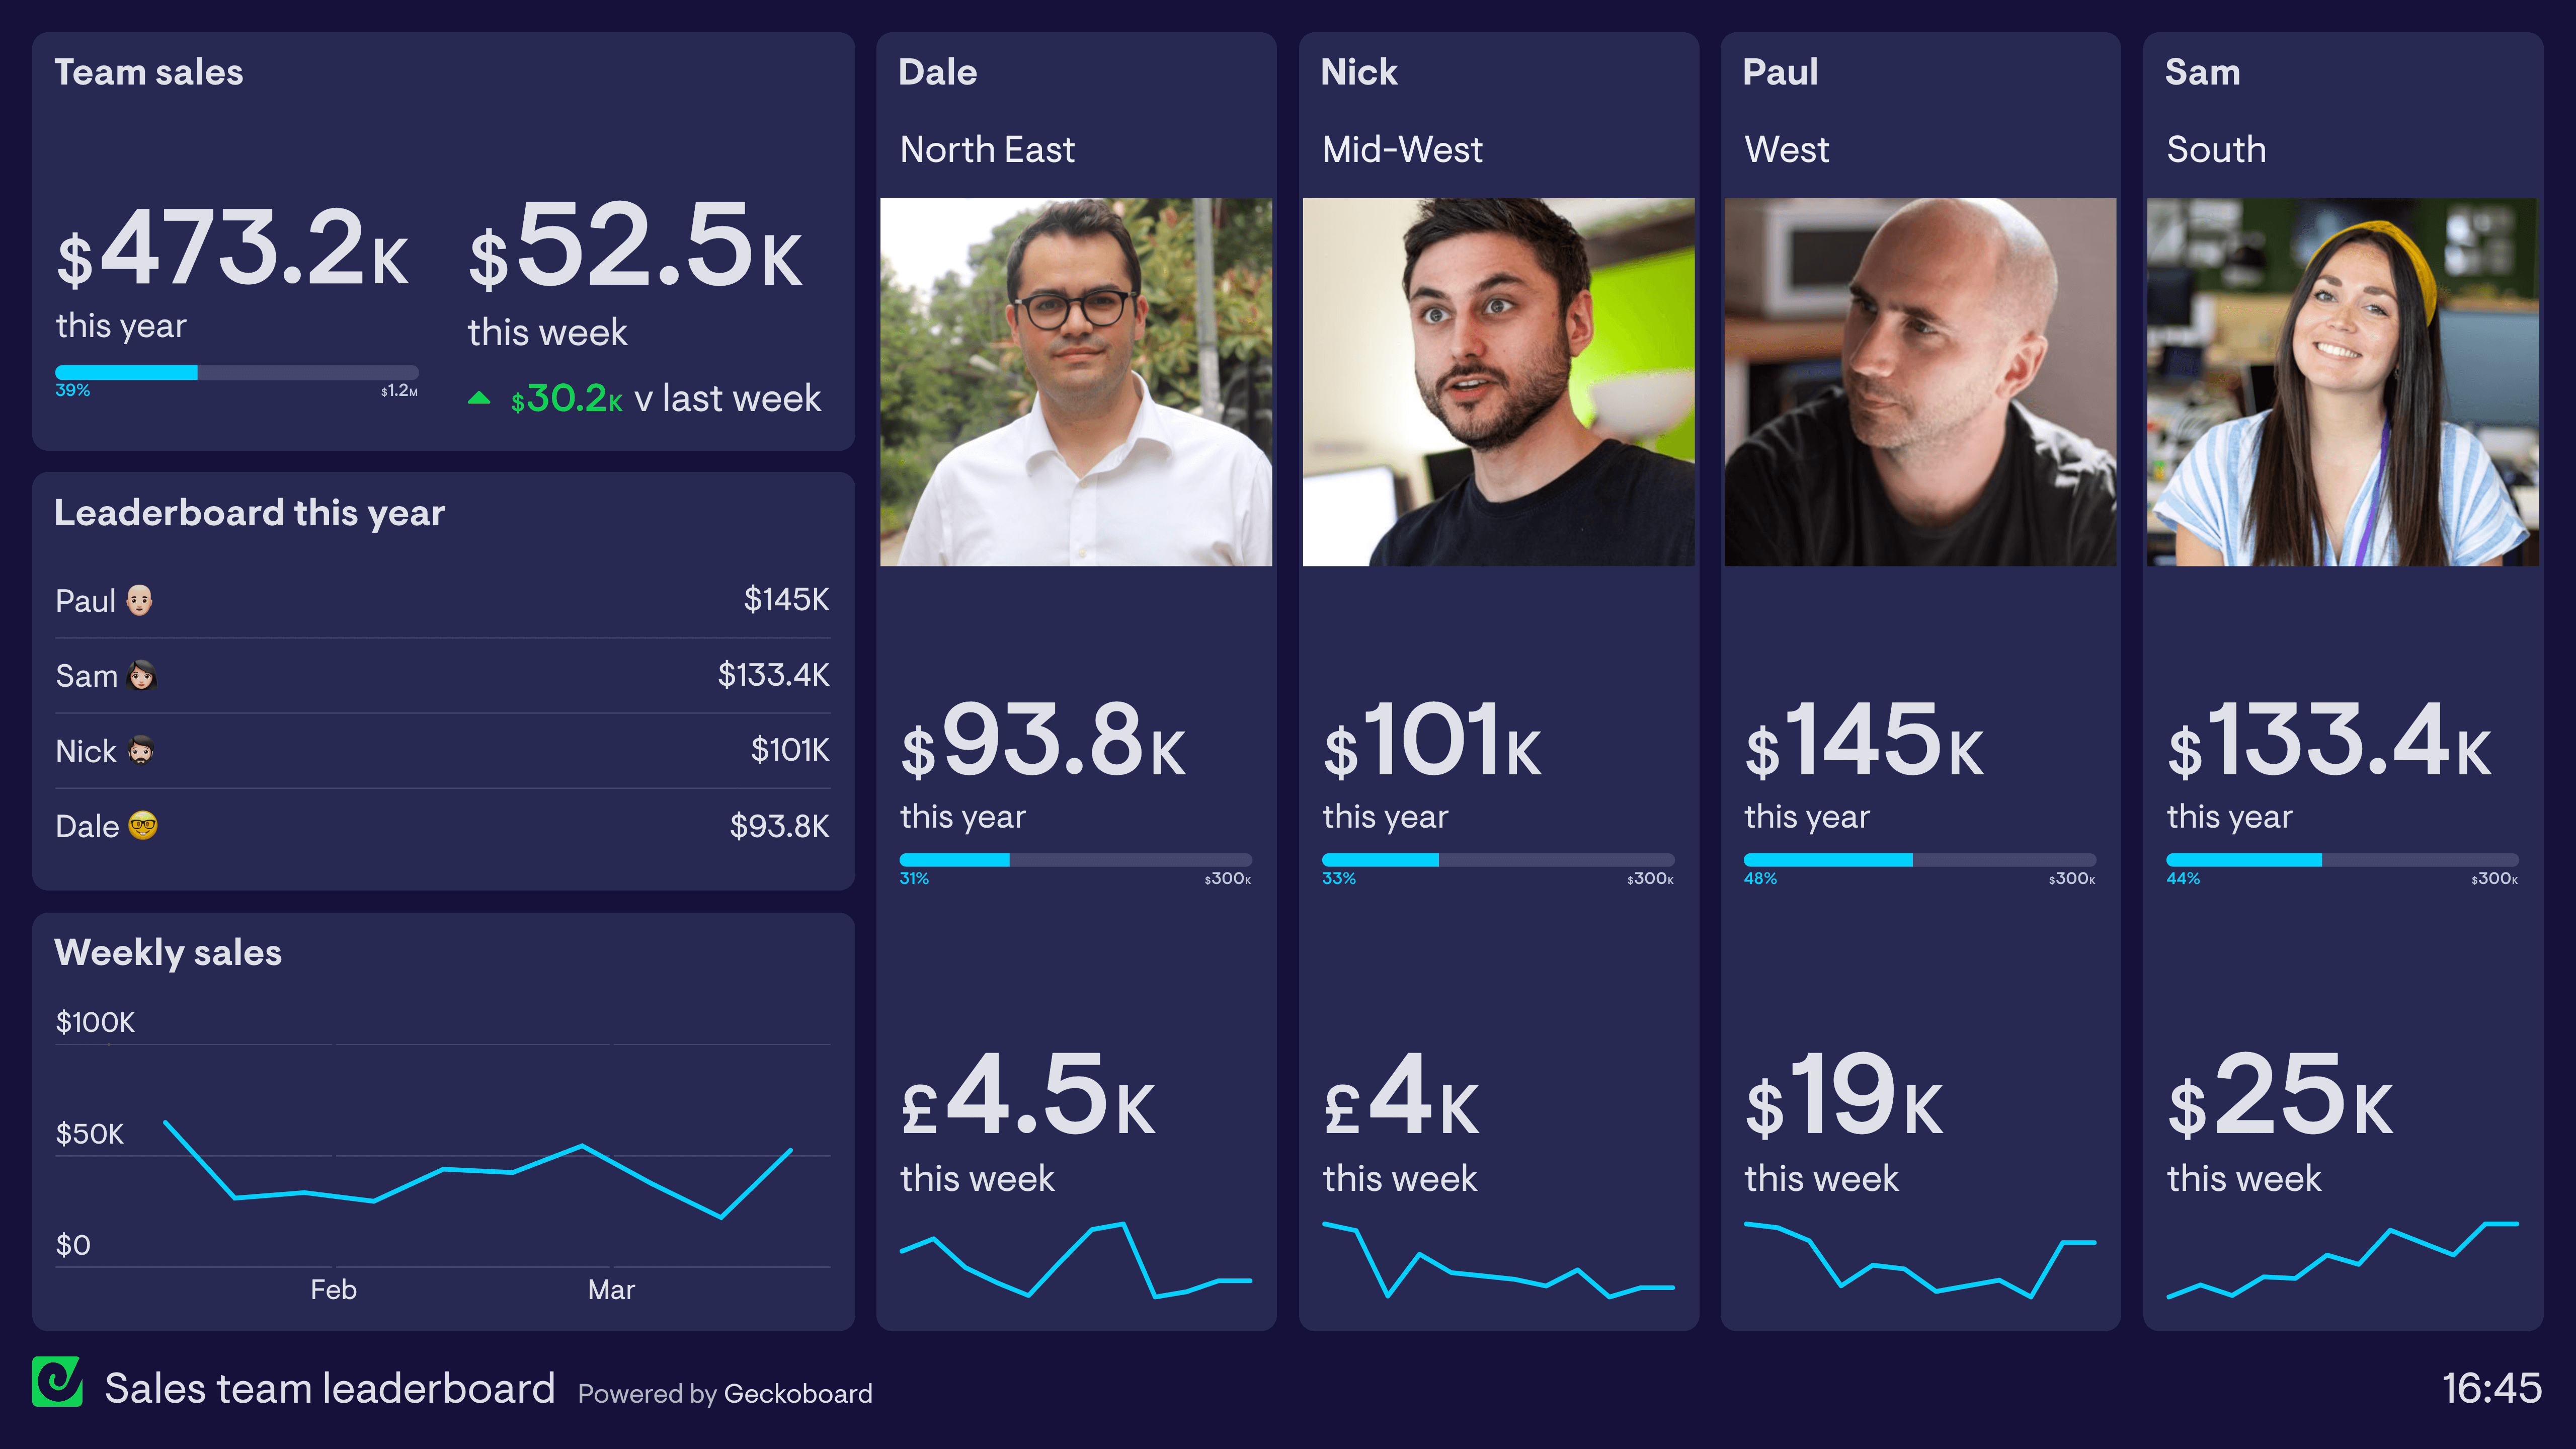
Sales Manager: Team Overview Dashboard
This dashboard focuses on the Sales Manager’s responsibility to manage and support their direct reports. It gives a clear overview of how individuals are progressing towards their targets, meaning the Sales Manager can quickly identify issues and provide extra support when needed. In addition to overall revenue targets, this dashboard shows secondary metrics such as conversion rate and average order value. This Sales Manager has decided to create a benchmark for what they consider to be a good Average Sale Value ($4.5k), perhaps to focus the team’s attention on upselling and/or high-value customers.
Focus area
Team performance, areas for improvement
Who looks at it?
Sales Manager, Sales Team
How often?
At least once a week
- SalesforceGoogle SheetsSpreadsheets
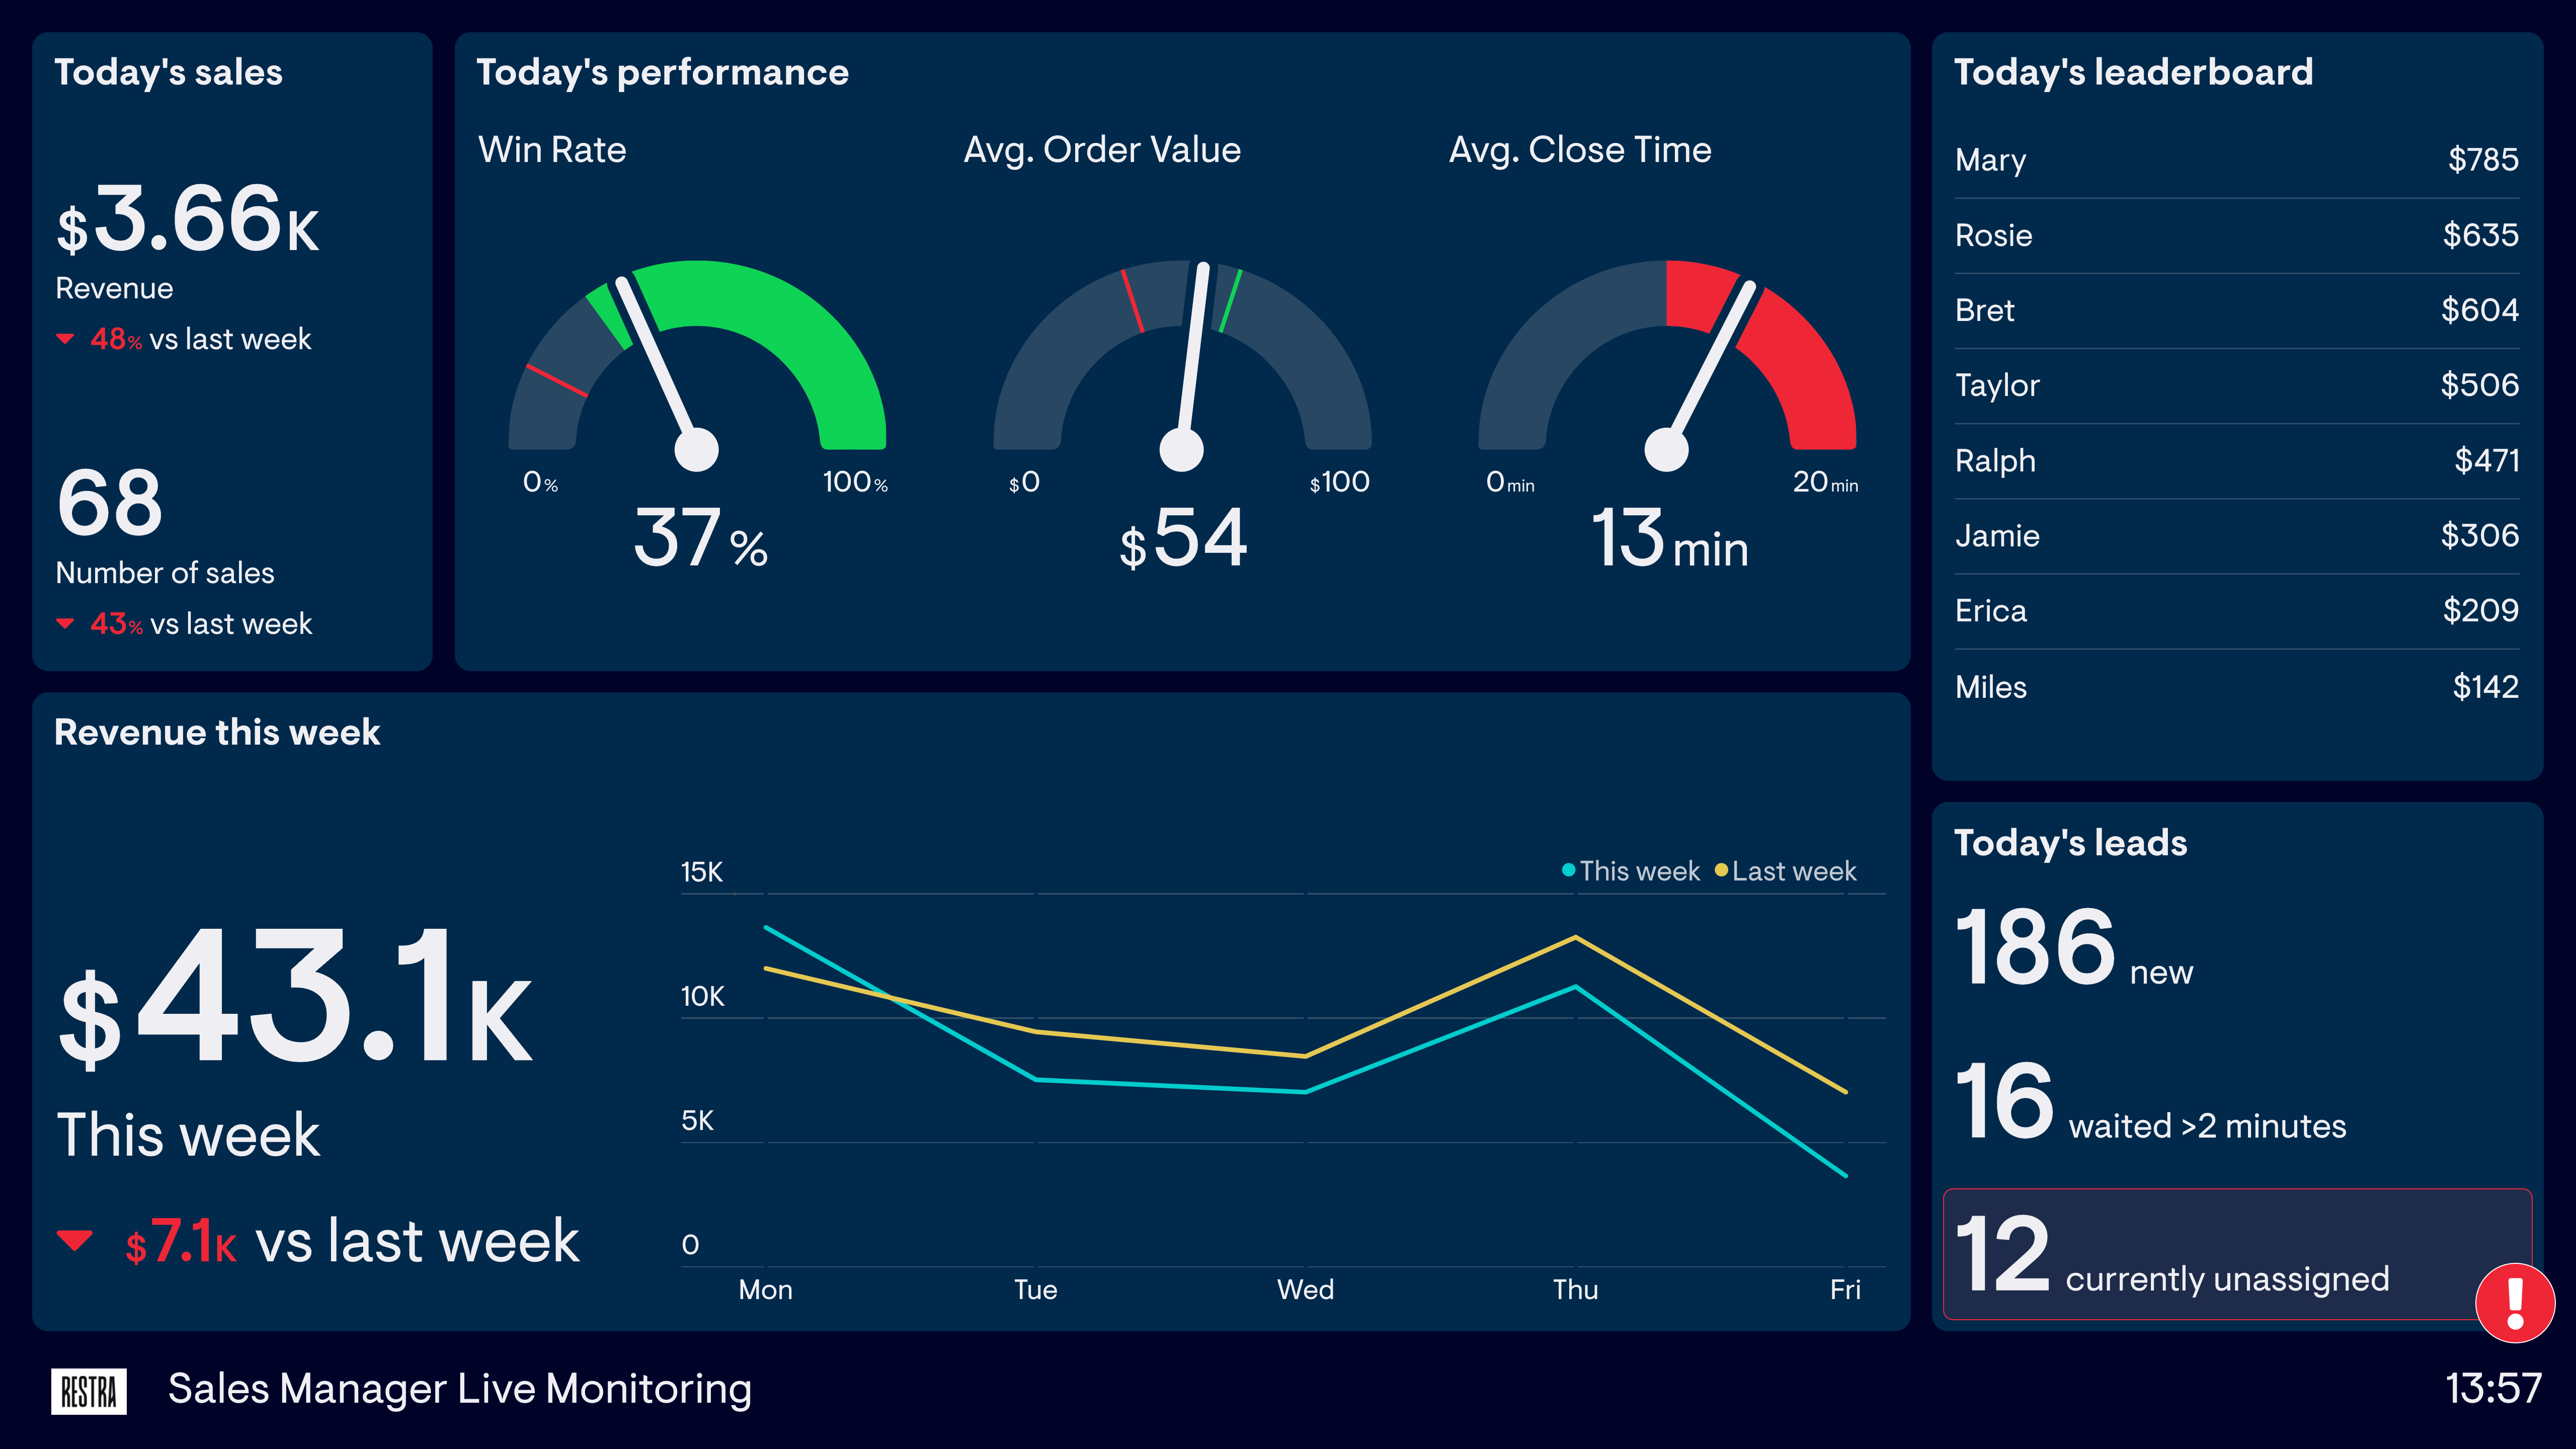
Sales Manager: Live Monitoring Dashboard
This dashboard is used by a Sales Manager who manages a sales team, which is set up to process a high volume of inbound leads. In a fast-moving environment, there’s a much greater need to monitor the status of current performance and respond to issues as they arise. As a result, this dashboard focuses on important real-time metrics such as Avg. Close Time and Currently Unassigned Leads.
Focus area
Current status, daily performance
Who looks at it?
Sales Manager, Sales Team
How often?
Many times a day
- HubSpotSpreadsheets