
If you're researching customer service metrics, you'll undoubtedly hear a few mentioned over and over, like CSAT and ticket backlog.
While these common metrics are useful, they alone can't give you the complete picture you need to boost your customer service game. By focusing on these and ignoring other, lesser-known customer service metrics, you'll miss out on vital information that can help improve your customer service strategy and your team's performance.
Complement your analytics with these six underrated customer service metrics. Each looks at your customer service team’s performance by focusing on the specific issues they face and giving an indication as to what exactly you can do to improve performance.

1. Next Issue Avoidance
If you just track the total number of tickets, you won’t see how many are from the same customer. Next Issue Avoidance looks at the number of customers opening multiple support tickets within a certain period of time. With this metric, you analyze data from larger numbers of support tickets to look for patterns in why customer open another ticket after their initial issue was resolved.
To calculate Next Issue Avoidance, count the number of customers in a given period who raised a ticket and then had another issue within seven days. Divide this by the total number of customers who raised a ticket within the period. If you offer a large number of products or services, you may want to count customers as repeat only if they raise multiple tickets for the same product or service.
You can use this formula to calculate Next Issue Avoidance:
No. of customers who raise 2+ tickets in a 7-day period / Total no. of customers who raise a ticket in that period
The goal with Next Issue Avoidance is to anticipate what the customer might need help with in the future, so the same person doesn’t need to come back with another (probably related) issue.
Say a customer opens a ticket because they are locked out of their account. The customer service agent resets the account, sends the customer a temporary password, and closes the ticket.
But then the person contacts your team again a little while later because they don’t know how to change their password. Your Average Resolution Time (ART) for each ticket might be low, but the customer (and your agent) actually spend longer trying to resolve the issue because they have to open new tickets for every aspect of the problem.
To reduce repeated tickets, the agent should determine what additional information the customer needs after resetting their account and send it along with the new password. This will save time and frustration both for your customer and for your customer service team.
Next Issue Avoidance serves as a useful health metric if you track speed-focused metrics like ART or First Response Time (FRT).
2. Escalation Rate
Escalation Rate represents those cases that a service associate couldn’t solve that had to be passed to a different support tier. This might mean an issue is passed to a manager or supervisor, but in many cases it means shifting the ticket to a specialist on another support team. A large number of escalations eat up valuable time for your agents and cause frustration for customers who have to be transferred between departments.
Calculate this customer service metric with the following formula:
[No. of support tickets escalated from first tier / Total no. of support tickets] x 100 = Escalation Rate
It’s true that your customer service team won’t be able to solve every problem on their own, and certain problems require specialist help. But a high or increasing Escalation Rate might indicate a deeper problem, such as:
- Insufficient knowledge or training for agents in the first support tier
- An ongoing problem with your product or service, causing more people to open tickets with problems that need to be addressed by a specialist
- Inefficient processes for directing the customer to the right agent the first time
Consider tracking this metric based on the reason for the transfer—whether that’s lack of knowledge, lack of permissions, or something else altogether. Implement a system where service associates input the reason for escalation when they transfer the ticket, so you can see the most common issues and work to reduce the need for escalation.
You may also want to track Escalation Rate for individual service agents to see who has the most escalations and for what reasons. From there, you can create personalized training and share educational resources to help the agent solve more issues independently.
3. Help Center Effectiveness
Monitoring Help Center Effectiveness means tracking how many tickets you get that the customer could have solved by referring to your documentation. By tracking this number, you can see whether customers are using your help center and finding what they need or whether your existing resources are not solving their issues completely.
Each time your team closes a support ticket, have the agent determine whether this problem could have been solved with an article in the help center. Then, have the agent tag the ticket, indicating whether the issue could have been resolved with existing documentation. Finally, use the following formula to calculate this metric:
No. of tickets tagged/ No. of total tickets = Help Center Effectiveness
Customers prefer to be able to resolve problems on their own rather than having to reach out to customer support. Improving your documentation can not only boost customer satisfaction but also save valuable time for your agents, freeing them up to focus on other tasks where they have have greater impact.
A high number of tagged tickets might mean your documentation is buried or inaccessible. To resolve this, you might set up an AI chatbot that helps your customers search the help center before connecting them with an agent. Keep in mind that if you don’t have much documentation, then your Help Center Effectiveness number will be low.
4. Service Level Agreement (SLA) Breached
Customer service teams often have a set of service levels they want each customer to experience. These are sometimes formalized in a service-level agreement (SLA), though more often they exist as an internal, informal standard set by the customer service team. The SLA Breached metric measures the percentage of times your company didn’t meet these service levels.
You can calculate this customer service metric with the following formula:
[No. of times SLA was breached / Total no. of tickets closed]*100 = SLA Breach Percentage
It’s easy to obscure poor customer service with “average” metrics. A few especially strong data points can bring up your average, hiding the numbers you’re less proud of. SLA Breached brings issues to the forefront by tracking how many customers are getting a poor experience.
To determine SLA breaches, you need to identify your top-priority customer service metrics: What KPIs represent the types of service your customers expect, either because of a formalized agreement or an informal understanding?
For example, you might expect team members to have a First Response Time of 20 minutes or less, or you might have established that an hour is the maximum time that a customer will spend on hold. In this case, either a FRT of more than 20 minutes or a hold time of more than an hour would indicate a breached SLA.
It also helps to look at trends with SLA breaches. Are multiple agents struggling with the same SLA target? Or is one agent struggling to meet several targets with their customers? If it’s an issue that affects the whole team, consider creating training for all agents to help them resolve the problem.

5. Customer Effort Score
Customer Effort Score (CES) measures how easy it is for a customer to solve their problem when they contact your customer service team.
By monitoring CES, you can identify areas for improvement within your support team and its processes. The metric may indicate whether customers are finding the most helpful support channels for their questions or whether your agents are efficiently routing people to qualified team members.
Tracking CES alongside CSAT helps you understand customer satisfaction with more precision. A customer might report that they’re satisfied with the end solution but also indicate that finding the answer took a long time. If you tracked only CSAT, you might not take any action. But by monitoring CES as well, you’re better equipped to increase customer satisfaction even further by making the support process easier.
A high CES combined with low overall Ticket Volume might also indicate that customers are unsure how to contact your team or that the process is confusing or difficult enough that many customers simply stop trying.
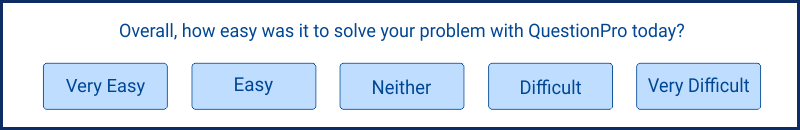
Measure CES by surveying your customers at the end of each support request. For example, if you are using a chatbot to resolve an issue, set up the bot to ask, “How easy was it to solve your problem today?”
There are a few options for survey type. You might use a simple smiley system, where customers can select one of three options:
- happy face (1 = easy to solve)
- neutral face (2 = average difficulty)
- sad face (3 = hard to solve)
Or you could use a more in-depth survey and have customers rank their difficulty from 1-10 or from “easy” to “hard.”
You might also send out an email survey with the basic ranking question, along with an optional text box. Whatever ranking system you use for CES, make sure it's consistent for all customers.
With your customer scores in hand, use this formula to calculate the average difficulty of use:
Sum of all the ratings / No. of survey responses = Customer Effort Score
If your CES is consistently high, consider reaching out to customers with a follow-up survey to find out in more detail what issues they had so you know where to focus your improvement efforts.
6. Touches per Agent
Simply looking at the Number of Tickets Solved per agent might not be showing you the full picture—especially if there are big discrepancies between the difficulty and the types of tickets agents are taking on. Start tracking how much communication a ticket requires by looking at Touches per Agent.
You can calculate this customer service metric with the following formula:
Total no. of ticket touches/Total no. of resolved tickets=Average Ticket Touches
Say in one ticket an agent sends four distinct messages:
- Messages the customer to tell them their ticket is being reviewed
- Asks a follow-up question
- Offers a solution
- Asks whether the solution worked
That’s four touches for that agent.
Apply the formula to each agent to see Average Touches per Agent, then compare averages across different team members.
If an agent has consistently more ticket touches than other agents on the team, consider investigating whether they are regularly handling more complex tickets. Their Average Touches may be higher than normal because they’re a specialized agent who solves technical problems. Or the agent may need training on how to quickly resolve certain types of issues.
You might also have agents mentor each other. Say one agent takes three touches to solve a locked account, while another agent takes seven. You might have the former agent reach out to the latter to offer tips on how they can resolve this issue more quickly, such as by linking to a help-center post.
Display your customer service metrics to elevate team performance
These six customer service metrics offer valuable insight into how quickly and effectively your team can resolve customer service issues. Keep these metrics top of mind by monitoring them on a data dashboard. Display the dashboard in your office on a TV or a computer screen, or share it with your team in Slack.
Surfacing your customer service metrics in an easily digestible way will help you and your team see day-to-day changes and catch potential problems before they have a chance to grow.
Interested in seeing how data dashboards can help your team? Try Geckoboard for free!
