Average Resolution Time
What is Average Resolution Time?
Average Resolution Time is the average time taken by your support agents to solve all opened tickets in a given time frame. Measuring on a per-agent basis allows you to see who is taking longer to solve tickets. Your Average Resolution Time will vary depending on the complexity of the customer service issue and the ratio of available agents to queued tickets in the measured time frame.
This metric is also referred to as Average Time to Resolution, Average Ticket Resolution Time and Mean Time To Resolution (MTTR).
How to calculate Average Resolution Time?
Total Resolution Time for all tickets solved / No. tickets solved = Average Resolution Time
Calculate your Average Resolution Time by dividing the total resolution time for all tickets solved in a specific time frame by the total number of tickets solved in that same time frame.
You can also make the same calculation, but filter out tickets marked as pending and on-hold.
What do Resolution Times Tell You?
If your Average Resolution Time begins to increase, you’ll need to investigate the underlying problem. It could indicate either that your support team needs additional help and training to handle more complex customer queries, or a lack of coordination between the support team and those brought in to assist with complex queries e.g. engineering.
There can be multiple resolution times in the life cycle of a ticket. First Resolution Time counts the duration between when a ticket is first created and the first timestamp the ticket is marked as solved, whereas Full Resolution Time counts the final, or most recent, marking as solved. This means that if a ticket is reopened the full resolution time will extend. First Resolution Time can be preferable when customers are offered a long duration, say 14 days, to reopen a ticket after it’s marked as solved.
You’ll want to see these two resolution times as close together as possible. Maintaining a low Full Resolution Time that is close to First Resolution Time means that your team is solving issues first time without having to reopen tickets. If, however, your resolution times are too far apart then you might need to improve your Next Issue Avoidance. This metric looks at how many customers have more than one issue in a given time frame (often looked at over a week or a month). Let’s say a customer’s ticket has been resolved and thereby counts as the First Resolution Time, but then it’s reopened and continued because of an issue unrelated to the original, this then extends the Full Resolution Time. Perhaps while that ticket was open and the original issue was being looked at a chance was missed to flag up any additional issues the customer had that could be solved in the meantime.
A ticket’s resolution time will also be affected by being marked as pending and on-hold during its lifecycle. Pending means you’re waiting to hear back from the customer before you can proceed, while on-hold is when you’re waiting for input or resolution from a third party. With their potential to lengthen your resolution times, and often in circumstances beyond your control (e.g. a customer begins annual leave while a ticket is pending), you might want to consider filtering out tickets marked as pending and on-hold.
Give your support team a boost
With Geckoboard’s real-time dashboards, everyone knows exactly what’s happening in CS right now.
Find out more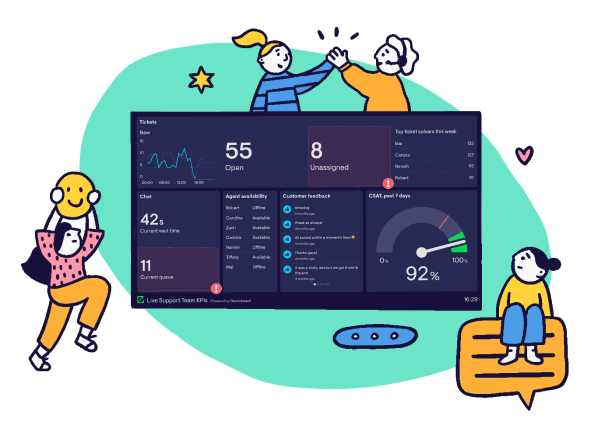
Should you track Average Resolution Rate?
Average Resolution Time is an important metric for tracking the performance of experienced support teams and individual agents, in addition to highlighting potential improvements to internal workflows and processes.
This metric can potentially impact directly on your customer satisfaction (CSAT) score and reflects your team’s efficiency, in that people don’t want to wait a long time to have their problems resolved. However, focusing solely on resolution time is not necessarily a good idea. You need to look deeper at the reasons behind the numbers.
When used in combination with effective tagging and categorization of tickets you can see if the tickets that are taking the longest to be solved correlate with those that require, for example, additional engineering work (to fix bugs) or input from finance. If the numbers support that view, you can begin exploring the deeper reasoning behind the delays. Is there a bottleneck, where one individual’s knowledge and skills are key to the resolution of these types of tickets? If so, then there may be ways to reduce the number of times you need to call upon them e.g. subject training for support agents or improving your self-service content. As for bug report tickets, resolution times can be affected when the technical information needed to understand and replicate the issue is insufficient or missing. In this instance, a support team might benefit from a technical link person to inspect bug reports before they get passed onto Engineering.
Looking at Average Resolution Time in isolation can also mean you miss key context. You could, for example, have two customers with the same technical issue handled by different agents. For the first customer their ticket was created and solved in the space of two weeks. In that time the first agent updated the customer at every stage so they felt in control and reassured. The second customer’s ticket took only one week to be solved, but the second agent failed to keep the customer informed, re-routed it and replied a week later to say it was fixed. Even though the resolution times showed the second customer’s issue was solved quicker, it resulted in a poorer experience. And a missed opportunity to improve Next Issue Avoidance.