
Josh Hus, IT Services Manager at Veho, tells us how their internal Help Desk use Geckoboard to track workload as well as to spot ongoing issues that might need addressing.
Hi Josh, tell us about your role and Veho
I’m Josh Hus and I’m IT Services Manager at Veho. I manage our Help Desk and assist the Head of IT to roll projects out across Veho. I have a team of three agents with around 900 monthly internal IT support tickets.
Veho is a last mile delivery company. We’re a start up who received series A funding just over 2 years ago, so there’s a lot going on! We work with clients (such as HelloFresh, Stitch Fix, Nordstrom and Rent the Runway) to provide a customizable delivery experience. We’re filling the gap between the great online experience and the great product you receive to make sure you get great delivery service too.
Why did Veho set up Geckoboard dashboards?
Prior to me joining Veho there was no way for us to see what was happening within our department. We had no oversight of real-time metrics with our Zendesk account and found the reporting there to be convoluted, plus it didn’t look good. Previous to implementing Geckoboard, we’d dig every now and again into a metric on a one-off basis but our department wasn’t measuring performance on a regular basis.
My boss knew about Geckoboard as a way to display Zendesk metrics so he got our dashboard up and running. When I started he shared the board with me to see if it was something I’d like to work with and I was very happy not to have to do my reporting in Zendesk!
It’s rare that I look at our dashboard and see a problem, so the majority of the time I look and just see everything is good but it is nice to know that if something goes awry - I’ll very quickly be able to spot this.
Tell us about your dashboards
Our dashboards cover SLAs, employee feedback, solved ticket leaderboards for the past 7 and 30 days, CSAT score and a list of ticket request types over the past 30 days. We use Notion as our internal Help Center and have Geckoboard embedded into our IT page there so it’s viewed there by the team and anyone within the company who comes to us for help. It gives everyone visibility of our workload and how we’re getting on.
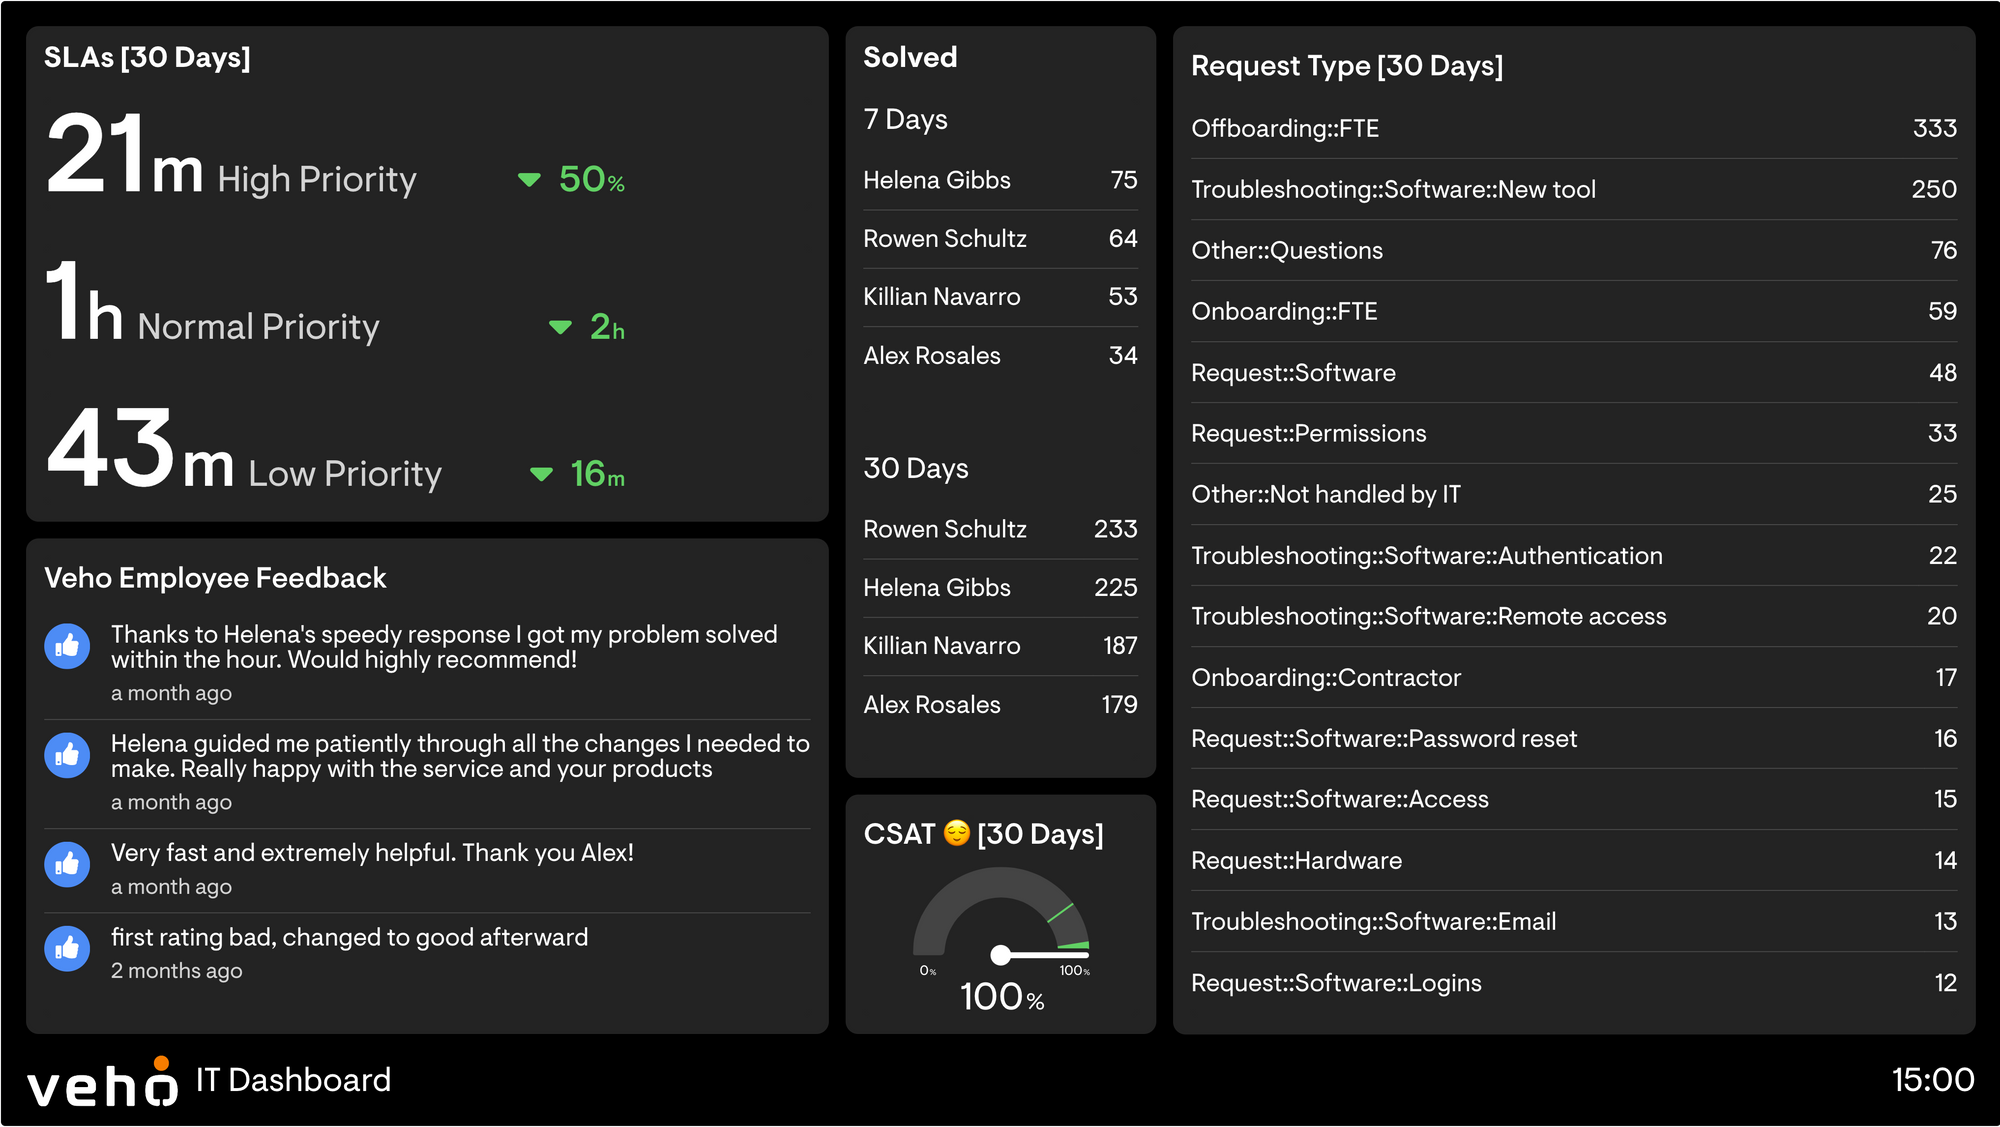
We help staff with a range of things within the company, some tickets are very easy like password resets and others like onboarding tasks take much longer. This is where Geckoboard has really helped us, we’ve been able to track which tickets are most requested over the past 30 days or so. We use the Interactive View to drill down and into ticket types and see the way our ticket requests are trending over time.
Staff offboarding help is our most common request and that’s where you see the team putting in the most work - it’ll be one ticket but within that ticket there are multiple tasks and it’ll take a lot longer to close. Geckoboard helps us to see the workload we’re dealing with and what we’ve achieved over the past month.
What are the most important metrics on your dashboard?
For myself and my boss, the ticket type leaderboard is the most important section of the dashboard. It gives us a good understanding of what the company might be having trouble with and what they need from us. Using the Interactive View within Geckoboard I can drill down more specifically into trends over extended periods of time and can download the source data on this if I need to work with information from elsewhere. It’s really handy.
Employee feedback has also been a really useful thing to track. I found it hard to gather this neatly within Zendesk. It helps me to measure success but also in the rare cases that we get a negative review, I see it straight away and can check in with the agent who dealt with the case to make sure they have support from me to get this resolved.
We don’t currently have defined SLAs, it’s something we’re working on at the moment so we have space for these on our dashboard whilst we work this out.
How is Geckoboard helping you work out your SLAs?
The SLA section of our dashboard is there to help us figure out if we want to use them - the team responds very quickly so we’re tracking these metrics at present to figure out if they would be appropriate for us. It is also helping us to understand, if we do use SLAs, what they should look like.
Zendesk doesn’t really allow you to adapt your SLAs once they’re enabled. The dashboard is a great way of easily seeing what it will look like to have SLAs. If/when we start using SLAs, Geckoboard is where we’ll track them, it gives us a snapshot of what the SLAs are and if they’re being breached or not.
Finally, how does Geckoboard impact your team?
For the team, the dashboard has created a competitive nature from seeing how many tickets have been solved in the past so many days. It gives agents a boost to see they’re top ticket solver. From a management perspective, if I see someone is closing significantly less tickets I am able to catch up with that person to see if everything is OK. We have a great team of hard workers, and I know they’re not slacking, but I’m able to see in the data if there might be an underlying issue that they need support with.
We recently rolled out a tool which requires significant troubleshooting and have seen those tickets move to the second most requested type. Prior to the roll out, this issue didn’t exist. Getting that oversight of what’s happening with certain ticket types helps us to work out areas we need to address things as a company, an IT department or where we can automate tasks which make up consistent tickets. With the visibility Geckoboard provides, we immediately notice these kinds of issues arising before they become more serious.
