Importing live data into a Google Sheet or Excel spreadsheet might seem like a daunting task, but it’s easier than you think…
If you’re reading this you probably know spreadsheets are a useful way to aggregate, tidy and analyse data. But what you probably don’t know is that with some simple techniques and plugins, any humble spreadsheet can be transformed into an incredibly powerful, automated, data-gathering machine that can save you or your team hours of manual input.
In this post we look at four different ways to get almost any data into a spreadsheet.
How to get data into a spreadsheet
1. Manual input
Wait, aren’t we supposed to be looking at ways to import live data into a spreadsheet automatically?
Well, yes, but adding data into a spreadsheet by hand shouldn’t be dismissed entirely. Although it might seem inefficient, there are scenarios where this is the best or only option for getting data into a spreadsheet:
- If you’re working with small set of data on a one-off basis
- If your data doesn’t update frequently
- If the data sources you’re working with don’t allow data to be exported
- As a quick proof of concept that could be automated later
In addition, manually adding data to a spreadsheet can be made more efficient through outsourcing to a virtual assistant. Sites like Upwork, Freelancer.com and Fiverr make it quick and easy to find talented individuals who can help with large or repetitive data entry tasks. But we’ll save that for another post.
2. Use a third-party data import tool
A number of services, add-ons and tools specialize in getting data from a variety of sources into Google Sheets and Excel spreadsheets.
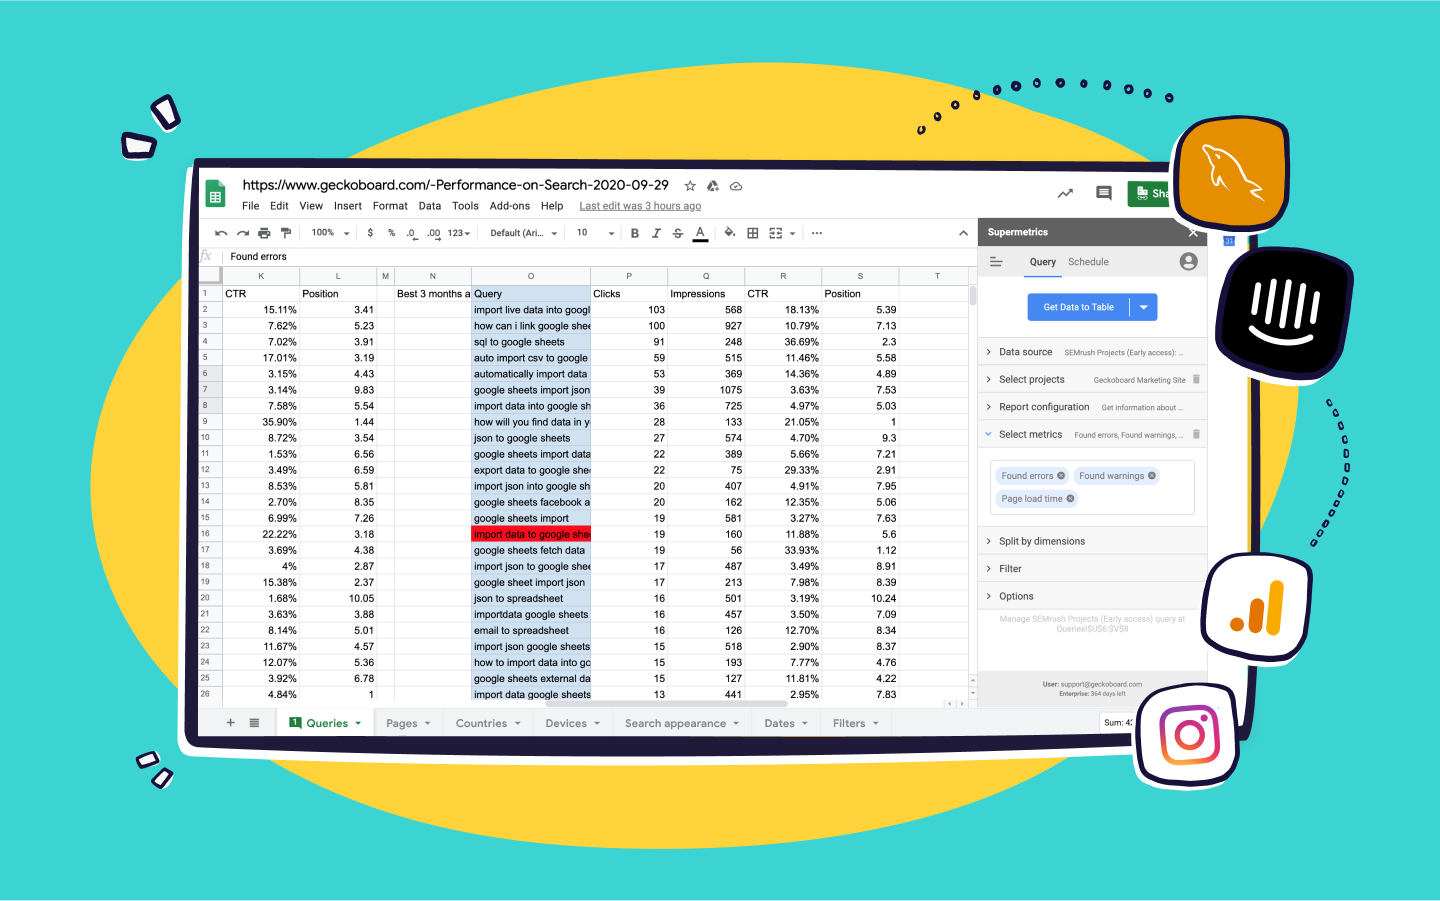
One of our favourites is Supermetrics - a flexible add-on for Google Sheets and Excel that lets you easily pull in data from many different tools, with a particular focus on marketing data.
For each data source you connect to Supermetrics, you can access a comprehensive range of metrics, data and information to bring in to your spreadsheet, and it’s even possible to schedule automatic importing of new data so your spreadsheet always contains up-to-date data.
Data sources that Supermetrics supports include: Adobe Analytics, AdRoll, Google BigQuery, Google Search Console, Moz, Optimizely, Pinterest, SEMrush, and more.
Here’s a quick overview of how to import data into Google Sheets using Supermetrics:
- Install the Supermetrics add-on in the G Suite Marketplace
- In a Google Sheet, select Add-ons from the main menu, then Supermetrics > Launch
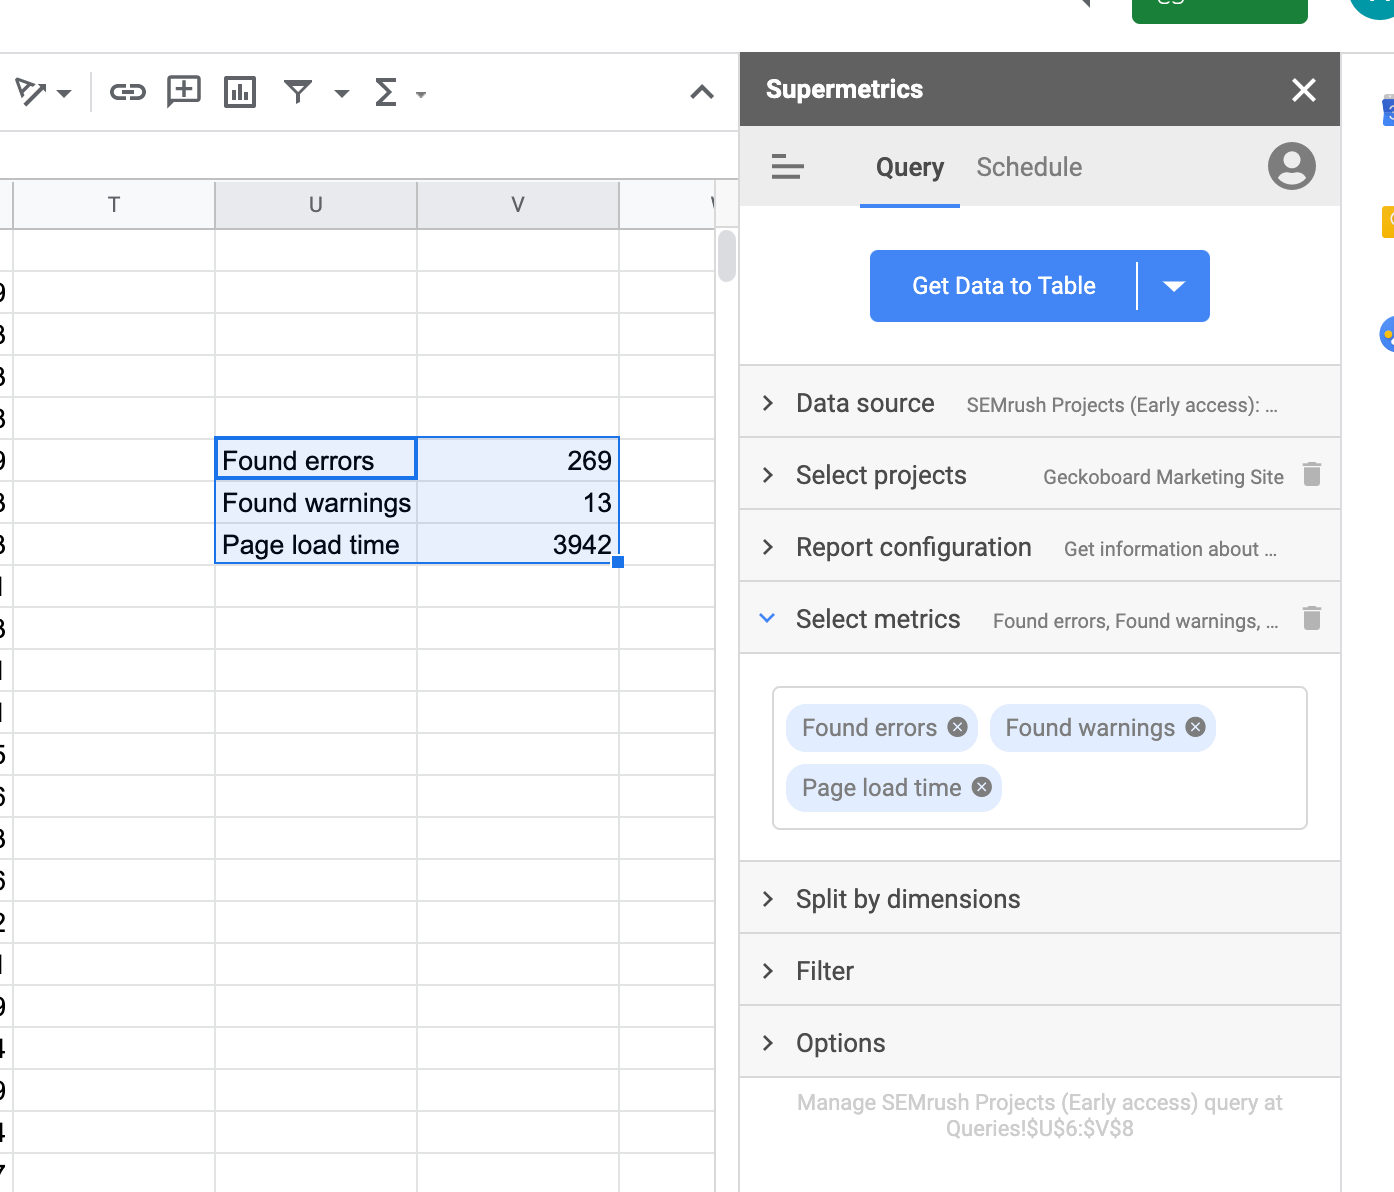
- Select a data source from the list of available sources and authorize it to share data with Supermetrics
- Build a query using the options available and then click Get Data to Table
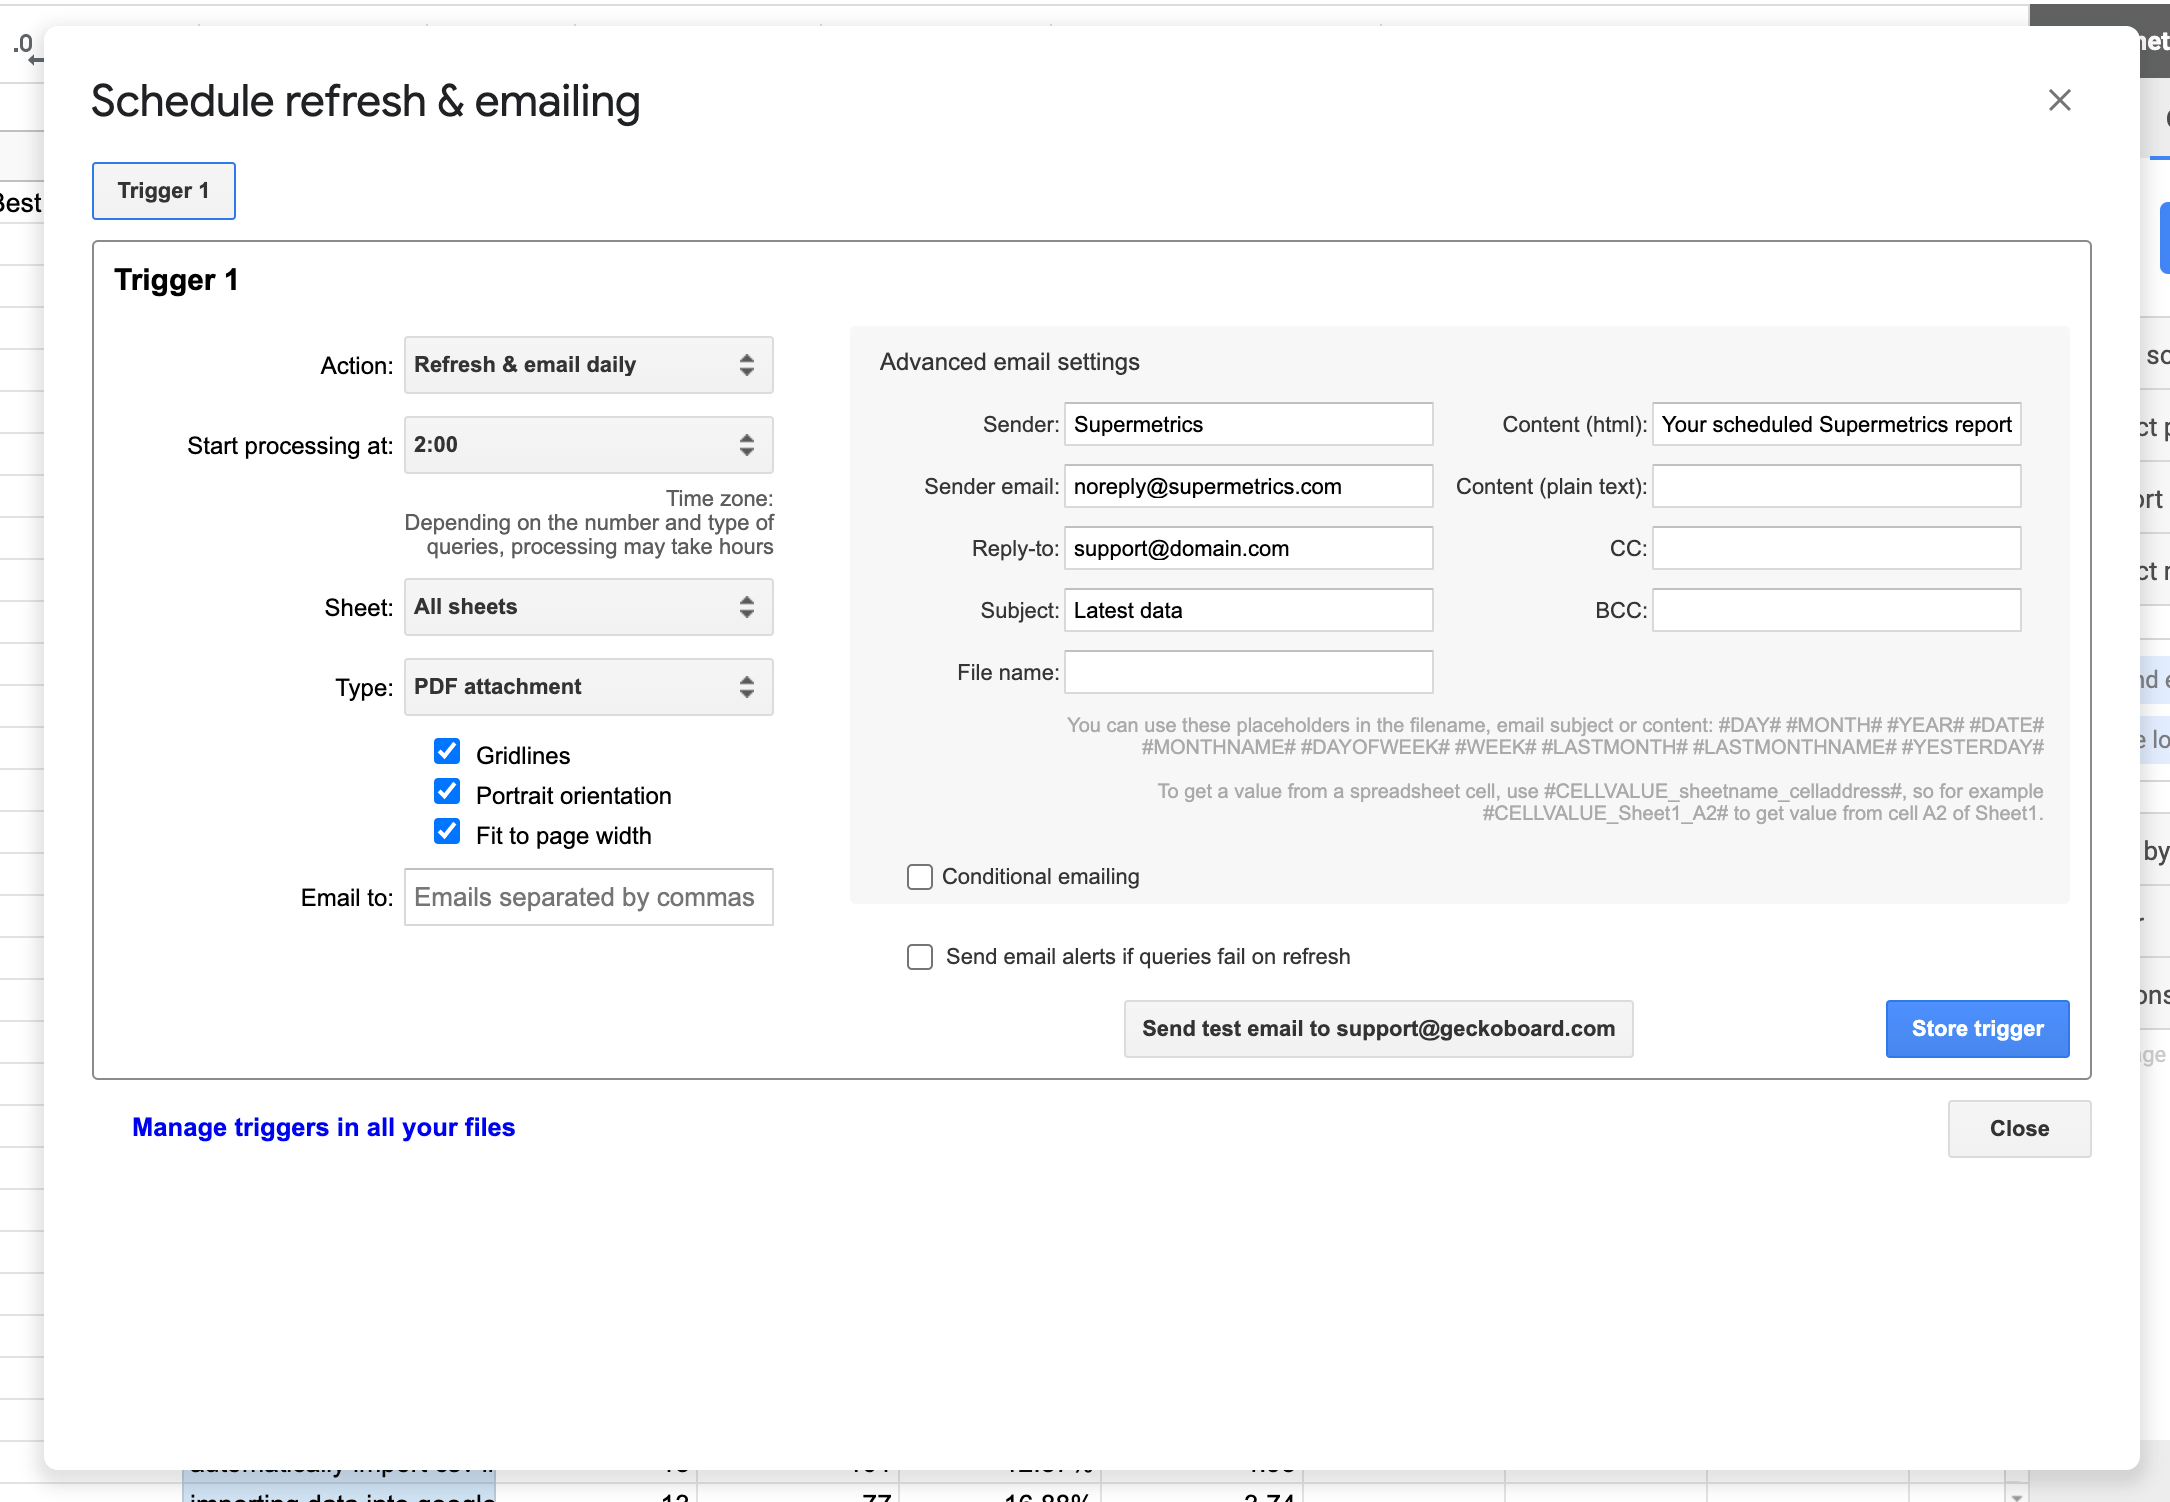
Once you’re happy with the query you’ve built, you can then schedule it to re-run weekly, daily or even hourly which will fetch new data and add it to your spreadsheet. You can also have Supermetrics send a snapshot of your updated spreadsheet to an email address.
There are a range of similar plugins and add-ons that have their own strengths. Some of the ones we like include:
- Make (formerly Integromat): allows for complex workflows, filtering and blending of data before data is sent to a Google Sheet or Excel spreadsheet. Data sources supported include JSON, CSV files, RSS and XML feeds, and hundreds of third party APIs.
- Zapier: A huge range of data sources (5000+) that can manipulate or add data to a spreadsheet automatically
- Google Analytics’ Google Sheets add-on: Import detailed information from Google Analytics into a Google Sheet
- Adobe's Report Builder (Excel): If you use Adobe Analytics, Report Builder is a plugin that enables you to extract your Analytics data from Adobe into Excel.

3. Import Functions (Google Sheets)
An entire library of functions in Google Sheets allows you to achieve powerful results using simple formulae.
Google Sheets offers five different import functions (listed below) that allow it to pull data into your spreadsheet from a variety of sources including XML, HTML, RSS and CSV - perfect for importing lists of blog posts, tweaks, product inventories or data from another service.
Here are the specific functions along with the type of data they collect:
IMPORTDATA(url)
Imports data at a given url in .csv (comma-separated value) or .tsv (tab-separated value) format.
See more detail about using Google Sheets’ IMPORTDATA function to display CSV data here: Using Google Sheets’ ImportData function
IMPORTHTML(url, query, index)
Imports data from a table or list within an HTML webpage.
See more detail about using Google Sheets' IMPORTHTML function here: Using Google Sheets’ ImportHTML function
IMPORTXML(url, xpath_query)
Imports data from any of various structured data types including XML, HTML, CSV, TSV, and RSS and ATOM XML feeds.
See more detail about using Google Sheets’ IMPORTXML function here: Using Google Sheets' ImportXML function
IMPORTFEED(url, query, headers, num_items)
Imports a RSS or ATOM feed.
IMPORTRANGE(spreadsheet_key, range_string)
Imports a range of cells from a specified spreadsheet.
Using these functions, you can easily scrape data from web pages, feeds and files. Also, a built-in finance function enables you to pull back market data.
Other useful Google Sheets functions
4. Scripting (Google Sheets)
Scripting (or in non-technical terms - writing a short bit of custom code) can be a powerful way to get data into Google Sheets. It’s basically an easier way to write large spreadsheet formulas and functions.
Google Apps Script is a cloud-based scripting language that provides easy ways to automate tasks across Google products and other services.
Google Apps scripts are extremely flexible, and can be automated using a variety of triggers, and although they need more technical knowledge to write and set up, an active community is on hand to offer guidance and help.
Example: Using Google Apps Scripts to get data into our Discourse Community
At Geckoboard, we use Discourse to power our Community we use Google Apps Scripts to fetch data from Discourse and add it to a spreadsheet, which we then visualize on a live dashboard to see how key metrics are performing.
Here are the steps we took to pull data from our Community to Google Sheets, to a dashboard:
- Created a new Google Sheets Spreadsheet
- Created a new script for our Spreadsheet (Tools > Script editor) and copy and pasted chrislkeller’s ImportJSON functions (to be able to import the output of Discourse’s API which is JSON).
- Looked in Discourse’s API documentation for a call that returned the latest topics created in the Community
- Added a new function in our script to call the endpoint identified on step 3 and update cell A1 with the response
- Finally, added a trigger to run the function myFunction every hour.
- Used Google Sheets standard functions to identify the rows containing topics created Today and count them.
- Used Geckoboard’s spreadsheets integration to get the data onto a dashboard (more about this in the section below).
Google offers a variety of resources to help you make the most of Google Sheets using Google Apps Scripts. You might find some of their examples useful to get your data into Google Sheets.
Beyond spreadsheets: visualizing and sharing your data
Want to take your spreadsheet game even further? Now that you’ve imported data from various sources into your Google Sheets and Excel spreadsheets, you can easily visualize and share this information using a dashboard.
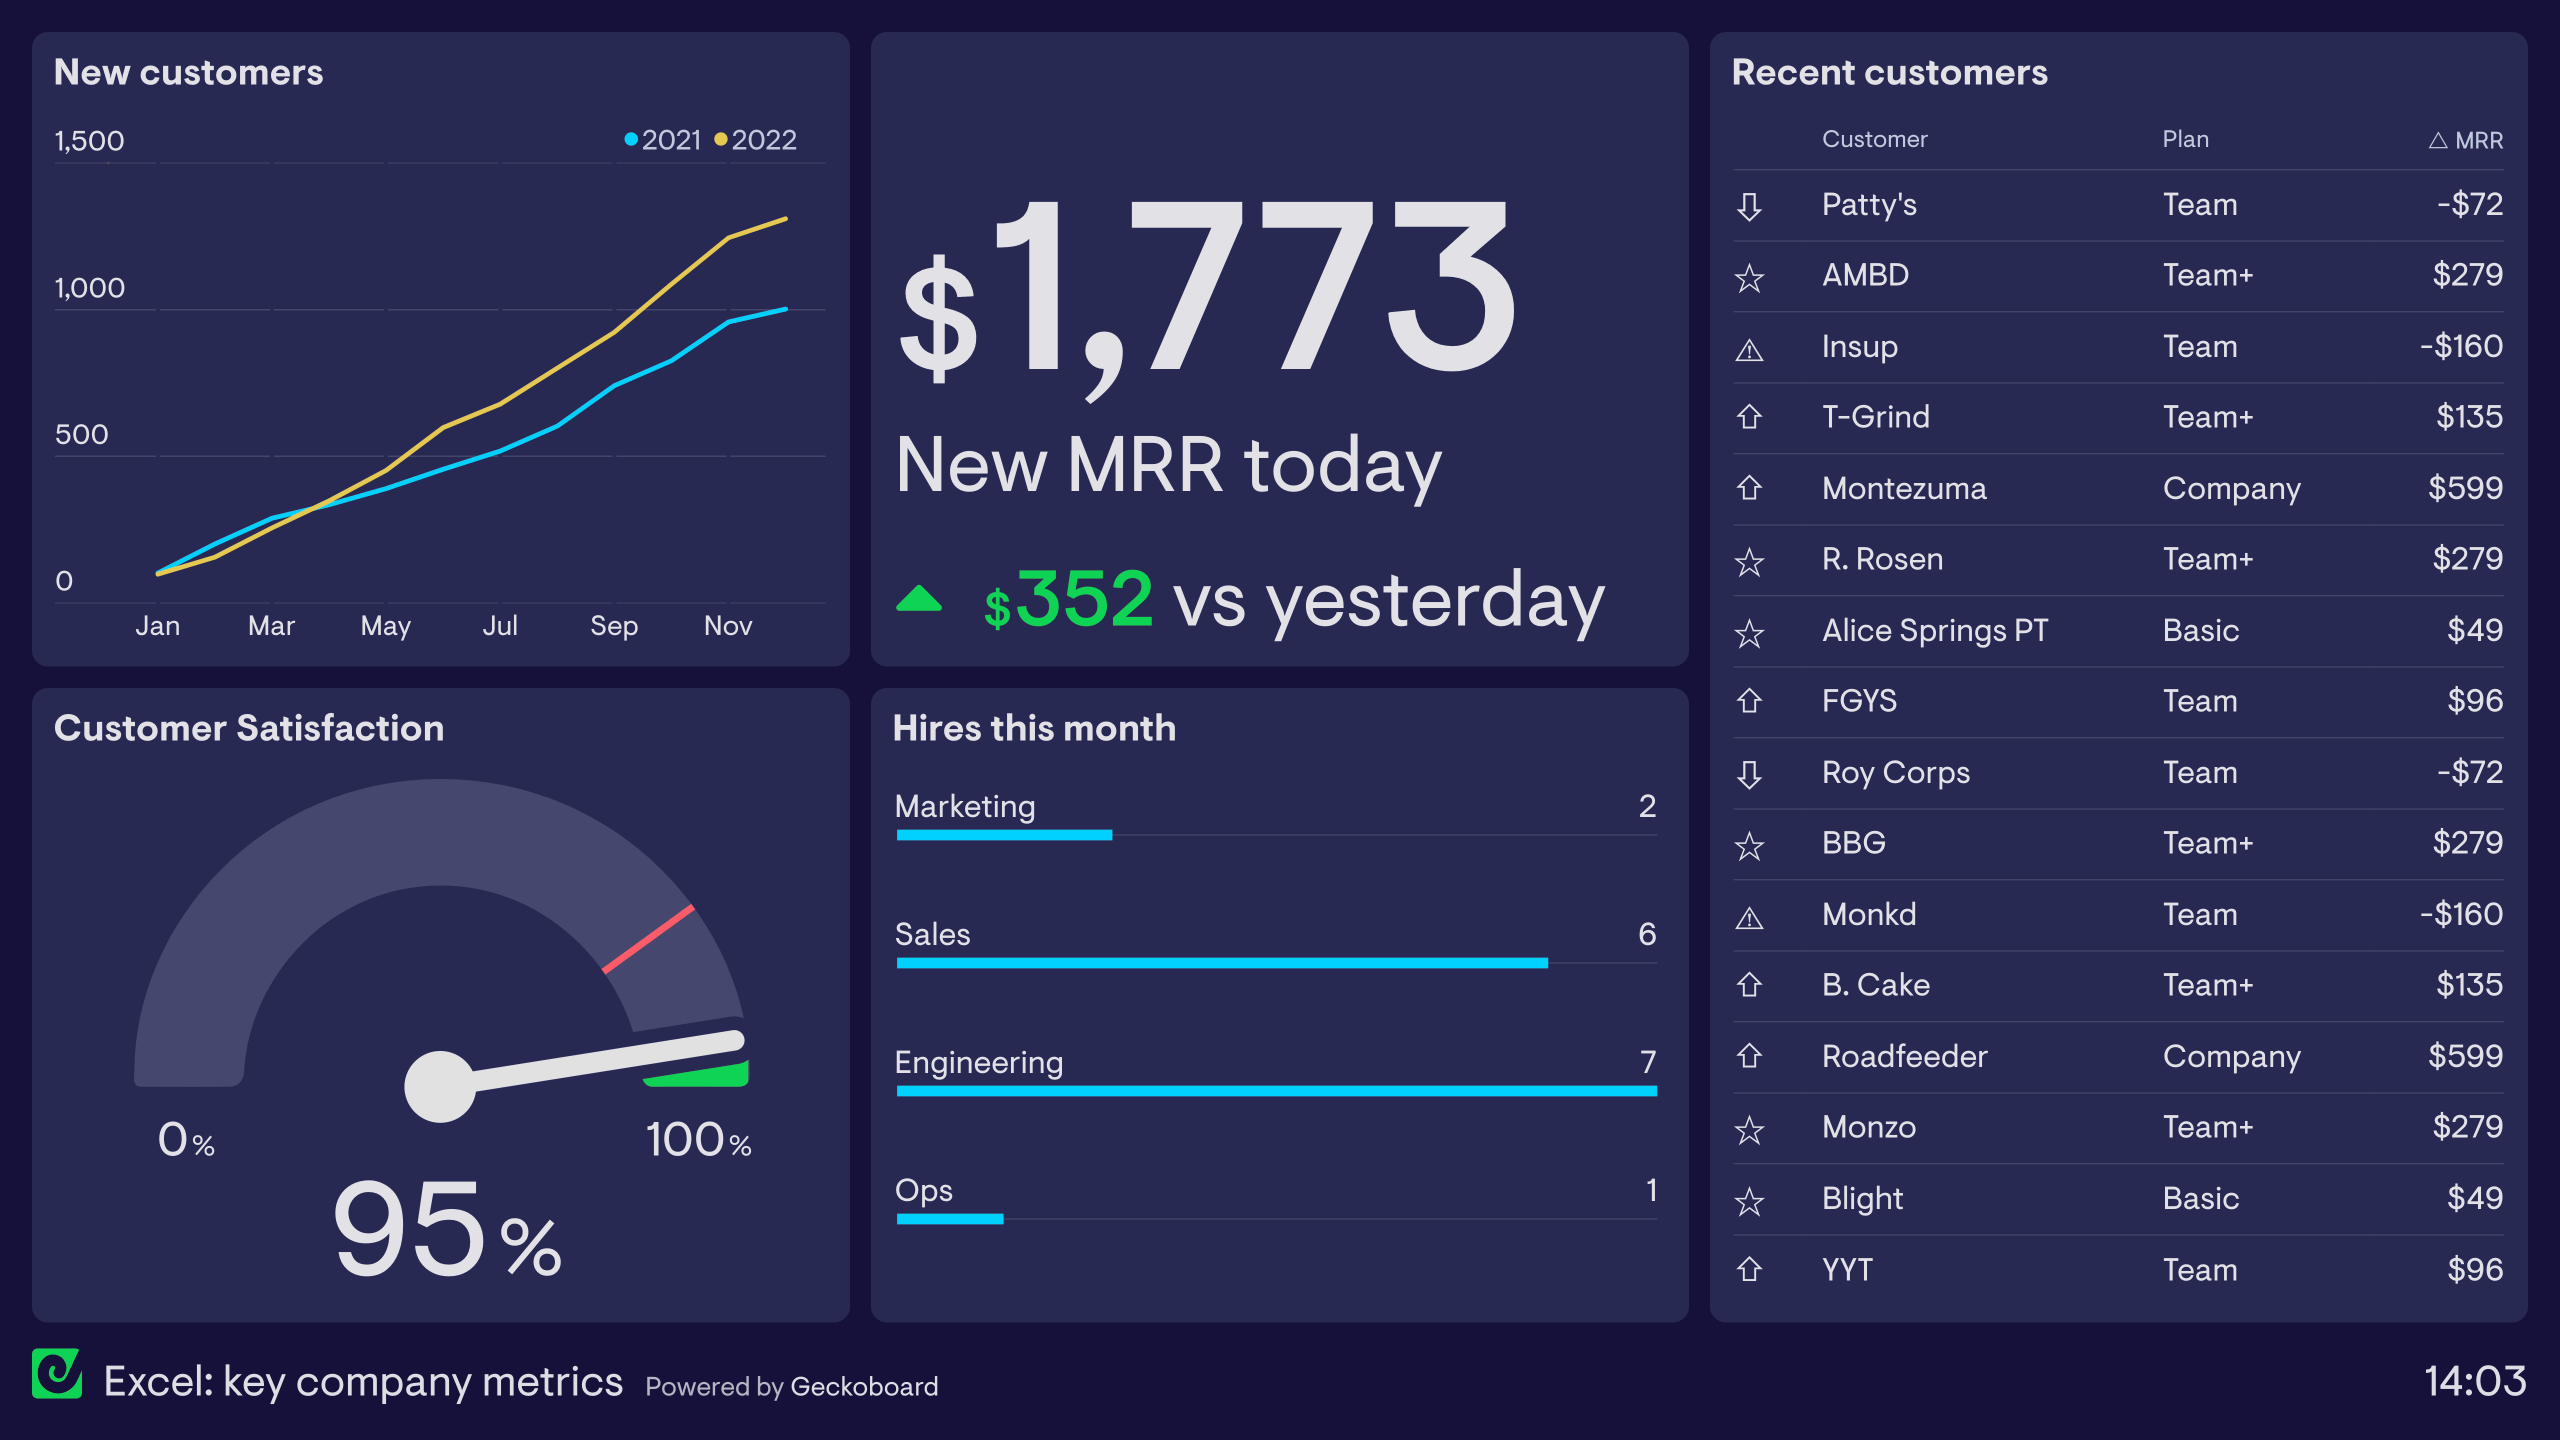
Learn more about this Excel dashboard example here.
The example above contains a variety of visualizations, which can be powered either by Google Sheets or an Excel spreadsheet, which updates automatically to show up-to-the-minute data.
Here's how it works
- Create your spreadsheet in Google Sheets or Excel (importing data from via the steps mentioned earlier in this post)
- Sign up for a free Geckoboard account
- Select ‘Add dashboard’, then ‘Add widget’
- Pick the ‘Spreadsheet’ integration from the list of data sources.
- Select your data and choose a visualization
- Build out your dashboard by adding more visualizations
Watch this in action in the video below!
Let us know on Twitter if you've found any other useful or interesting ways to get data into a spreadsheet.
Originally published on 23rd February 2016, updated on 6th October 2022
More articles to help you up your spreadsheet game
- 5 experts to follow to learn Google Sheets tips and tricks
- 6 advanced Google Sheets functions you might not know (but probably should
- 3 (more) advanced Google Sheets functions that wioll make your life easier
- Using spreadsheets for communicating data? Here are 4 reasons why you shouldn't
- Top 16 Google Sheets add-ons to optimize your workflow
- How to import JSON data into a Google Sheet
