
A Censuswide study found that only 24% of decision-makers at surveyed organizations were confident in their data literacy.
That means over 3/4 of respondents might be making business decisions based on potentially inaccurate data interpretation.
Data literacy is the ability to accurately read, analyze, and apply data. It’s a crucial skill for team members of all levels. Otherwise, the customer and product information you collect every day may not be informing your business strategy the way you think.
But don’t worry—you don’t need to hire a bunch of math wizards to have a data-literate organization. Information analysis is a skill you can teach. We’ll show you how to foster data literacy in your organization so your company can truly be information-driven.
Include data literacy in employee training
Add resources on reading, analyzing, and interpreting data into your regular employee training processes.
Start by teaching your team the importance of data literacy. Companies collect significant amounts of information to show them how customers are behaving and help guide product decisions. Yet 45% of Censuswide’s survey respondents say they frequently make business decisions based on gut feelings. Show your employees the benefits of being data-driven instead.
Train your team to interpret customer and product data accurately. If they know how to read the information they collect, they’re less likely to be misled by inaccurate data.
The exact training will depend on the team member’s role. Marketing or customer service teams may need to start at a more fundamental level than software or engineering teams. For new or lower-level employees, you might also use base-level data literacy training. New employees and non-IT teams may be less familiar with types of analytics and how to interpret data sets.
One useful training resource is the Data Literacy Project. It offers modules covering the fundamentals of data.
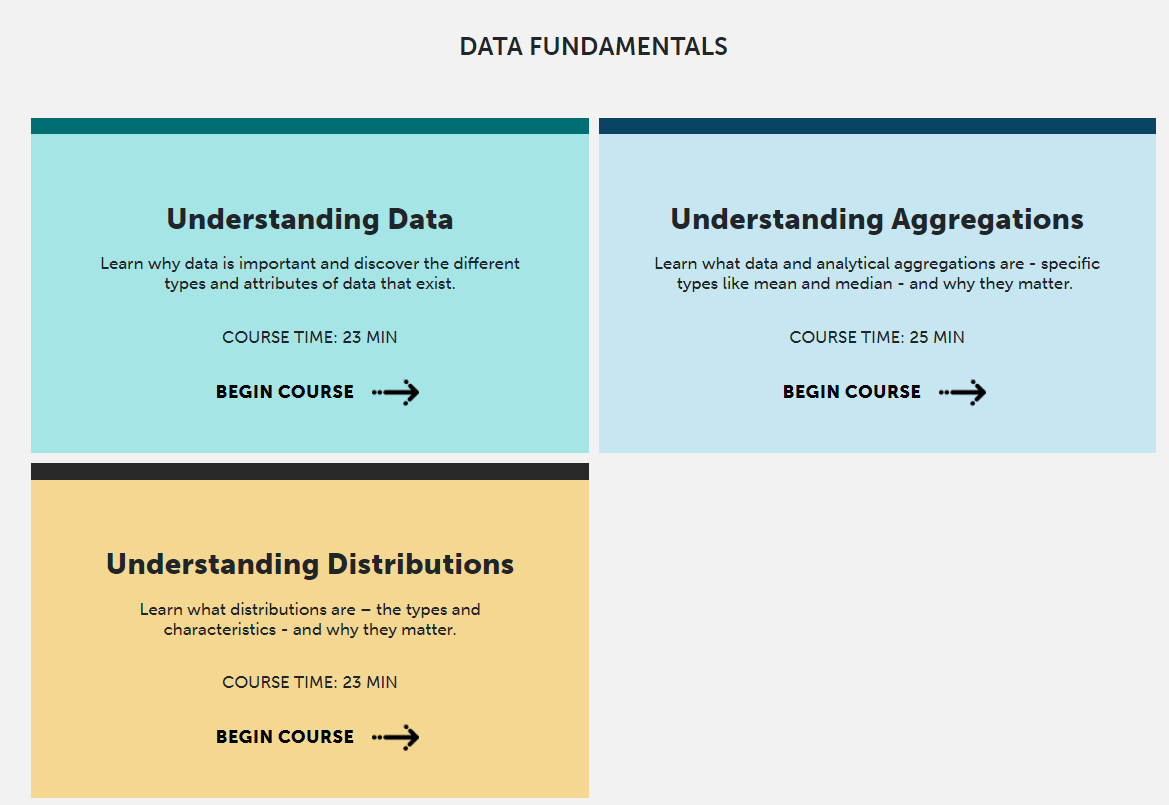
You can also create company-specific courses using a learning management system (LMS) like Eduflow.
An LMS lets you create custom training for different types of teams. For example, you can add Salesforce training materials to help your sales team interpret the information they collect in Salesforce.
Bonus tip: Offer on-demand professional development materials
Provide employees with resources to learn more about data outside of their formal training. These might include books, a knowledge base with articles, or self-guided courses. Chartio data school offers a selection of books covering different types of data and how to use them.
Encourage your team to seek out resources on their own by offering a small learning stipend. You could guide their choices by promoting weekly or monthly “recommended reading.”
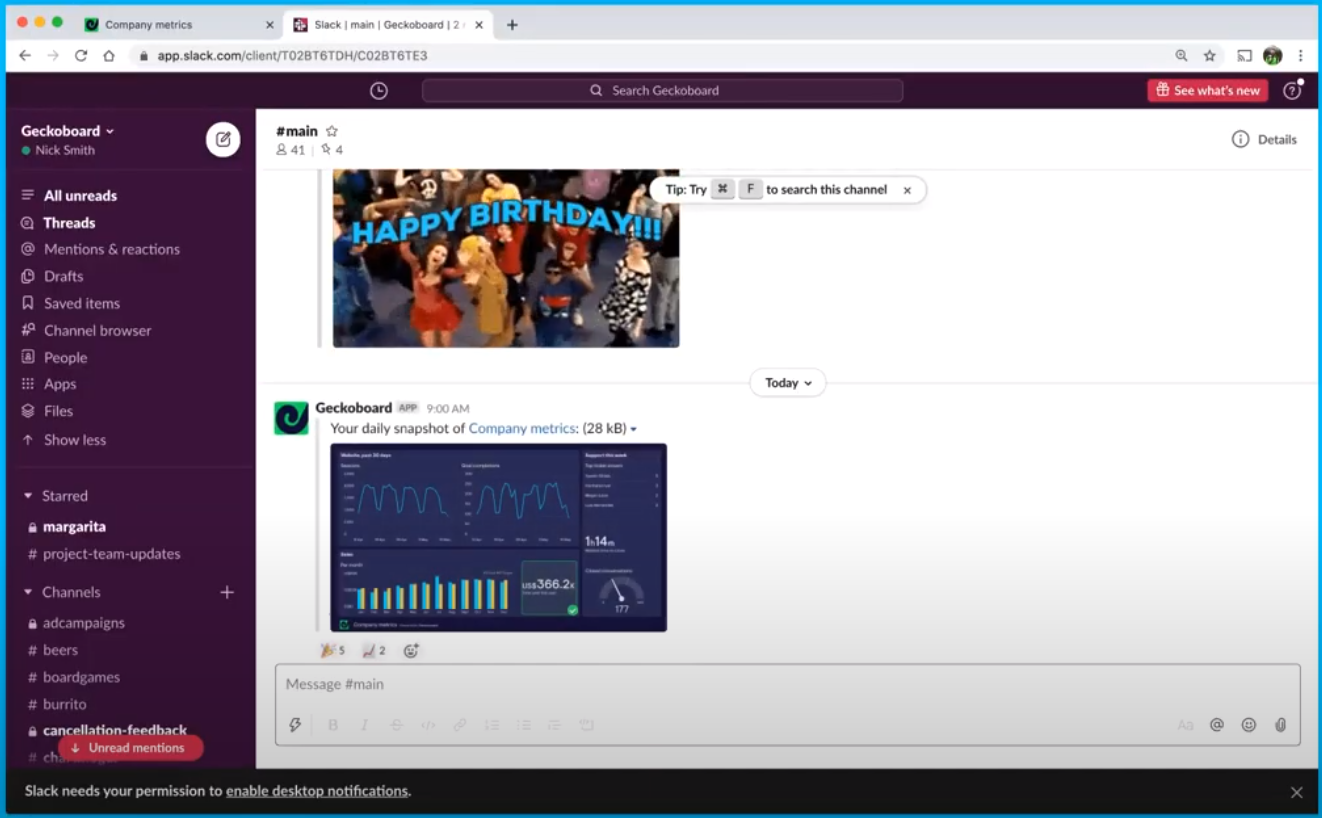
Since different teams have different data needs, consider having managers suggest the reading for their group. Then, host a team-wide discussion or chat, either in-person or online, in a forum like Slack. That gives employees an outlet to ask questions and talk about what they’ve learned.
Decentralize data access
If employees can’t access the information they need, it’s harder for them to learn to use it effectively. Adopt a decentralized approach by enabling employees to access data relevant to their role.
If employees have to submit data requests to a central person, it slows down the decision-making process. Teams in a time crunch may make decisions based on assumptions or “intuition” rather than factual information.
Wider access empowers employees to make informed choices, starting in the initial planning stages of their project. Teams can analyze data before creating a project proposal rather than justifying decisions after the fact.
Amplitude, a product intelligence platform, expanded data access for engineers as part of an effort to democratize its data. Previously, engineers were brought in toward the end of the product-planning discussion. With expanded access, they can see the statistics used in strategy and goal-setting before the company makes product decisions. This helps engineers see the full impact of their work. They’re more engaged in projects and can use the data to argue for features they want to invest in.
Decentralization doesn’t mean granting open access to all data for all employees. Sometimes you have to set restrictions for the sake of privacy. But teams should have easy access to the data they need to do their job. Removing barriers to essential information will encourage employees to use it in day-to-day decisions. The more they practice applying data, the more data literate they’ll become.
Bonus tip: Consolidate your data sources
Decentralized data access is only useful if people know how to get to the data they need. Solve this problem by adopting an aggregation software—a tool that gives you a single, organized point of access for data from multiple sources.
Chemical and consumer goods company Henkel adopted Tableau to consolidate its data. Henkel uses a variety of information collection tools, including Oracle, Dremio, and Excel Cubes. Tableau acts as a single point of access for all of that data.
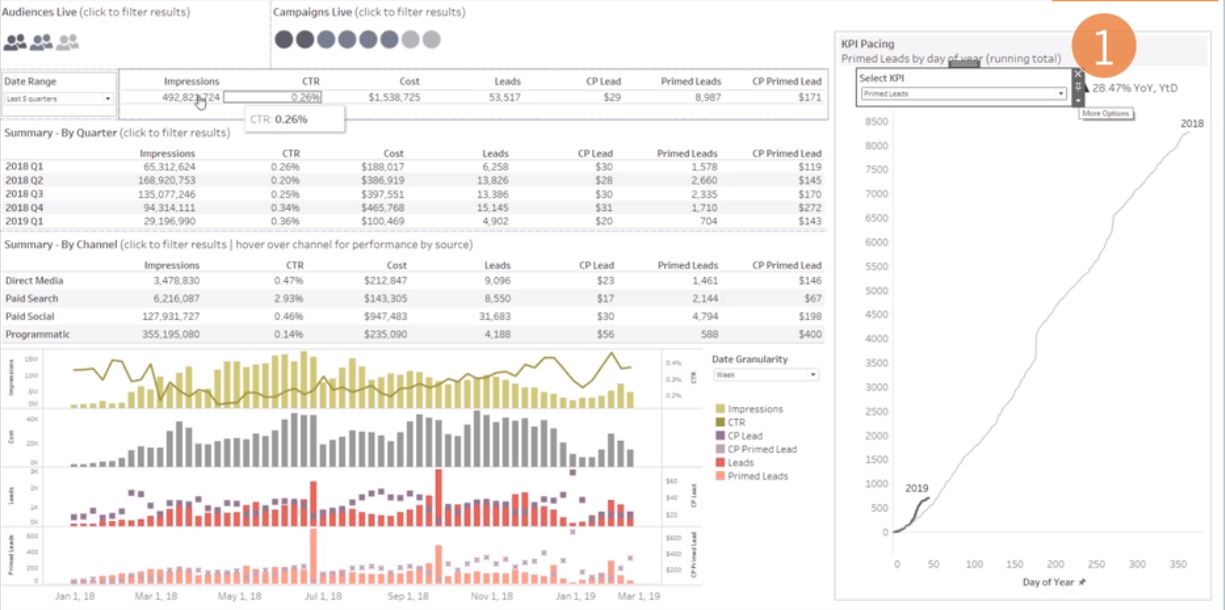
As a result of adopting the software, Henkel could more easily track supply chain efficiency and identify cost-saving opportunities. It saved €4 million ($4.7 million) in 2019 alone.
The type of aggregation software you adopt will depend on the scale of your data needs. While Tableau is useful for large-scale organizations like Henkel, small or medium-sized businesses might consider a less complicated option, such as Geckoboard.
Assign a KPI to each employee
One barrier to data literacy is when an employee is overwhelmed by excess amounts of data. Assign each team member a single key performance indicator (KPI) or set of KPIs. This will help keep the data load for each person at a manageable level.
Split up KPIs so that members of a team cover the full set of relevant metrics between them. On your marketing team, one person might track ad metrics like click-through-rate while another tracks customer feedback metrics like brand recall.
Employees can present the latest results from their KPIs at team meetings. That way, every person gets updates on team progress without having to track every KPI themselves.
This is the approach that Codator, a legal services company, took with its KPI distribution. At any given time, the company is collecting Google Analytics data from five or more websites. It also gathers feedback at least three times from each client. The company needed a way to analyze all this data without overwhelming employees.
Codator solved its problem by giving each team member one or two KPIs. For example, one person tracks paid leads for marketing while another tracks unpaid.
This approach cuts through the white noise of excess data so team members can focus. Employees feel more empowered because they know their metric inside and out, including how it connects to overall company goals. If they think the metric is no longer actionable or is too static, they can suggest more relevant KPIs to focus on.
Bonus tip: Ask managers to monitor company-wide metrics
While employees watch individual KPIs, assign team leads to manage the numbers as a whole. It can be easy to focus on pieces of data and lose sight of the bigger picture. If managers track company-wide metrics, they can show teams how individual KPIs contribute to broader company performance.
On your marketing team,for example, you might assign employees to track numbers of leads and advertising spend. Then the team lead could track marketing ROI. During meetings, team members could compare their KPIs to the big-picture metric to see the broader impact of each piece of data.
Adopt a data dashboard tool
Data visualization is invaluable for building data literacy. It makes information easier to digest and interpret at a glance.
Dashboards are particularly helpful for showing employeesthe data they need for day-to-day operations without searching through analysis software.
Use a dashboard tool to continually display your team’s top metrics. Add goal comparison features for context and to keep team members motivated.
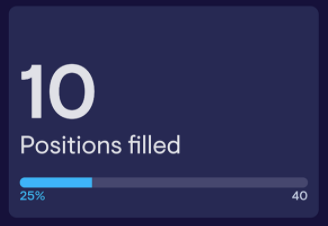
With a progress bar, “10 positions filled” is no longer a stand-alone data point. Viewers can also see the significance of the number: They’re 25% of the way to their goal.
Integrate your dashboard with your data collection tools to display metrics in real time. That way, your teams can track KPIs as they change without having to sort through data analysis tools multiple times a day. Real-time displays are especially useful for KPIs that change regularly, such as current ticket volume.
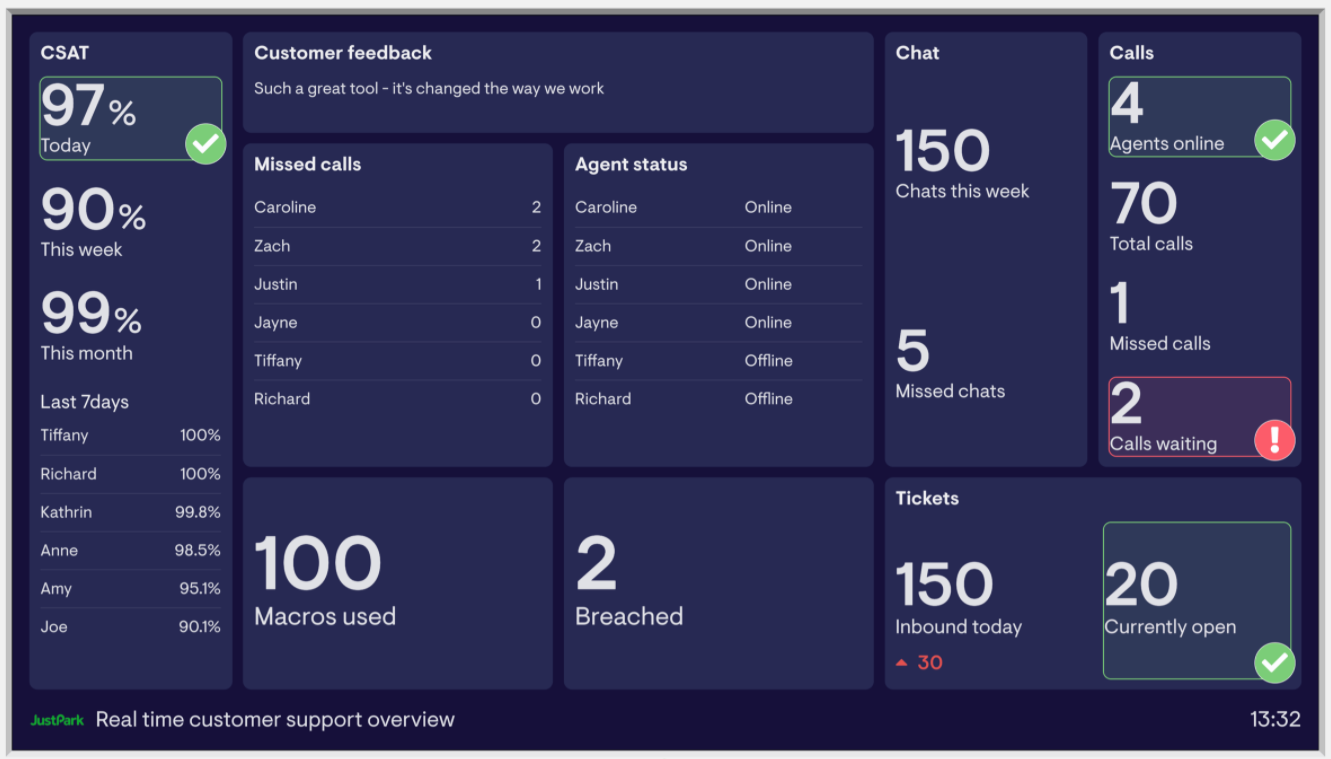
Dashboards place essential information in your team’s line of sight. This enables faster decision-making and helps employees see how their most important data changes from day to day.
Bonus tip: Display separate dashboards for each team
Use multiple dashboards so each team can display their key metrics. Not every team has the same KPIs, and separate dashboards will be less confusing than grouping unrelated metrics together.
Display team dashboards where your employees spend the most time. In an office, this might be on a TV or computer monitor above the team’s group of desks. If you have a remote team, share the dashboard to their team Slack channel.
Codator has a dashboard for each of its teams. Each group displays their dashboard above the desks in their section of the office.
“For the teams, we needed [to display] just one or two numbers that reflect what they’re doing and correlate with our targets,” said Emiel van Lenthe, chief of marketing at Codator. “Otherwise, it gets too complex.”
With a data dashboard tool, the company can surface the most important team metrics for everyday tasks.
Build data literacy by empowering employees
Part of building data literacy is encouraging your team to apply their knowledge once they’re ready. As employees become more comfortable with data analysis, give them more responsibility. Have them include data in initial project proposals without telling them exactly what to look for.
This will help build their confidence in their data analysis abilities. It’ll also save time. If employees are responsible for their data, managers don’t have to act as gatekeepers and can focus their energy on other tasks.
