Working in Customer Support can sometimes be a little hectic. Especially during busy periods like Black Friday or the holiday season.
It’s not surprising that many CX professionals are constantly looking for ways to save time during their day.
One of the simplest ways to save time is by creating tailored views of your most important metrics in the form of custom reports and dashboards. This makes sure customer service metrics and KPIs are easily accessible, without you needing to dig around in different reports, platforms and spreadsheets.
In this guide, we’ll show you how to use Geckoboard to build custom Zendesk reports, which are completely tailored to the metrics you need to see. (It’s also possible to use this method to build custom dashboards for other platforms, such as Intercom, Freshdesk or Aircall.)
Why Geckoboard?
Thousands of Customer Service pros use Geckoboard because it’s the easiest way to create custom views of your CX data. It’s intuitive to use, and unlike other report builders such Zendesk Explore or BI tools, it doesn’t require any prior training.
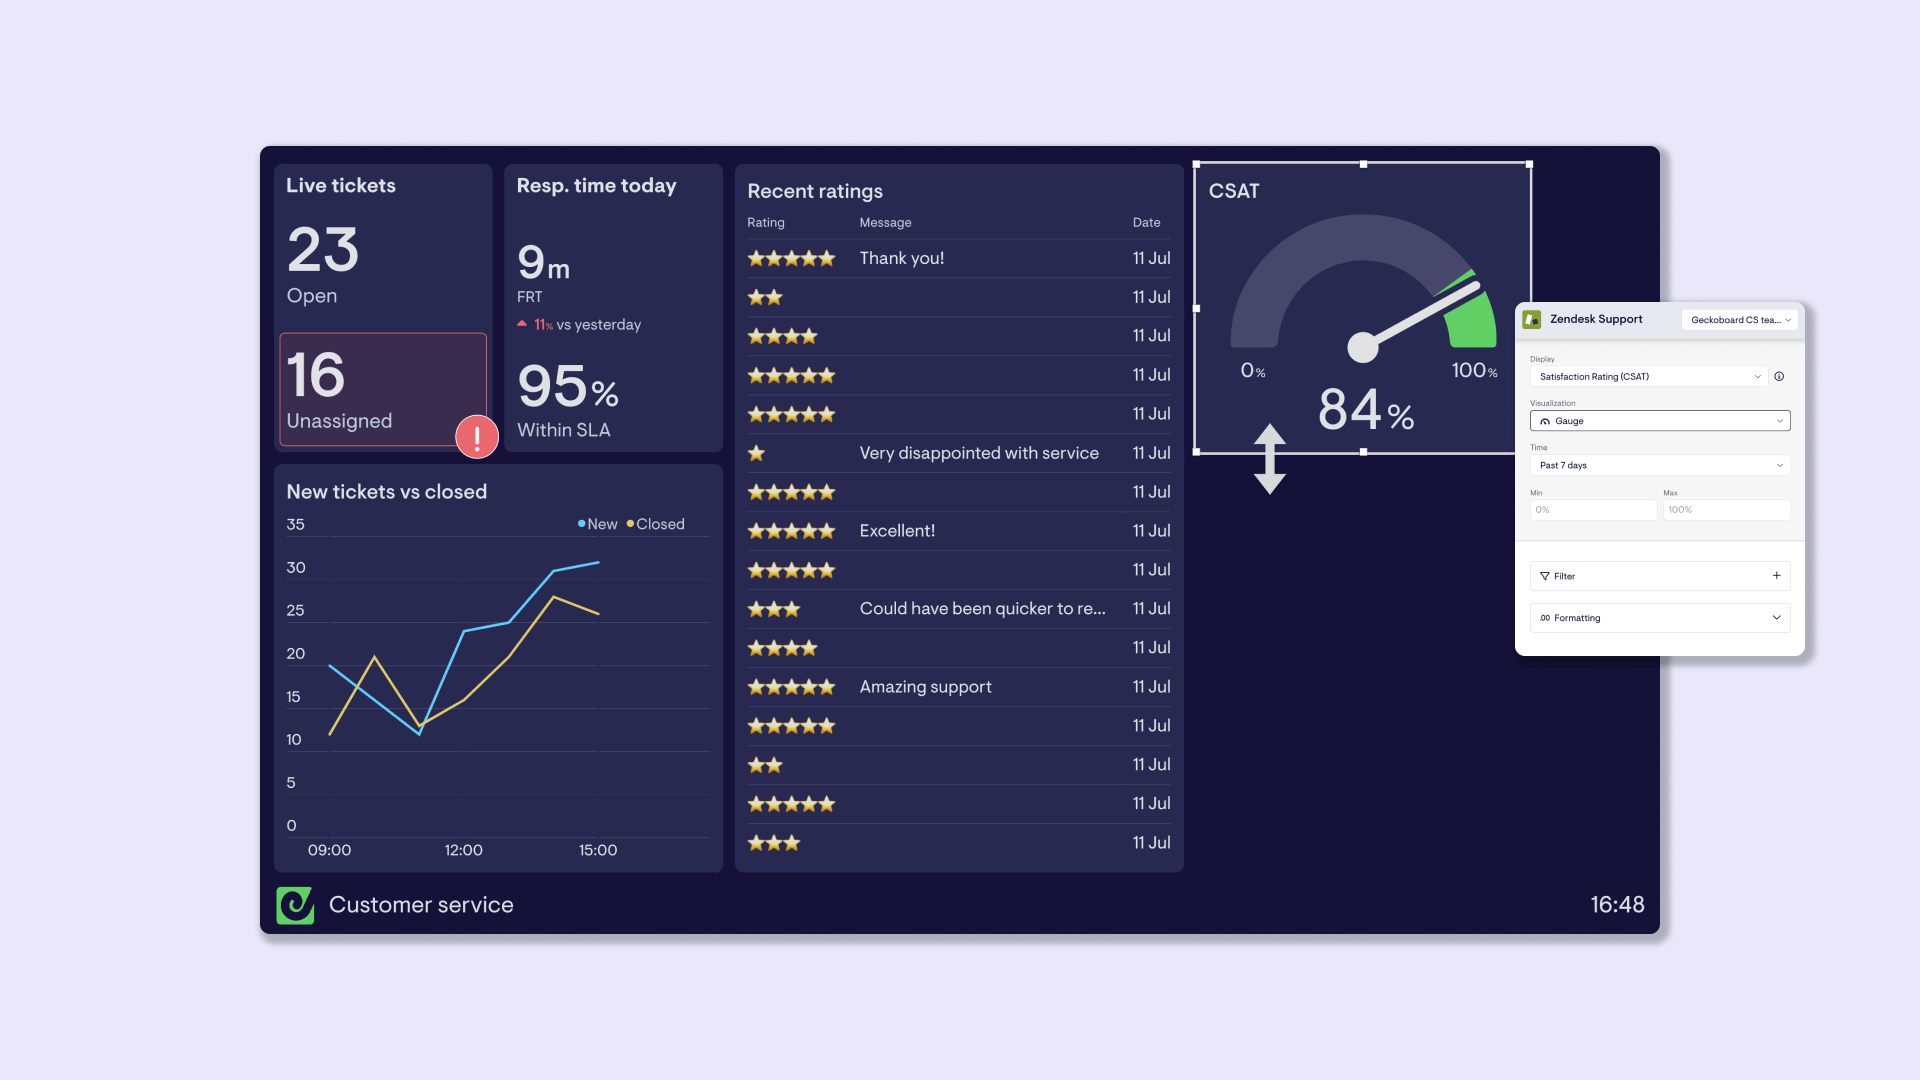
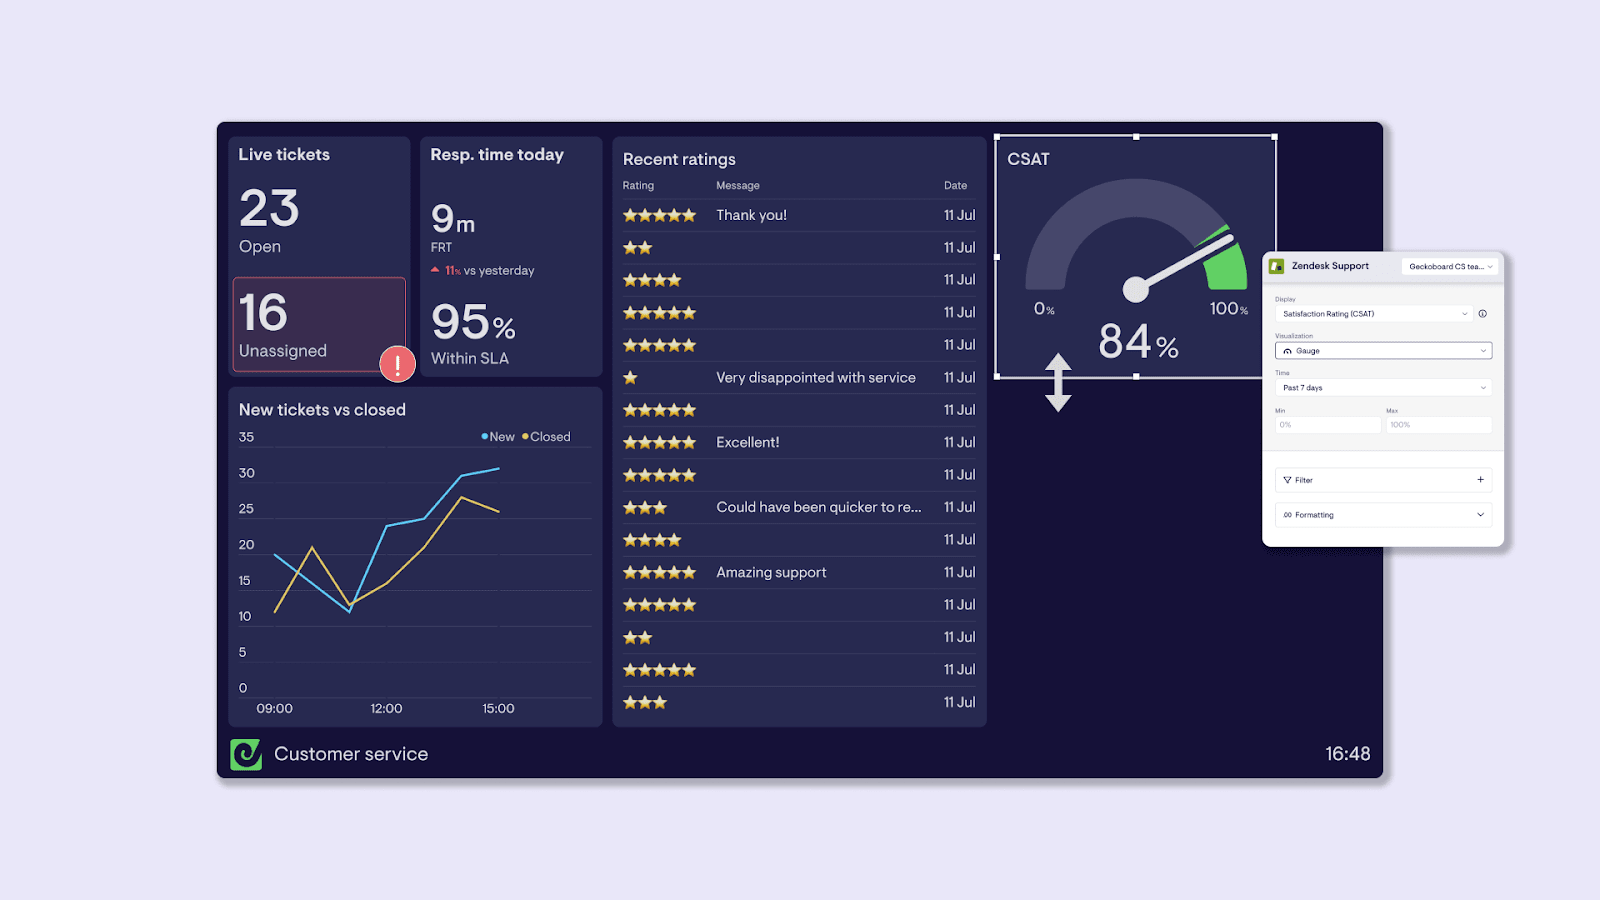
Geckoboard’s drag and drop interface makes it possible for anyone to design dashboards that are easy to understand:
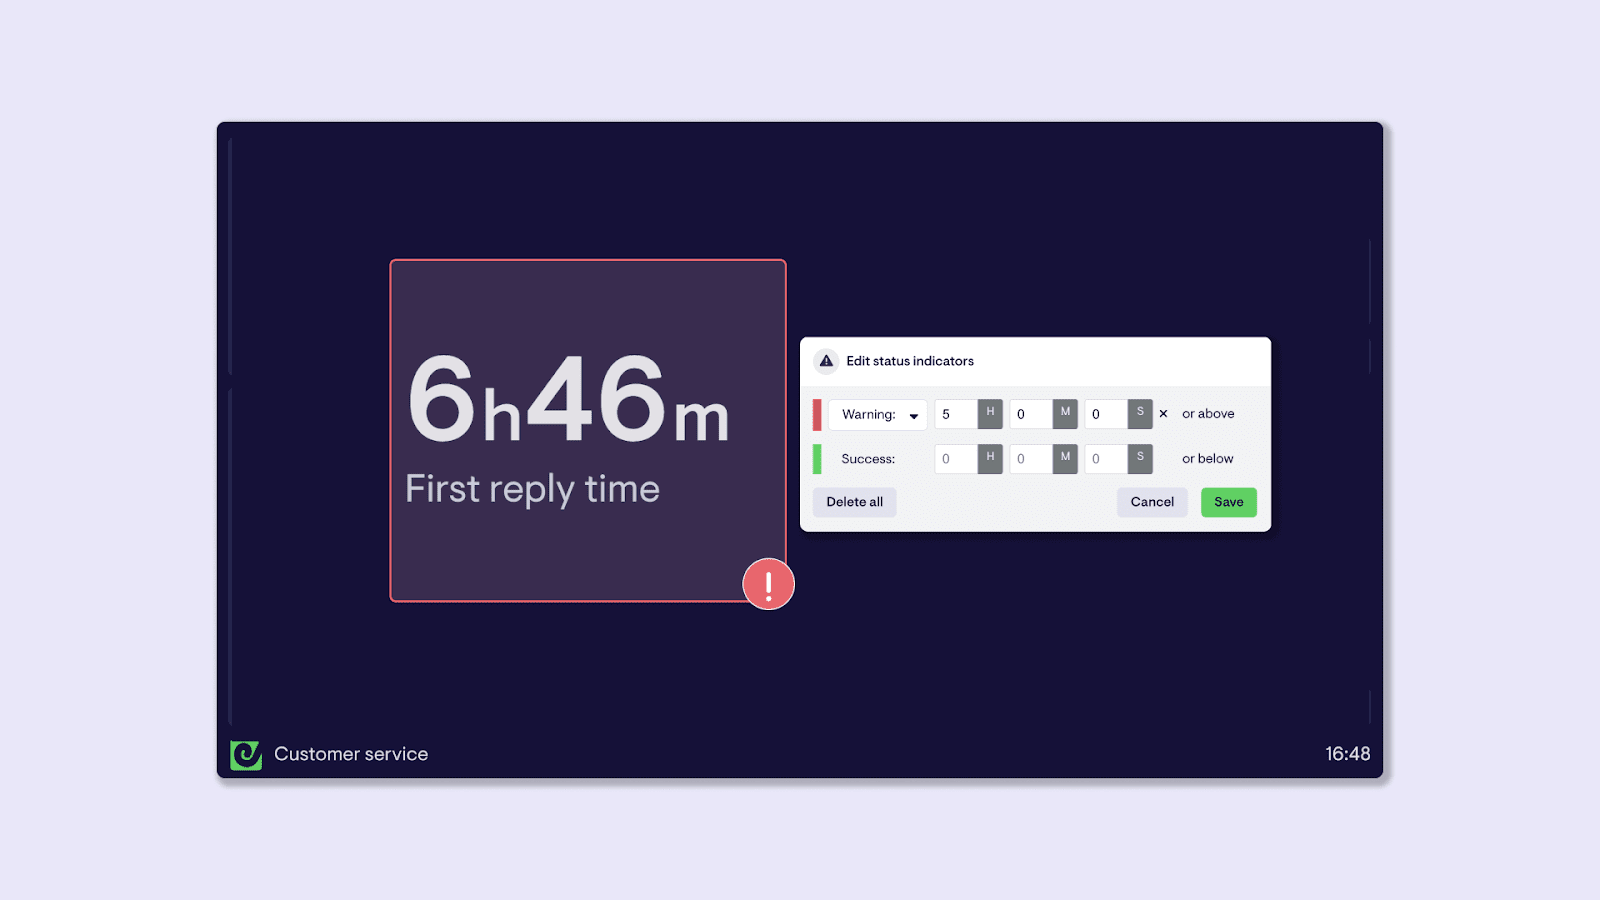
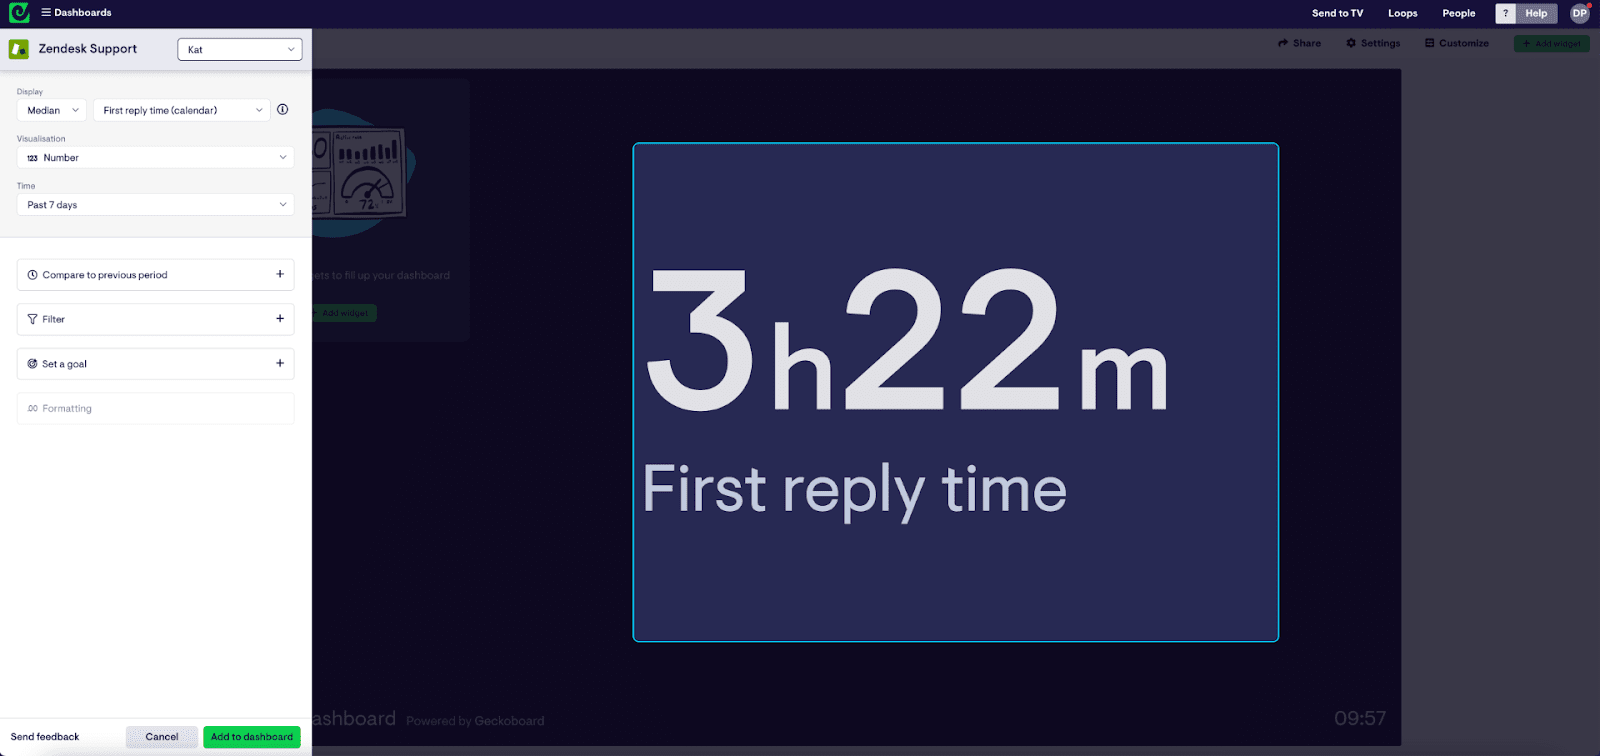
You can set goals and status indicators to flag important changes in your data:
It’s possible to build dashboards visualizing data from multiple sources, including Zendesk (Support, Talk, Sell, & Chat), as well as other data sources like Klaus, Aircall, Google Analytics, Airtable and Spreadsheets:

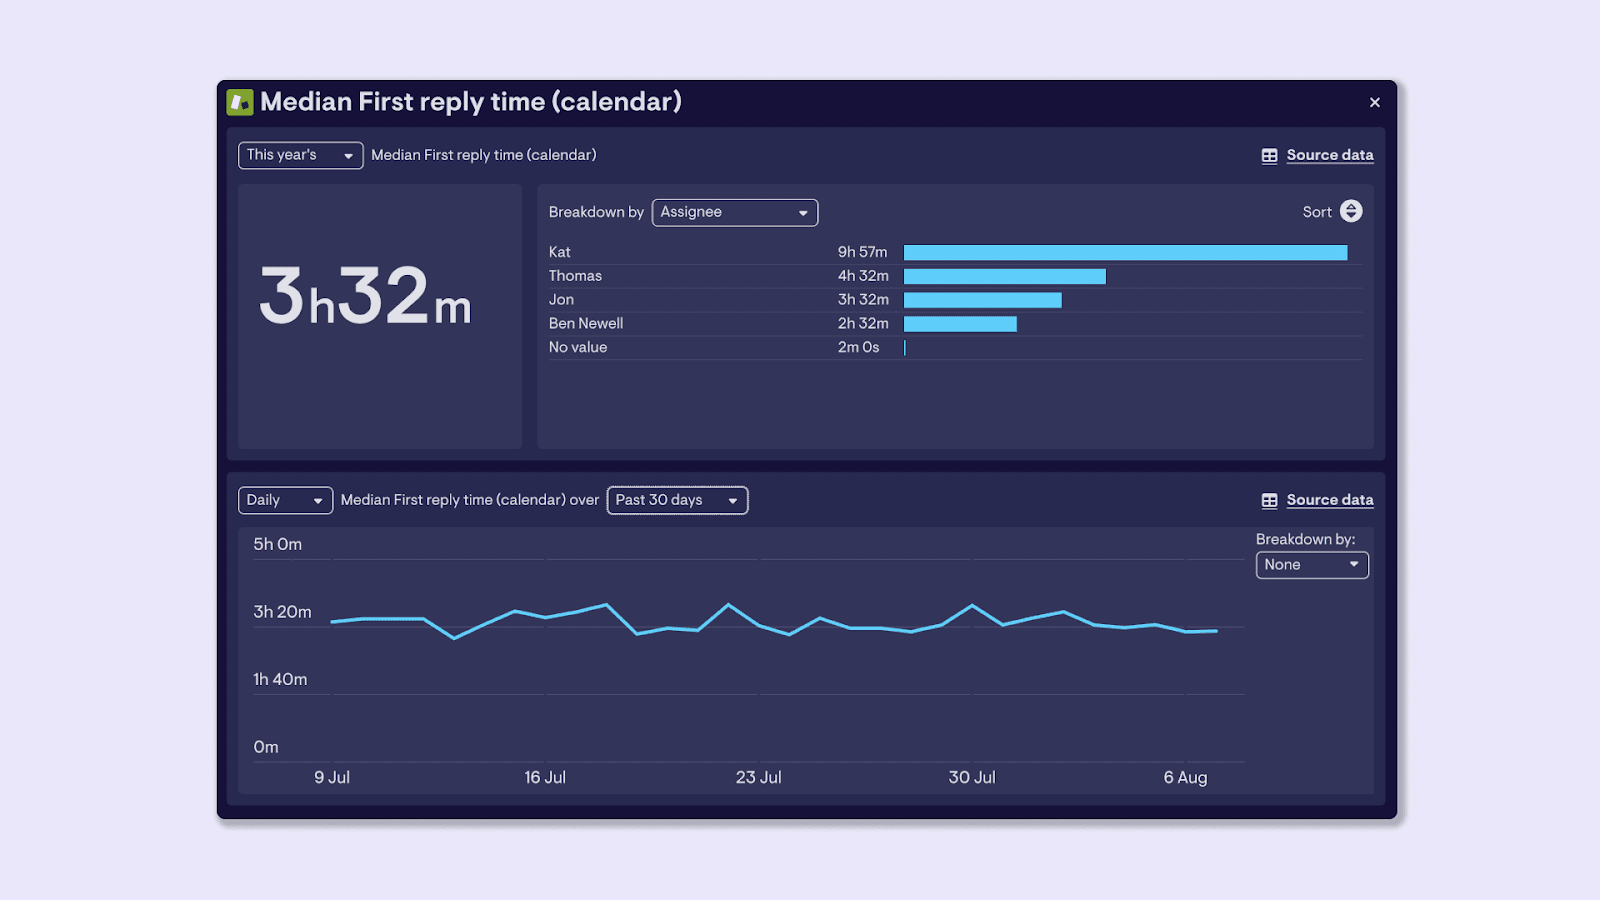
And if you spot anything that needs further attention, you can investigate data at a more granular level by using Gecokboard’s interactive view:
Your dashboards can also be displayed on multiple devices, such as mobile, or via a TV screen in the office:

How to build a custom dashboard for Zendesk?
Next, we’ll explain – step-by-step – how to create your own customizable Zendesk dashboard.
Step 1: Sign up
Sign up to try Geckoboard for free for 14 days. This will give you full access to the dashboard builder and all 80+ data sources. There’s no credit card required, so if you don’t want to continue with the tool, you won’t be left with any surprise charges.
You can check out some of the reviews for Geckoboard on Zendesk marketplace.
Step 2: Connect your data
To connect your data, just select any of the Zendesk options such as Zendesk Support, Zendesk Talk, Zendesk Chat or Zendesk Sell. Then follow the steps to connect your live data.
One of the best parts about Geckoboard, is that it auto refreshes your Zendesk data at least every 10 minutes. That’s 6x quicker than Zendesk Explore which only refreshes your data hourly or daily (depending on your plan).
Step 3: Build a widget.
After you’ve connected your data, you can start building widgets. (A widget is just a name for a data visualization: such as a bar chart, a leaderboard, a gauge or a number.)
It’s possible to filter widgets so you see metrics related to different time frames, or specific fields, like agent, channel or brand.
You can add valuable context to your widgets by adding goals and status indicators. This helps users of the dashboard understand whether a metric is good or bad, or if they need to take further action.

Step 4: Build up your dashboard by adding more widgets
Continue adding widgets to build up your dashboard. You can include metrics from different data sources, meaning you can design a dashboard that is completely tailored to the KPIs you want to monitor - at a glance.

For more ideas of what to include in your dashboard, why not take a look at some Zendesk dashboard examples, used by other businesses.
Or why not try Geckoboard for free today.
