
Shopify users are an entrepreneurial bunch – so it’s not surprising many of them manage more than one Shopify store. Whether you own multiple businesses, have multiple store locations, or just manage multiple brands under the same umbrella, it’s common to set up these ecommerce sites as seperate stores on Shopify.
The problem is, with Shopify’s native reporting platform, Shopify Analytics, it can be a real pain in the jacksie to create an overview dashboard that shows how all of your stores are performing at the same time.
Instead, owners are left logging in and out of multiple accounts to keep track of things, maybe even trying to aggregate all your metrics manually into a single spreadsheet.
This problem gets even worse when you consider that most Shopify admins also need to monitor KPIs from other marketing channels such as Facebook, Instagram, Google Ads, and Google Analytics. Simply keeping track of your sales data can become a full time job!
Fortunately, there is a simple solution to this reporting problem that will save you time, and means your team will never miss another failed order – Geckoboard.
How to report on multiple stores with Geckoboard
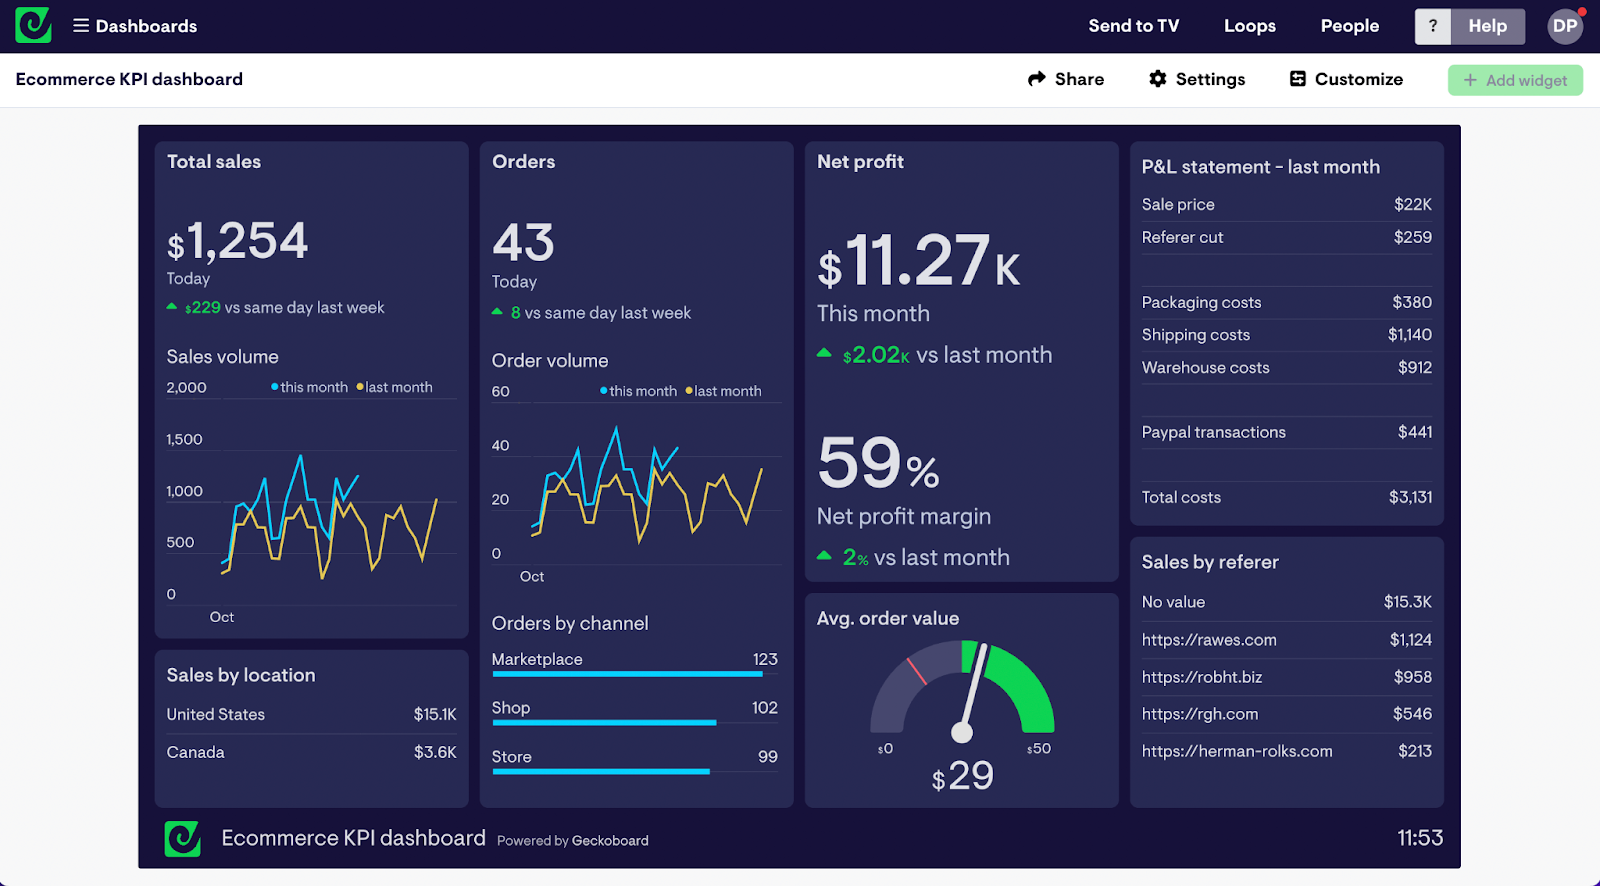
Geckoboard is a KPI dashboard tool that saves ecommerce pros time, and helps you monitor your most important ecommerce metrics in real-time. It connects to over 90 data sources in just a few clicks. These include Shopify, Zendesk Google Ads, Google Analytics, Facebook, Instagram, Google Sheets.
Then, using our user friendly drag-and-drop dashboard creator, you can build a custom ecommerce dashboard in just a few minutes.
The best part is, Geckoboard can connect to several stores on Shopify, meaning you can access you metrics all in one place.
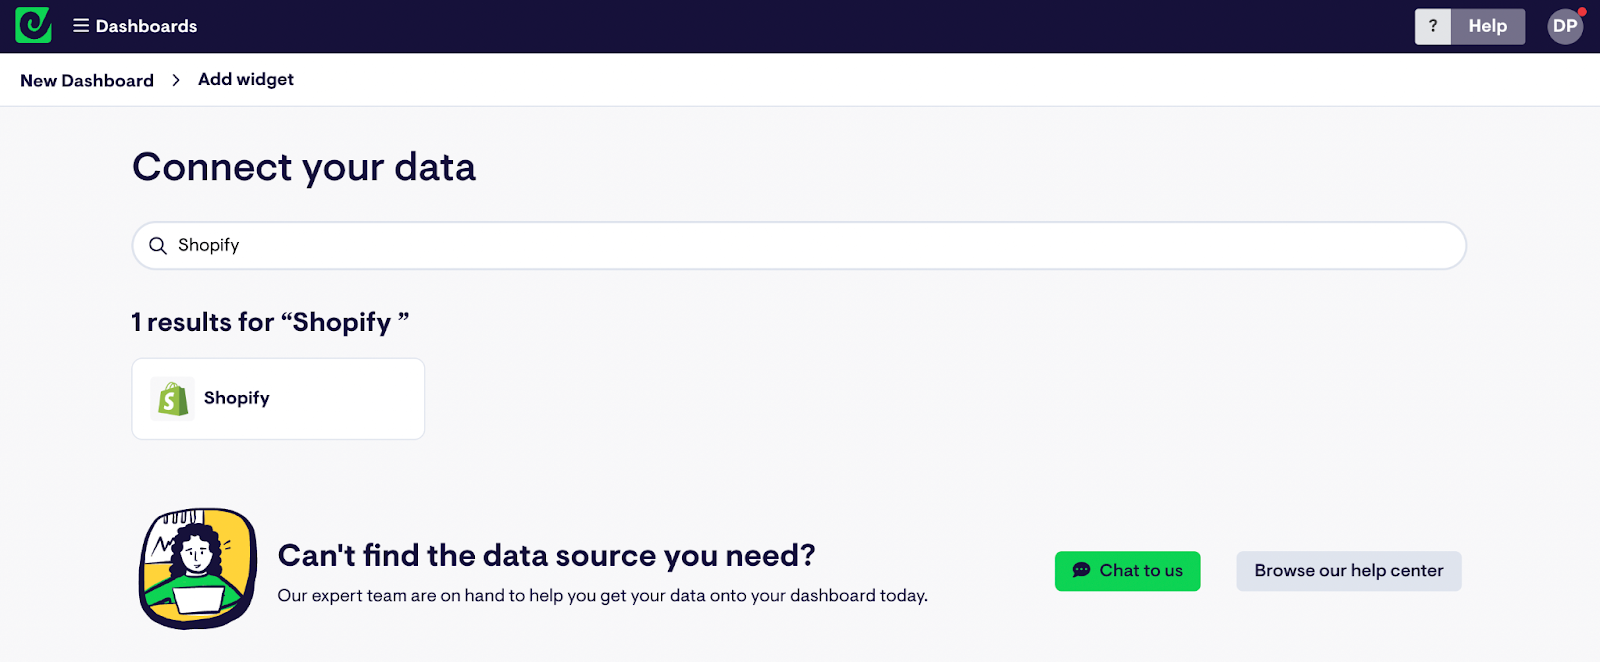
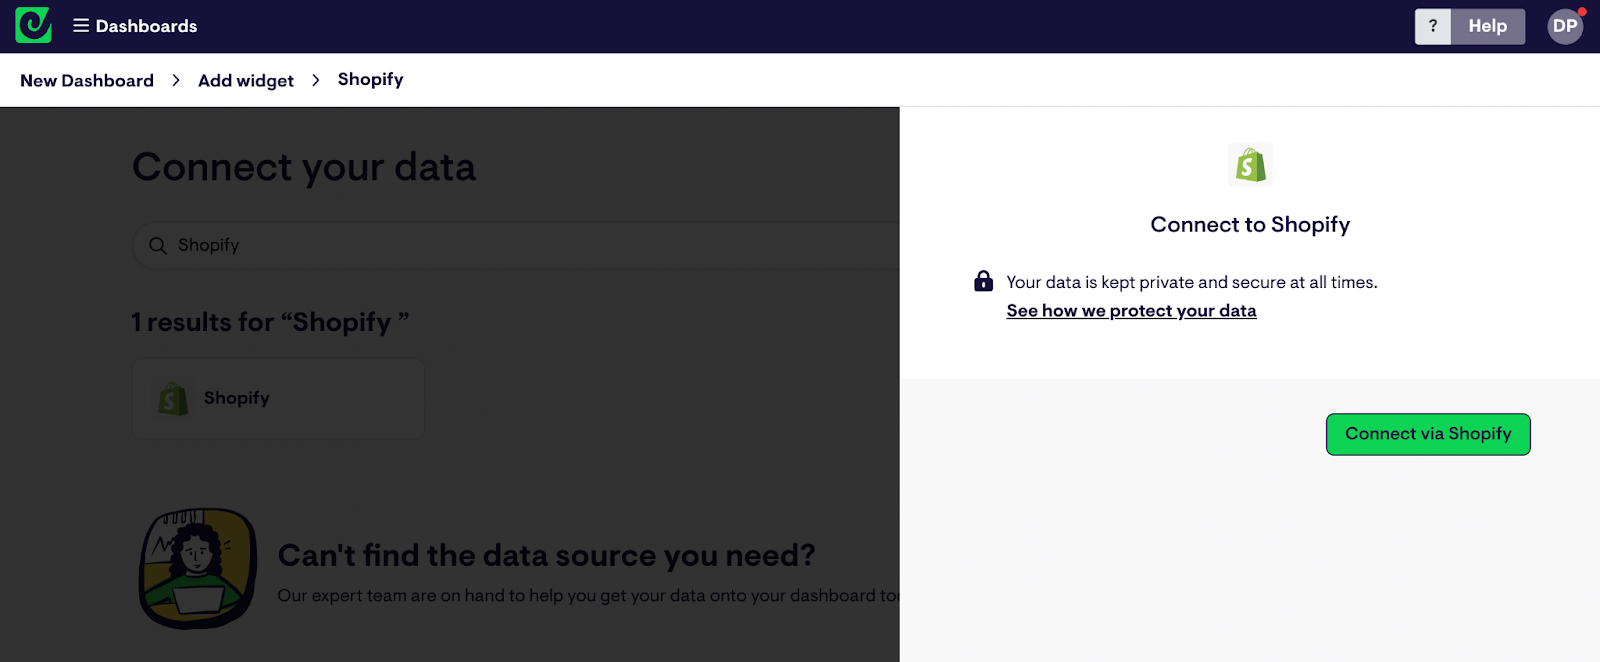
Step 1: Sign up to Geckoboard and connect your Shopify account
Geckoboard is an online app which you won't find on the Shopify app store. So head to Geckoboard to sign up for a free trial (you don’t need to enter any credit card details). Next, start building your dashboard selecting the Shopify data source.
(If you’re not ready to connect Shopify, you can always connect a Google Sheet to test your dashboard with some dummy data.)
Step 2: Build a widget using Shopify data
Now you’ve connected Shopify, you can start building widgets. A widget is just a type of data visualization – you can choose numbers, line charts, leaderboard or gauges.
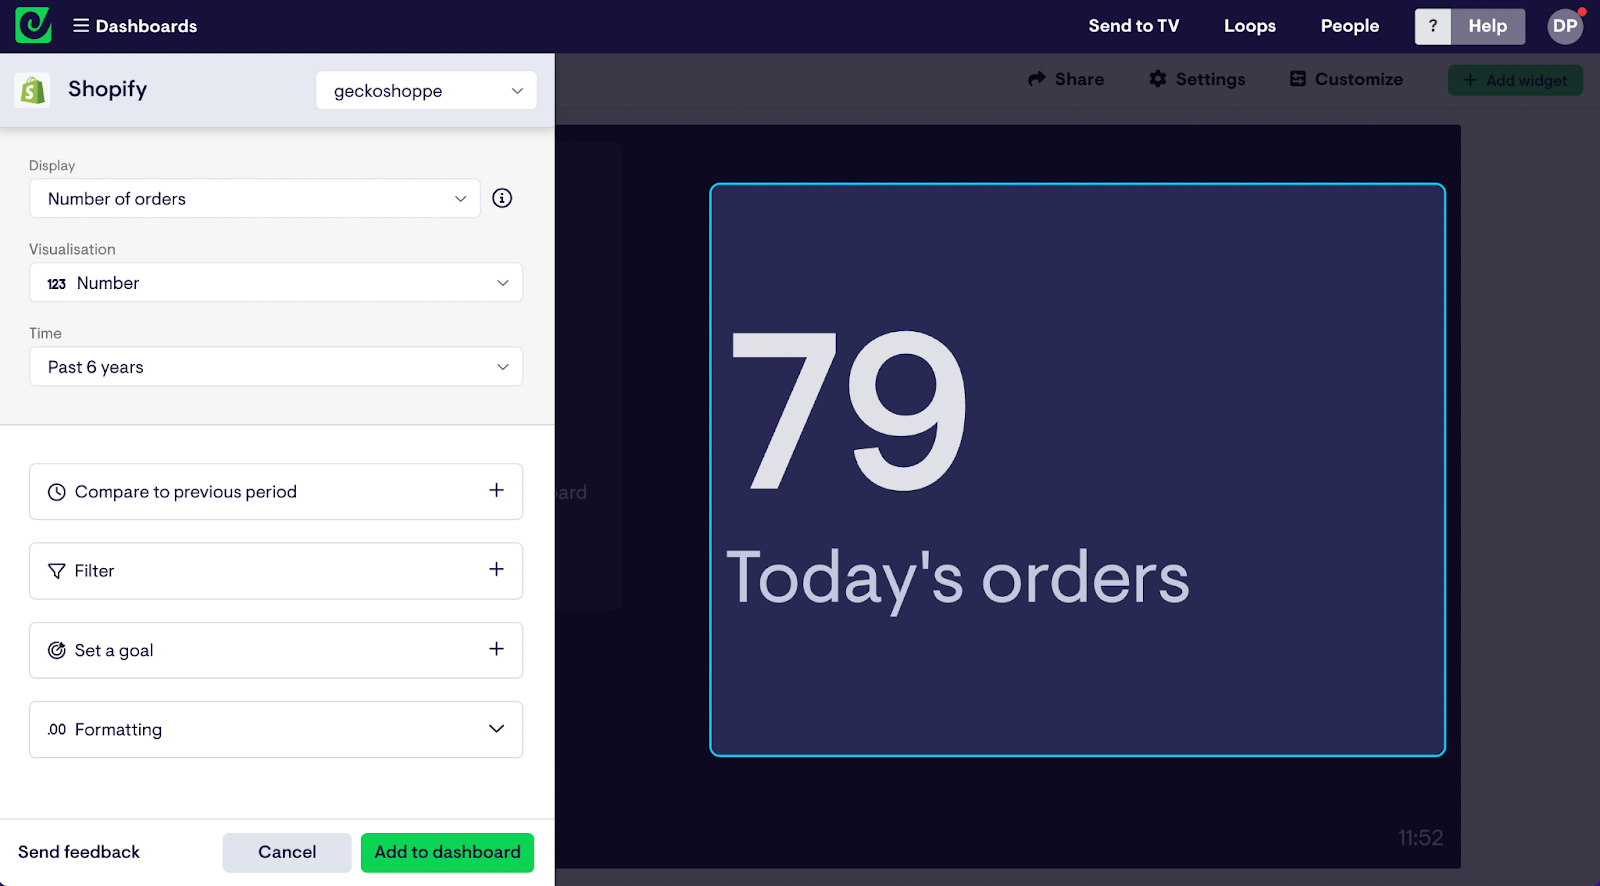
You can also add further context to your visualizations. For example, you might add a sales goal you are trying to reach, a comparison with a previous period.. This helps the team quickly understand how to interpret the data on the dashboard.
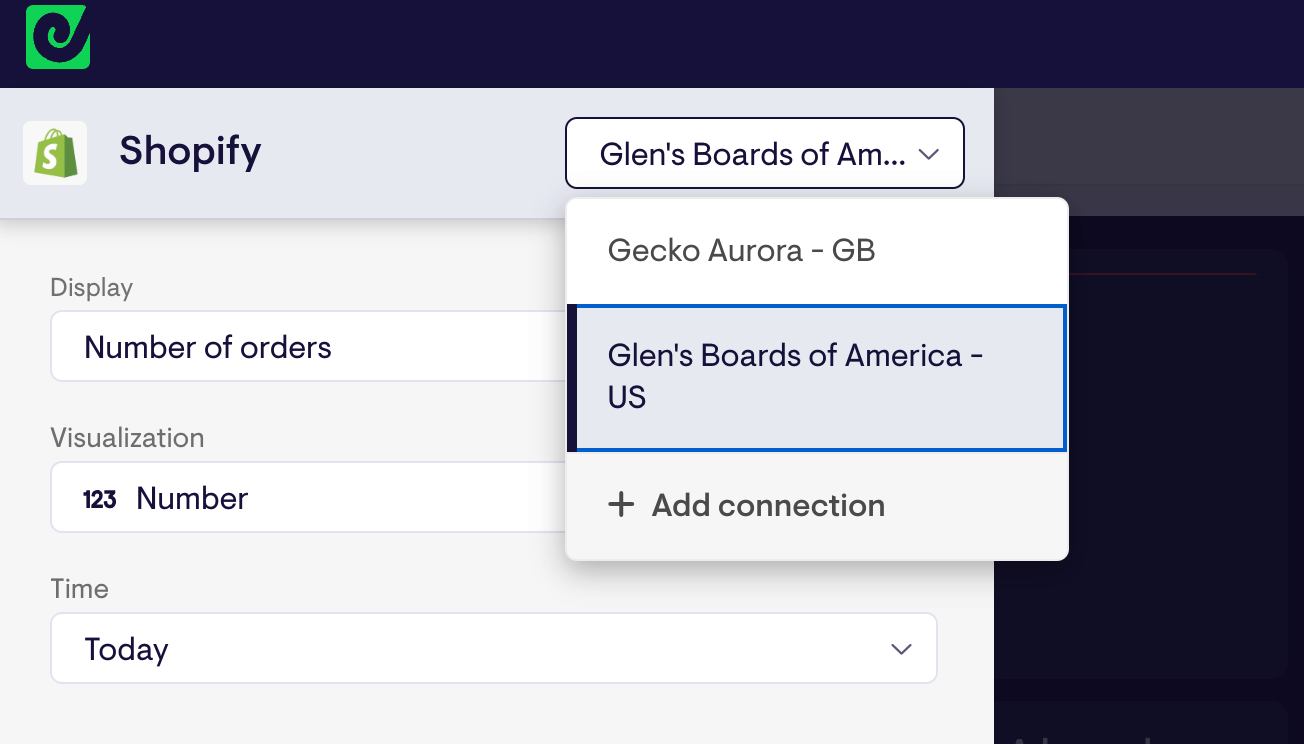
Step 3: Connect data from multiple Shopify stores
When you add a widget, you’ll notice there is a dropdown at the top left hand side of the screen, here you can connect additional Shopify stores. Just click the drop down and select Add Connection.
Step 4: Build up your dashboard by adding more widgets
Continue adding widgets until you’ve visualized all your most important data from across your different stores. You might complete the picture by including visualizations from other data sources such as Google Analytics, Google Ads, Facebook or Spreadsheets.
It’s easy to move, resize and group widgets using Geckoboard – it's just a case of "drag and drop'.
Conclusion
Et Voila!
Now you can see all your ecommerce metrics in one place. No more spending all your time logging into different accounts.
