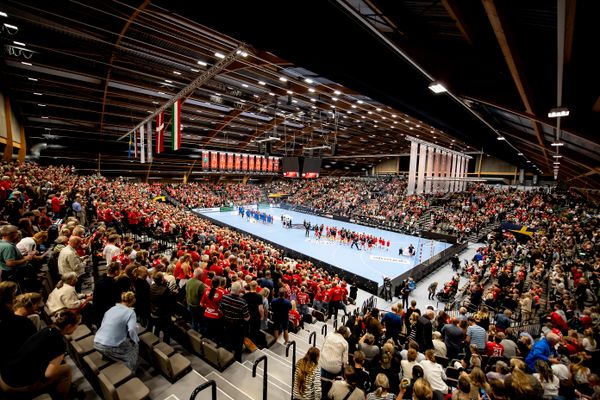
Ever feel like you have to chase all the data but not sure what to improve first? The number of metrics you could track for your mobile app is ridiculous.

If you try to focus on all (or even most) of them, you’ll spend your time obsessing over numbers instead of building a profitable app. Not to mention, the added expense and chaos of each team member working on different projects to improve different metrics, clashing for resources.

All the data results in all the chaos.

chaos-meme

Source: memegenerator.net

But what if your team were all laser focused on improving the same few key metrics for your mobile app? What if instead of competing for resources, everyone collaborated on the most important improvements? Imagine what could get accomplished.

It’s not easy, but rallying a team around a few key metrics is the most effective and powerful way to boost app performance and grow your business. That’s why we researched the top five mobile app metrics recommended by experts.

Discover why these mobile app metrics are critical and how to calculate each one below.

1. Retention Rate

The Retention Rate is the percentage of people who continue to use your app over a given period of time (week, month, or quarter). It’s the inverse of user churn. (If your 90-day Retention Rate is 25%, then your churn is 75%.)

The Retention Rate can also involve a cohort analysis to determine how users who downloaded the app around the same time (usually within the same month) fare compared to other clustered users (cohorts).

“Understanding your app’s retention rate and how it stacks up to the benchmark rates seen in your vertical and across the larger mobile ecosystem is an essential part of figuring out your customer engagement and retention strategy. Retaining new app users isn’t easy, with more than 75% of users failing to return the day after first use, on average.” - Todd Grennan, Senior Content Producer at Appboy

“Knowing your retention gives you a much better indication of your app’s success and current customer-base. Your app might have 100,000 downloads, but how many of these people are actually active?” - Alex Walz, Head of Growth at Lighter Capital

How to calculate Retention Rate

Aggregate Retention Rate:

(#) Monthly active users / (#) Installs = (%) Aggregate Retention Rate

Cohort Analysis:

(#) Users retained at the end of time period / (#) installs at start of time period = (%) Retention Rate for Cohort

View the pros, cons, visualization examples, benchmarks and more for Retention Rate here.

2. Average Revenue Per User (ARPU)

The Average Revenue Per User (ARPU) is the revenue generated (on average) by each active person using your app. This is a very similar metric to Average Revenue Per Account (ARPA), generally used for SaaS models. The difference is that SaaS models tend to look at this based on account level (which may have multiple users within one business), while consumer apps tend to monetize individual users.

“Aside from apps that provide enough value to justify a subscription model, the important thing is acquiring users and keeping them engaged. The average revenue for an active user is fairly constant, regardless of the monetization method.” - Mark Wilcox, Developer at Developer Economics

How to calculate Average Revenue Per User

($) Total revenue generated during specific time period / (#) Active users during the same period = ($) Average Revenue Per User

View the pros, cons, visualization examples, benchmarks and more for Average Revenue Per User here.

3. App Ranking

App Ranking is the listing position of your app in an app store or marketplace. The most common app marketplaces are Apple App Store, Google Play, and Amazon Appstore.

“In the world of apps, ranking is just as important when it comes to standing out in a sea of more than 1.3 million apps. Simply put, better rankings mean more downloads and easier discovery.” - Alex Walz, Head of Growth at Lighter Capital

“The rankings in Apple’s App Store can make or break an app development company.” - Jim Edwards, Founding Editor at Business Insider UK

How to calculate App Ranking

While the exact algorithm for how apps get ranked hasn’t been shared by Apple, Google, or Amazon, there are several known factors that impact the ranking. These include rating count (how many ratings your app has), installs (how many people have installed your app), trends (how quickly your app is growing), and rating (how many stars people give your app).

For a more in-depth look at calculating App Ranking, see here. Tracking your App Ranking is easy when you use a tool like appfigures.

View the pros, cons, visualization examples, benchmarks and more for App Ranking here.

4. Cost Per Install

Cost Per Install is the price to acquire a new customer from paid advertisements. This metric refers to paid installs in contrast to organic installs.

“CPI (and the derived CPLU) is best used in combination with ARPU to calculate the return on investment for your marketing efforts.” - Alex Walz, Head of Growth at Lighter Capital

“Cost Per Install remains to be one of the most important metrics for mobile app owners to measure. For companies that extend their existing business on mobile, CPI is a real indicator of investment they need to make to include mobile into the mix of channels they use to reach out to their customers.” - Artyom Dogtiev, Content Editor at Soku Media

How to calculate Cost Per Install

($) Ad spend / (#) new installs from ad = ($) Cost Per Install

View the pros, cons, visualization examples, benchmarks and more for Cost Per Install here.

5. Session Length

The Session Length of an app is the amount of time from when a user launches the app until they stop using or leave the app. It tracks the duration of an individual, continuous experience in the app. Depending on the type of app, Session Length can be defined more narrowly as needed (e.g. a streaming app may timeout after a certain duration or track time running in the background).

“It is important for app publishers to understand whether their app’s mission is best served by keeping users in the app as long as possible or by returning them as quickly as possible, and only session length can tell them that. Session length is not the only metric for measuring engagement, but it is one that really matters.” - Henry Cipolla, CTO of Localytics

How to calculate Session Length

Time user becomes inactive - time app was launched = (#) Session Length

View the pros, cons, visualization examples, benchmarks and more for Session Length here.

Track Metrics Live to Take Your App to the Next Level

Once you’ve decided which mobile app metrics to track, the next step is making sure they’re front and center for the whole team to see on a daily basis. Keeping your team focused requires constant communication.

Tracking your metrics with a live TV dashboard is one way to ensure everyone stays current and works towards the same goal.