
In 2020, according to a survey by Owl Labs, nearly 70% of full-time workers in the US are remote. As a result of the pandemic, many teams had to switch to remote work suddenly. They needed to figure out new ways to achieve the teamwork and collaboration they had in an office setting.
Buffer’s State of Remote Work survey found that remote workers cited collaboration and communication as one of their biggest struggles. We spoke to several businesses and found a similar trend among data-driven businesses. Teams rely on shared data and discussions to make collaborative decisions. When they switched to working from home, team members needed a way to stay on the same page and ensure they were all tracking the same metrics and looking at the right data.
One solution? Shared data dashboards. Dashboards capture a snapshot of your most important metrics, updated in real time so your team stays up-to-date and on the same page.
We interviewed four companies using Geckoboard to keep their teams connected and help them stay on top of changes brought on by the pandemic. Reading these real-life examples, you’ll see how a data dashboard can help motivate sales teams, track both real-time data and trends, and make data more easily accessible.
1. Furlenco: Separating real-time data from trends
When Furlenco, India’s largest online furniture rental company, had to transition suddenly to remote work due to COVID-19, many of its employees had never worked from home before. The team used Geckoboard to simultaneously monitor real-time data and longer-term trends to ensure the whole team knew where to focus their efforts.
Challenge: Ticket backlog caused by delivery delays
Because of the pandemic lockdown, Furlenco was unable to make deliveries for two months. The delay created a significant backlog for its customer support team. Reps were dealing with the increased tickets while trying to adjust to working remotely for the first time.
Furlenco uses Zendesk for customer support and regularly collects data from the tool regarding customer support calls, chats, tickets, and other information. The company was receiving reports from Zendesk every 24 hours, but this was not enough. It needed a way to track metrics in real time. This would allow the team to closely monitor the backlog and respond to customers immediately to let them know about delivery issues.
At the same time, they wanted to monitor week-over-week (WOW) and month-over-month (MOM) trends to track how delays from the pandemic were affecting business in the longer term.
The company was collecting customer support data in Zendesk and using Google Sheets for delivery and pickup scheduling. It needed a way to pull all the data together in one location without having to manually transfer data from Zendesk to Google Sheets. Furlenco also needed to share the aggregated data with the remote support team so that all team members could easily access their top metrics.
Solution: A real-time dashboard and a trends dashboard
Furlenco built two separate data dashboards, integrated with Zendesk and Google Sheets. One displayed real-time updates, while the other tracked WOW trends. The dashboard below is displaying real-time data, tracking new and open tickets, pending tickets, solved tickets, and the company’s current customer satisfaction (CSAT) score. The bottom-right also displays the overall average CSAT score for comparison.
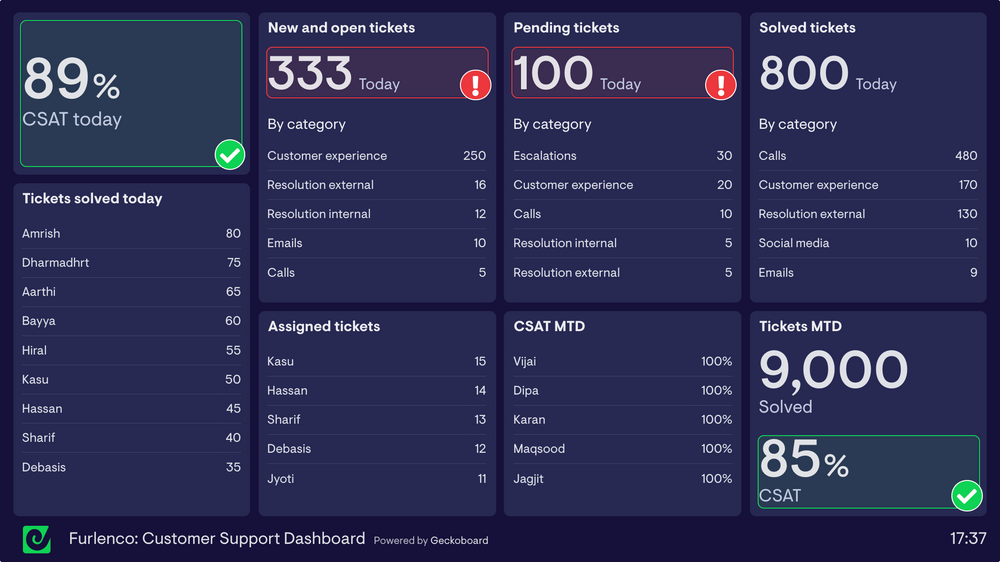
Furlenco used sharing links and embedded the dashboards on the company intranet to ensure all employees had access.
“Our dashboards have been a huge help to my team who had never been fully remote before,” says Sandeep Jindal, head of customer support at Furlenco. “They allowed us to adapt and get on top of the backlog of work that COVID caused.”
With Geckoboard, the team could see right away where to focus their efforts to reduce ticket backlog and address negative trends.
Key takeaway: Use separate dashboards for different types of data
Use multiple dashboards to separate real-time data from longer-term trends. This will help your team see where they need to focus their efforts right now while still watching for patterns of problems they need to address.
2. COBB Tuning: Managing increased ticket volume
COBB Tuning, an automotive engineering company, had to deal with a dramatic increase in support tickets when the pandemic hit. They turned to Geckoboard to help track tickets and distribute the workload across their 14-person customer support team.
Challenge: Massive influx of support tickets
Cobb Tuning saw its numbers of support tickets increase by 10–15% after COVID-19 hit. The company went from 7,000–8,000 tickets per month to upward of 10,000–11,000, along with increased sales and inquiries. The support team was fielding tickets from multiple channels, including chat, email, and phone.
The company has a reputation for excellent customer service—their first response time is usually under 12 hours for any channel, and they maintain an average CSAT score of 95–96%.
In order to maintain their low first response time and high CSAT, COBB Tuning needed a way to track the increased ticket volume and distribute it across a support team that was suddenly working from home.
Solution: A shared customer support team dashboard
Using Geckoboard, the team created a customer support dashboard. They integrated it with their Zendesk suite and used sharing links to ensure the entire remote team had access.
With the dashboard, everyone on the team can see the current lineup of customer calls and tickets, updated in real time. This helps keep everyone on the same page and makes it easier to distribute tickets across all employees. The team can immediately see if a backlog is building and redistribute time and resources to deal with it right away.
The group meets every Friday to recap the week and review metrics. Having a dashboard means every team member is looking at the same data without sharing screens or coordinating which data source they’re looking at. Geckoboard is available on a mobile app as well, so team members can access the dashboard wherever they are.
Key Takeaway: Use a dashboard to distribute your customer support workload
Help your remote support team track tickets in real time with a shared dashboard. This will improve teamwork and collaboration by enabling every team member to see the current ticket backlog. Then they can decide how best to distribute the workload evenly.
3. Five Doors Network: Motivating sales teams with leaderboards
The real estate company Five Doors Network was scaling rapidly from 2015–2018. They saw a 258% revenue growth. When the pandemic lockdowns went into effect, the company turned to Geckoboard to keep their sales team connected. It worked to motivate newly remote employees by sharing the stats from the top agents.
Challenge: A disconnected sales team
Teams across the network’s seven locations were experiencing different degrees of lockdown. With many agents working remotely, it was harder to track how other team members or the company as a whole were doing. It’s more challenging to hold informal update meetings as a remote team, and agents can’t drop in on one another to discuss sales efforts.
Initially, Five Doors Network team members were sharing updates by taking screenshots of a spreadsheet and emailing them. This format made it difficult to track the performance of individual agents.
Managers at the company wanted to share data in a format that agents could quickly scan, and at the same time, find a way to motivate their newly isolated sales agents.
Solution: a leaderboard-style dashboard
Five Doors Network used Geckoboard to create a leaderboard sales dashboard and sent it to team members via sharing links. The dashboard displayed top agents by location as well as leaders for the month and year.
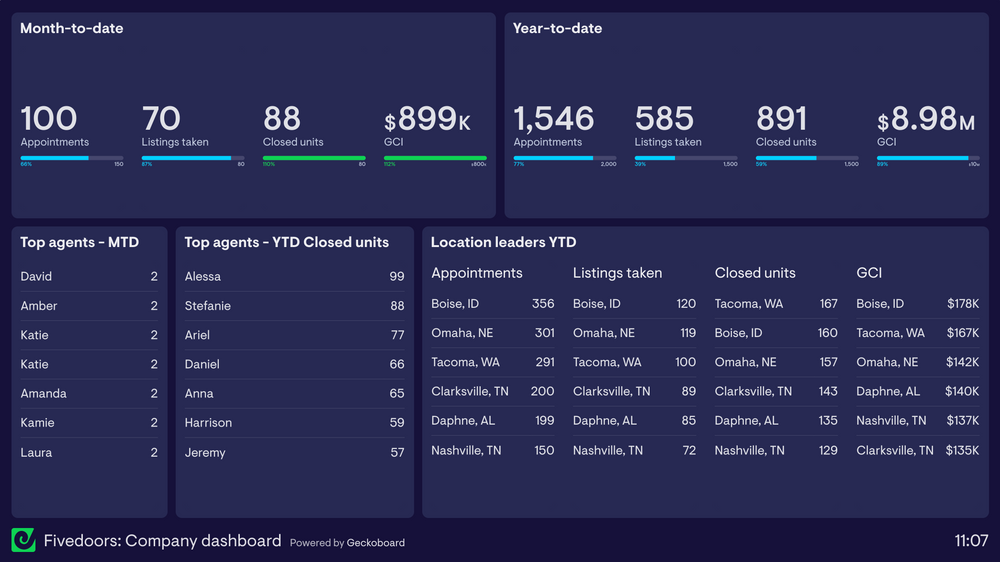
Michelle Jaeger, head of operations at Five Doors Network, commented that the leaderboard “allows [their] agents to see where they fall in comparison to both their location and in the whole company in terms of number of units closed, gamifying it a bit.”
Thanks to the sharing link, team members can check the leaderboard at any time, from anywhere. The sales team also discusses the dashboard data as part of their daily standups.
Key takeaway: Foster an atmosphere of friendly competition
Appeal to the competitive spirit of your remote sales team with a leaderboard dashboard. Display the names of your top sales agents for the week or month. Or you could list top sales by location, as Five Doors Network did, to create a sense of internal teamwork and collaboration while encouraging competition at the team level. This culture might grow organically in an office environment, but with a distributed team, you have to foster it more actively.
4. Codator: Making data easily accessible
Legal services company Codator collects data from several sources, including Zendesk, Google Analytics, and Intercom, to monitor every stage of the sales funnel. When the Netherlands went on lockdown, the company used Geckoboard’s Slack integration to ensure remote team members could easily see their most important metrics without digging through multiple data sources.
Challenge: Large amounts of data and a newly remote team
Codator pulls information from Intercom, Zendesk, and six websites in Google Analytics. The company tracks website traffic, leads, conversion rate, and other sales funnel metrics alongside customer support information like numbers of calls and chats. It’s collecting an enormous amount of data every day. When the 30-person team suddenly had to switch to working from home, the company needed an easy way to share that data.
It connected Zendesk, Google Analytics, and other data collection tools to Slack, but that still meant team members had to sort through data from multiple sources to find the metrics they needed. Each team needed to be able to see a snapshot of their key metrics for the day.
Solution: Geckoboard’s Slack integration
Codator created separate dashboards for each team. When the company went remote, it used Geckoboard’s automated integration to send a snapshot of each dashboard to Slack at the end of each day.
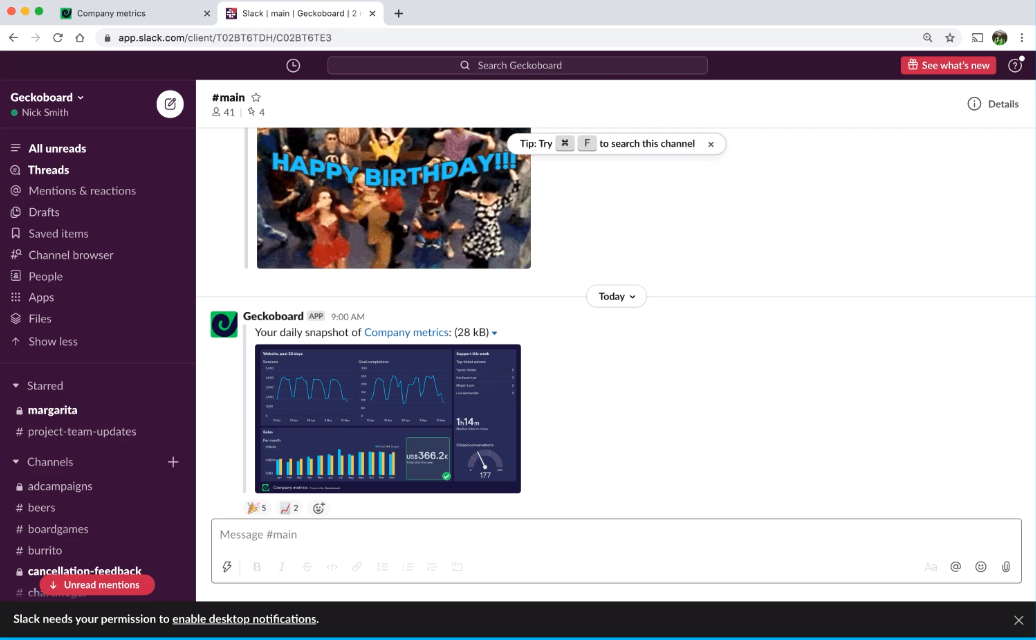
The dashboard summarizes the team’s most important key performance indicators (KPIs), such as website traffic and conversion rate for the marketing team. The snapshots help keep employees from being overwhelmed as they sort through massive amounts of data. The whole team is able to look at the same metrics at the same time, such as during team standups. Codator found the Slack-Geckoboard integration so helpful that its teams continued to use it even after returning to the office.
Key takeaway: Share data snapshots in Slack
Make your data dashboard more accessible by connecting it to Slack. Remote or out-of-office team members will be able to quickly and easily check their data wherever they are, using an application they’re already familiar with.
Include dashboards in team meetings to support teamwork and collaboration
Help your team collaborate more effectively by incorporating data dashboards into your regular weekly or daily team meetings—a strategy used by all of the companies in this piece. Looking at dashboards during meetings helps improve internal communication by providing employees with a chance to address concerns based on the data. It also gives other team members a chance to weigh in and work on a joint solution. Team leaders can act as facilitators to improve teamwork and collaboration and distribute tasks and resources where they’re most needed.
