Most sales leaders I've spoken to manage their teams on a one-week lag. The Monday meeting reviews last Friday's numbers. The pipeline review on Thursday looks at data that was entered into the CRM sometime earlier in the week, by reps who were also trying to hit their calls target at the time. By the time a problem becomes visible, it is already several days old.
This is not a people problem. It is an infrastructure problem. The tools most sales teams use were designed to record activity and produce reports, not to give continuous visibility into what is happening right now. The result is a monitoring gap that compounds quietly across every week of every quarter.
Real-time sales monitoring is the practice of displaying live CRM data on a shared dashboard so that a sales leader can see current pipeline health, rep activity, and progress to target at any moment, not just at the next scheduled review. This article explains what it requires, which metrics actually matter, and how to build a setup that gives genuine live visibility into team performance without adding another meeting to the calendar.
Why real-time monitoring is different from better reporting
There is a meaningful distinction between faster reports and genuine real-time visibility. A report, even a well-designed one, still requires someone to open it, interpret it, and decide to act. That sequence introduces delay at every step. Real-time monitoring changes the model: instead of pulling data when you decide to look, the data is permanently visible and updates continuously. The decision to act is triggered by what you see, not by a scheduled review.
The practical difference is in response time. If a rep's deal activity drops to zero for three days, a weekly report surfaces this at the next meeting. A live dashboard surfaces it the same afternoon. The intervention that takes five minutes on day three becomes a pipeline recovery conversation on day eight.
This distinction is what the MIT Centre for Information Systems Research was pointing at in their 2024 study when they found that top-quartile real-time businesses achieved 62% higher revenue growth than their peers. The advantage is not the technology. It is the compression of the time between signal and response.
The six metrics that matter for real-time sales monitoring
Not every CRM field belongs on a monitoring dashboard. The metrics worth tracking in real time are the ones that change frequently, signal problems early, and require a response within days rather than weeks.
What is pipeline coverage ratio and why does it matter for sales monitoring?
Pipeline coverage ratio is the ratio of open pipeline value to the remaining quota for the period. A rep with $80k of open pipeline against a $40k remaining target has 2x coverage, which is broadly okay. A rep with $25k of pipeline against the same target needs attention immediately, not on Friday. Tracking this live, broken out by rep, allows a manager to identify pipeline thinness before it becomes a quota miss. See pipeline volume vs goal for how to define and measure this metric.
How do you identify deals at risk in a real-time sales dashboard?
A deal is at risk when it has been sitting in the same pipeline stage for longer than your average deal velocity at that stage, or when there has been no activity against it in the last five to seven days despite being at a late stage. These deals do not announce themselves. They sit quietly in the CRM while the rep focuses elsewhere. A real-time flag, visible to both the rep and the manager, creates the accountability to act before the deal goes cold.
Why track new deals added this week rather than total pipeline value?
New pipeline creation is a leading indicator that lags are almost invisible without live monitoring. If your team needs to add twenty new deals per week to sustain the quarter's number, and by Wednesday only four have been created, you have a problem that is recoverable on Wednesday and difficult on Monday.
Tracking this as a running weekly total, visible in real time, gives the manager the information to course-correct while there is still time.
What does activity rate by rep tell you that pipeline data doesn't?
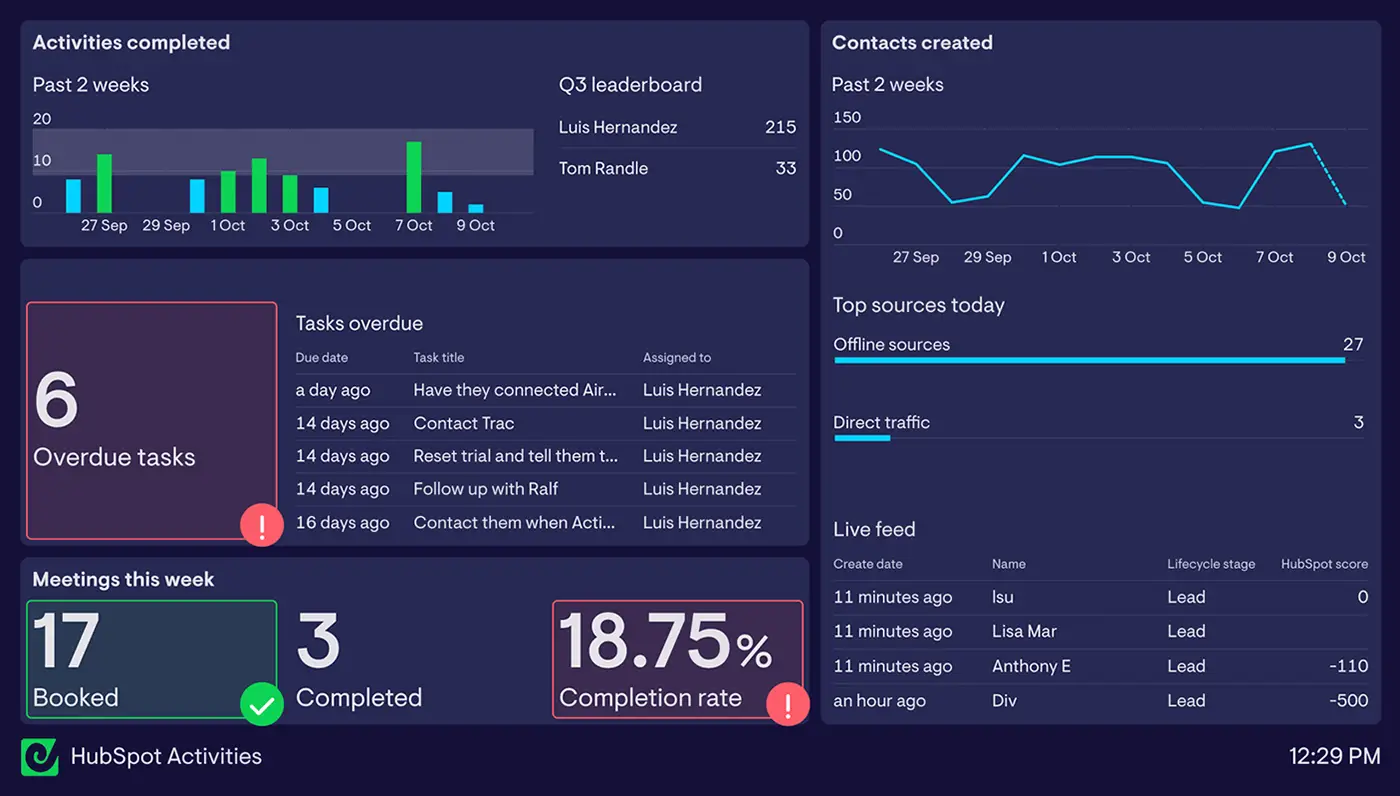
Calls made, emails sent, and meetings booked per rep, measured against a weekly target. The purpose of monitoring this in real time is not to police behaviour but to catch reps who have gone quiet, which is usually the first signal that something is wrong, whether that is a confidence problem, a capacity problem, or a personal issue. You cannot help someone you cannot see. See activity per rep for a full definition of how to measure this.
How does stage-by-stage conversion rate fit into real-time monitoring?
Stage conversion rate shows where deals are dropping off. If your team consistently converts from discovery to proposal at 70% but from proposal to close at 20%, the problem is in the proposal stage, not the prospecting stage. SQL-to-win conversion rate is a useful benchmark metric to track alongside stage-level conversion.
This metric moves slowly enough that weekly visibility is sufficient, but including it in a live dashboard gives a manager a running read on whether the pipeline shape is healthy or distorted.
Why is cumulative closed revenue vs. target the most important metric to display?
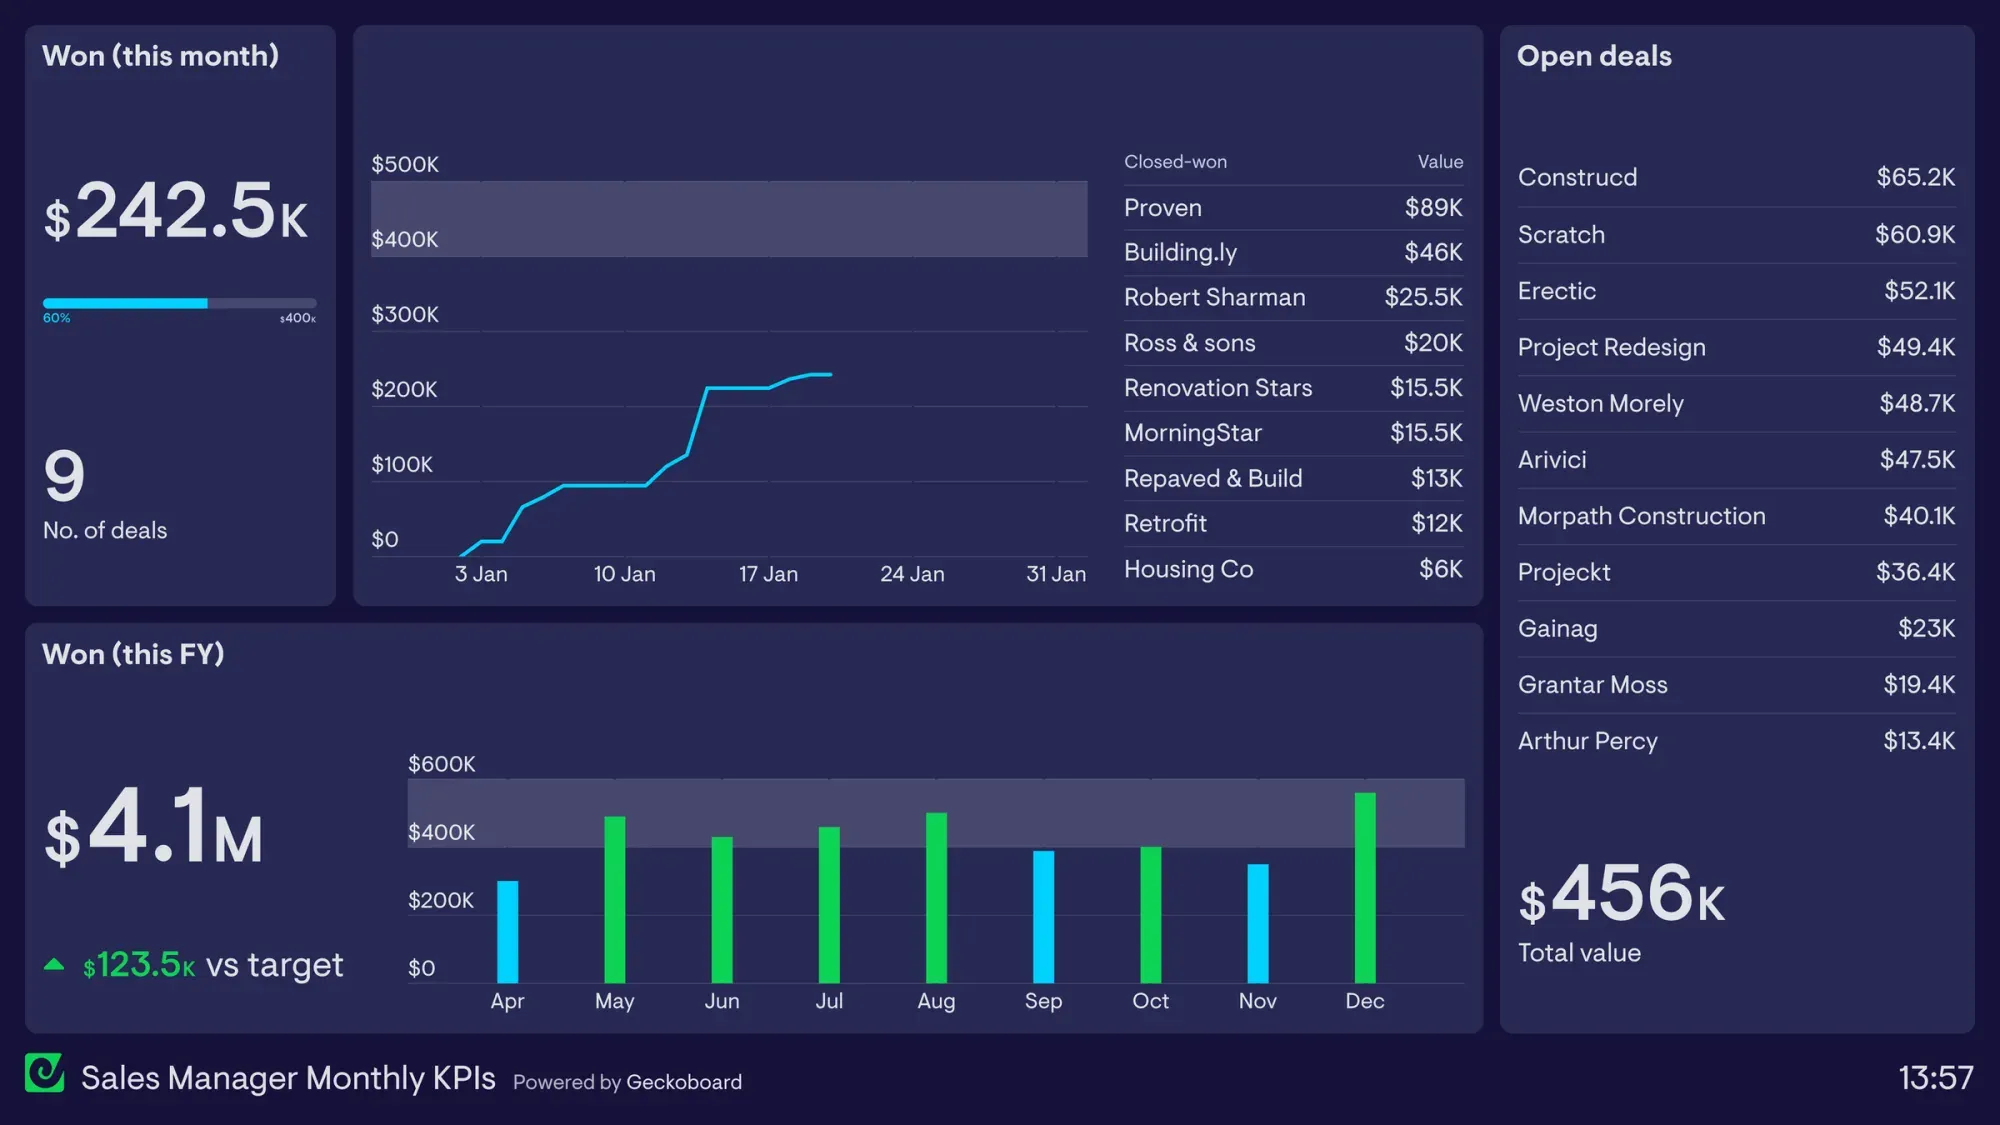
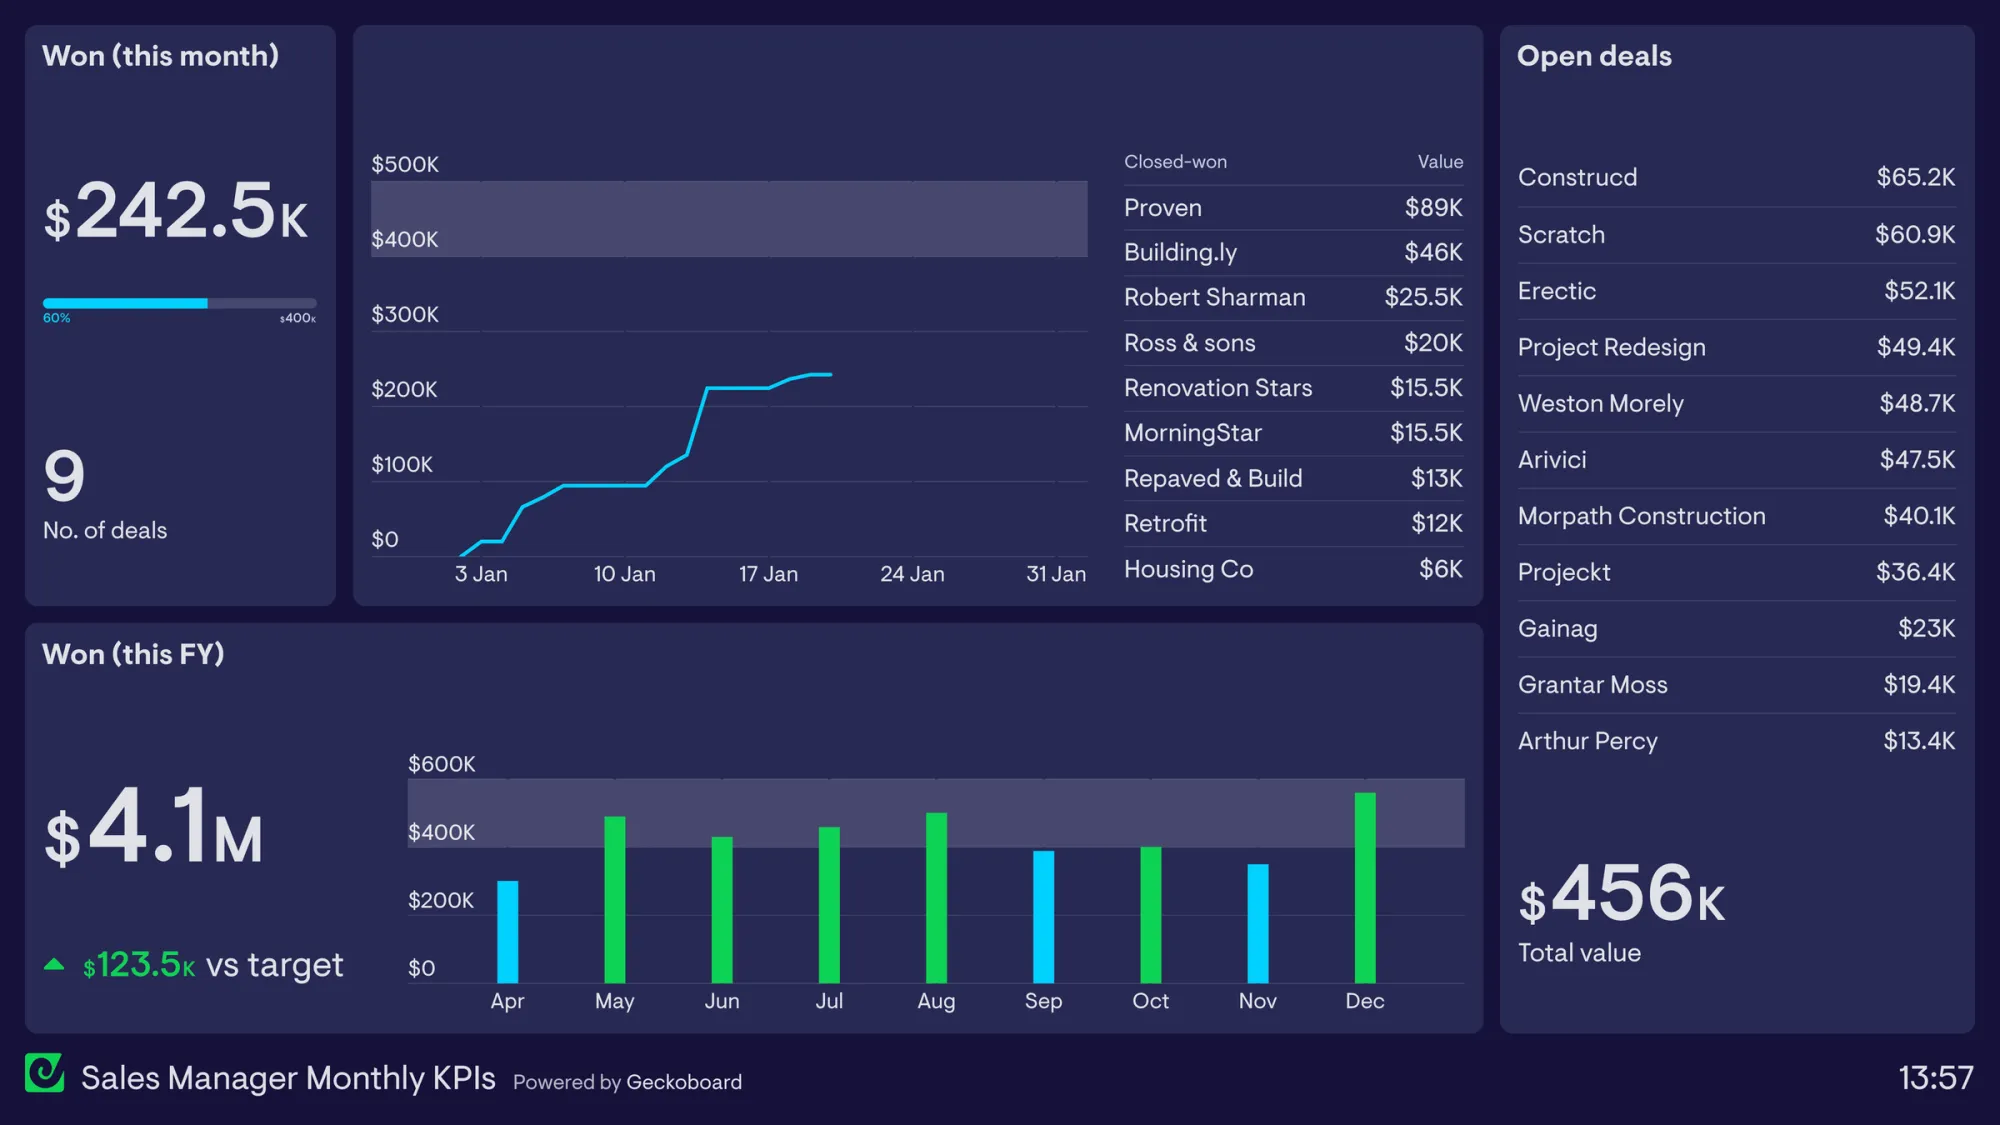
It is the simplest metric and the one that matters most. Presented as a running total with a target line, it gives everyone on the team an identical, unambiguous read on where the month stands. The goal is not surveillance. It is shared understanding. See MRR closed vs quota for a worked definition.
When both the manager and the reps see the same number, conversations shift from "where are we?" to "what do we do about it?"
How to build a real-time sales monitoring setup with Geckoboard
The technical requirement for real-time sales monitoring is a live connection from your CRM to a display that the team can see without actively opening a browser tab. Most CRM reporting tools require you to open them, refresh them, and interpret them. A shared dashboard changes this: it is always on, always current, and visible without anyone needing to decide to look at it.
Geckoboard connects directly to Salesforce, HubSpot, and most major CRM platforms without requiring data exports or scheduled syncs. The connection is live, which means the numbers on the dashboard reflect what is in the CRM within seconds of an update, not at the next scheduled refresh.
Matt Dubois, Director of SDRs at Pearl, a dental AI company running their team on HubSpot, describes exactly why this matters:
"Setting up dashboards through our CRM was too time-consuming and wouldn't update with sufficient frequency for real-time visibility."
After switching to Geckoboard, he built a live screen showing daily dials by rep, demo bookings against target, and monthly revenue leaders. The result:
"Effort metrics increased, output metrics increased. The dashboards allow us to give ourselves small milestones to hit and celebrate. They make performance super visible."
He also noted it saved him a week of manual configuration compared to trying to replicate the same view inside HubSpot.
A practical real-time monitoring setup for a sales team has three layers:
The team board
Visible in the office or shared in a channel the whole team has access to. Shows:
- Cumulative closed vs. target (current month)
- Deals added this week vs. target
- Total pipeline value by rep
The purpose is shared context. Every rep knows where the team stands without being told. See the sales competition dashboard and sales manager dashboard for examples of how teams structure this view.
The manager view
Shows everything on the team board plus:
- Deals at risk (no activity in five days)
- Pipeline coverage ratio by rep
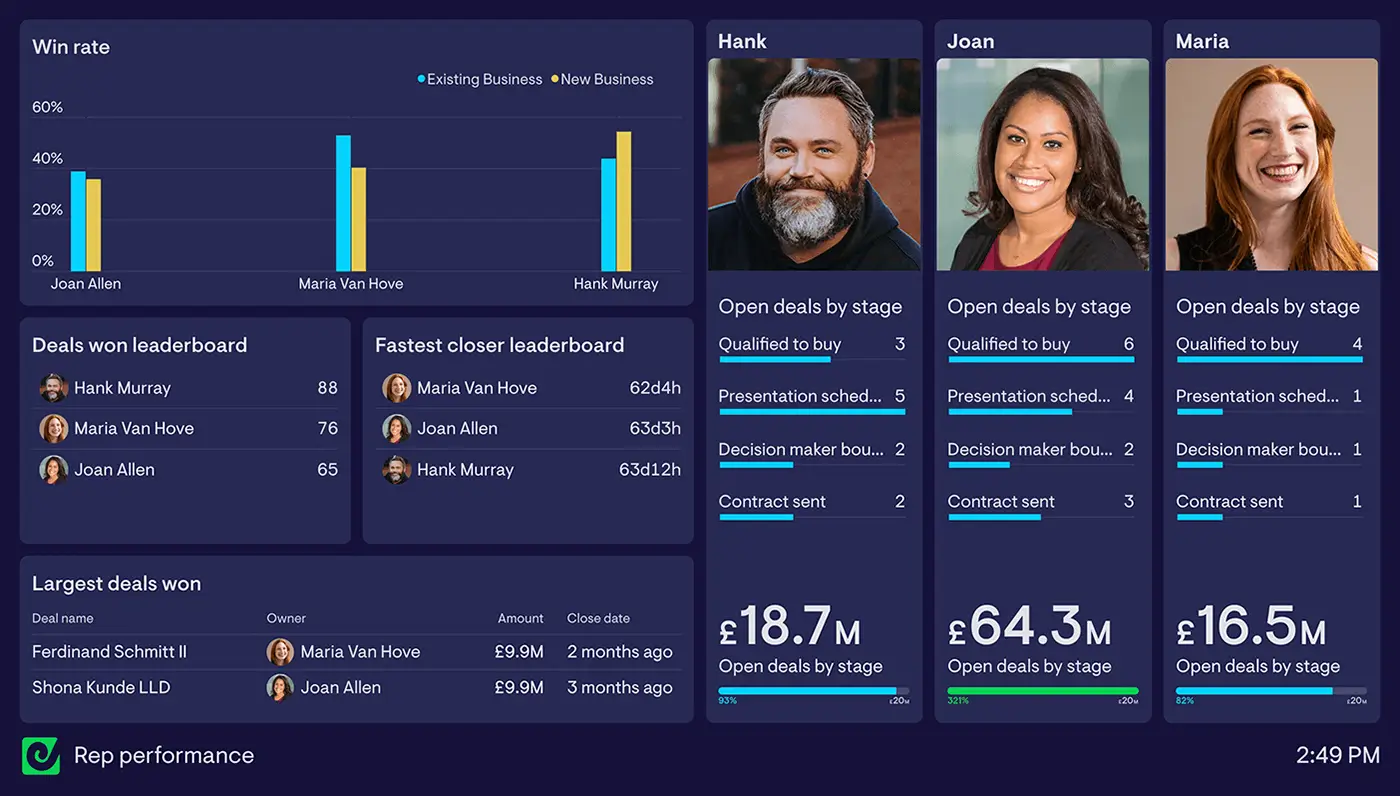
- Activity rate by rep vs. target for the current week
See the sales pipeline dashboard example and sales rep dashboard example for how to structure this view. This is the view that enables proactive coaching rather than reactive post-mortem.
The executive view
A simplified read showing:
- Closed revenue vs. target
- Pipeline coverage
- Week-over-week trend in new deals created
Executives need context, not detail. A single screen that updates continuously removes the need to ask the sales leader for a status update before every leadership meeting. See the sales opportunities dashboard example for a template to start from.
Building these three views in Geckoboard takes a few hours once the CRM connection is established. The metrics listed above map directly to standard Salesforce and HubSpot fields, which means no custom API work is required for most teams.
What changes when the team can see it
The most immediate change is in the quality of the weekly sales meeting. When everyone has been looking at the same live numbers all week, the meeting stops being a reporting session and starts being a decision session.
The question changes from "where are we?" to "we can see where we are. Here is what we are going to do about it."
The second change is in response time. Problems that previously surfaced at the end of a week get caught mid-week. A rep with a thin pipeline is identified on Tuesday and given support before Friday's review. A deal that has gone quiet for four days gets a call on day five rather than disappearing from the quarter entirely.
Christopher Ford, Director of Growth at HappyDoc, a four-person SaaS sales team using HubSpot, describes the before state clearly:
"We had performance data scattered across Google Analytics, Google Ads, and HubSpot, forcing the team to mentally piece together the performance narrative."
After consolidating into shared Geckoboard dashboards with daily visibility on leading indicators, the result was direct:
"We had the first month where we drove 10% month over month growth of our entire business's revenue."
The mechanism was not the dashboard itself. It was the shift from a team operating without daily performance context to one with identical, live numbers visible to everyone: sales, marketing, and the CEO, at the same time.
The third change is harder to measure but consistently reported by sales leaders who have made the shift: it raises the floor on rep performance. When activity and pipeline data are visible to the whole team in real time, the social accountability of shared visibility does some of the work that coaching conversations previously had to do.
This is not about surveillance. It is about making the shared goal legible to everyone working toward it.
The most common mistakes when setting up sales monitoring
The most common mistake is building a dashboard that shows everything. A dashboard with thirty metrics is a report with a different format. It requires interpretation, it takes time to read, and it does not create the immediate clarity that real-time monitoring is supposed to provide.
The discipline is to choose the six to eight metrics that require action when they change, and display only those. Everything else belongs in a CRM report for monthly analysis, not on a live monitoring screen. Our dashboard design guide covers this in more depth.
The second common mistake is building the dashboard for the manager rather than the team. A monitoring setup that only the manager can see reproduces the same visibility gap it was designed to close: reps are still operating without live awareness of where the team stands.
The team board, simple, clear, and visible to everyone, is not optional. It is the mechanism through which shared accountability actually works. See how to display dashboards on TV screens for the practical setup.
The connection between monitoring and alignment
Real-time sales monitoring is one part of a larger operational shift. The other part is ensuring that the marketing pipeline feeding the sales team is visible under the same conditions, so that when new deals slow down, both marketing and sales see it at the same time and can respond together rather than discovering it in separate weekly meetings held on different days.
This is the argument made in more depth in: Sales and marketing alignment needs a live view, not a better process.
The monitoring setup described here is the sales-side half of that picture.
Frequently asked questions
What metrics should appear on a real-time sales performance dashboard?
The six metrics worth tracking in real time are:
- Pipeline coverage by rep
- Deals at risk
- New deals added vs. target
- Activity rate by rep
- Stage-by-stage conversion rate
- Cumulative closed revenue vs. monthly target
These are the metrics that change frequently enough to require action within days rather than weeks. Everything else belongs in a monthly CRM report, not on a live monitoring screen. See our sales dashboard examples for templates covering each of these.
How often should a sales dashboard update?
A genuinely real-time dashboard updates within seconds of a change in the CRM. Scheduled syncs that refresh every hour or every day are not real-time. They are faster reports.
The distinction matters because a problem that surfaces on the same afternoon it occurs can be addressed the same day. A problem that surfaces at the next sync may already be a day or two old by the time anyone sees it.
What is the difference between real-time sales monitoring and a weekly sales report?
A weekly report requires someone to open it, interpret it, and decide to act. Real-time monitoring is permanently visible and triggers action from what you see rather than from a scheduled review.
The practical difference is in response time:
- Issues caught in real time are resolved in hours
- The same issues caught in a weekly report are resolved a week later, if at all
Which CRM platforms does Geckoboard connect to for sales monitoring?
Geckoboard connects directly to Salesforce, HubSpot, and other major CRM platforms without requiring data exports or manual syncs. The connection is live, meaning dashboard data reflects CRM updates within seconds.
How long does it take to set up a real-time sales dashboard in Geckoboard?
Most teams build their initial three-layer setup, team board, manager view, and executive summary, in a few hours. The standard Salesforce and HubSpot metrics map directly to built-in Geckoboard fields, so no custom API work is required for most configurations. Start a free trial to build your first dashboard today.
Geckoboard connects directly to Salesforce, HubSpot, and other major CRM platforms to build real-time sales dashboards your team can see and act on.

