If you’re thinking about rolling out KPI dashboards in your organization, you might have started to wonder how others in your team (and beyond) might respond to having data and KPIs surfaced in such a visible way.
Particularly if you’re planning to display dashboards on TVs in your workspace.
This is a fair point to ponder! As someone responsible for putting dashboards together, you probably have a clear vision for the data-driven culture you want to create:
- More streamlined decision-making, based on facts not just opinions
- An increased sense of ownership and transparency
- Tighter alignment around team, and company goals
- Improved efficiency, and perhaps lower costs
But the question is – will your team be comfortable with KPIs being shared openly?
Or will they need to overcome the FOBT…The Fear of Being Tracked?
In my experience the people who worry most about the FOBT are managers themselves. Because in reality, most teams love having easier access to important data. Not only does it make their life easier because they no longer need to dig into complicated tools, it literally visualizes the impact of the work they do, which is empowering.
But it’s worth acknowledging that the FOBT is a potentially small anxiety that some on your team might have in the early days of working with live dashboards.
So in this article we’ll dig a little deeper into what the FOBT is, and how to preempt and disarm it in the unlikely event that it pops up in your team.
What is The Fear Of Being Tracked (FOBT)?
Over the years, Geckoboard has helped managers in thousands of businesses share live data, metrics and KPIs more openly in their organization. And in the vast majority of cases, our dashboards have been met with”ooohs”, “aaaaahs”, and calls of “I want even more dashboards!” the first time a team sees data they care about up on a dashboard.
“When we started giving agents a little bit more visibility on the bigger picture, everyone started craving more!”
Jack Harrison-Sherlock, Senior Continuous Improvement Lead, Vend
Sometimes - very rarely - we hear of cases where there’s been some initial apprehension amongst the team around what the dashboard is for, what the numbers mean, and what the consequences might be if those numbers take a turn for the worse.
In other words, having performance data shared out in the open can potentially make some individuals feel uneasy. And we’re here today to say that’s okay.
Sometimes this unease might be tied to the fear that every sale, every piece of work, or every interaction with customers is being scrutinized, ready to be critiqued by a manager or a peer.
It could be about feeling exposed, vulnerable, and maybe unfairly judged.
It might be related to not knowing exactly how certain KPIs are calculated.
Sometimes it’s about feeling inferior to your peers when attention is drawn to certain metrics.
Pinpointing exactly what causes a sense of unease in a specific individual is personal, circumstantial, and goes way beyond the scope of this article.
But what we can do is acknowledge this can potentially be ‘a thing’, and make sure you, as an enthusiastic dashboard builder, can anticipate and mitigate any FOBT that might manifest itself when rolling your dashboards out.
How to overcome The FOBT
This might all sound alarming - after all, you’re (hopefully) not building dashboards to instill fear and anxiety in your team!
But don’t worry: with a little empathy and a few of the tactics outlined below, your team will embrace working with dashboards in ways you can only dream about.
Communicate clearly what your dashboard is about
As a manager, it might be obvious to you that tracking KPIs on highly visible dashboards is going to be useful - some might say, essential - for your team to perform at its best.
It’s about building a culture where your team owns great performance, and strives to improve. But for staff who haven’t worked in a data-driven team before, or who are early in their careers, the reasons why you’d want to share numbers in this way might be unclear.
Therefore, the single most impactful thing you can do is to clearly communicate to staff what the true intention behind your dashboard is. The earlier in the process the better (see the next point).
Your dashboards at the end of the day are there to help you and the team work towards something aspirational, whether that’s a sales target, better customer service, a quarterly objective, or simply having a stronger grasp of the KPIs your team are being held accountable for.
Make sure everyone understands this, whether that’s during a team meeting, regular 1-1s or as part of your team’s onboarding process. This will go a long way towards setting minds at ease, and opening up conversations about the metrics that could go on there.
Bring the team into the dashboard-building process
You might be familiar with the Agile methodology:
Plan, design, build, deploy, review user feedback.
It’s a tried-and-tested way to deliver products, services and software that matches the needs of end users. And it turns out it’s also an excellent way to eliminate The FOBT when rolling out dashboards.
Involving your ‘end users’ - i.e your team - early in the process of planning and building your dashboards ensures that their feedback can be taken into account before your dashboard is shared more widely.
Ultimately, doing this can not only squash any FOBT, but can actually help you arrive at a more useful, actionable dashboard that the team feels a sense of ownership over. One of Geckoboard’s long-term customers, Alejandro Pérez - CEO at Komet Sales - shares his approach to this:
“I took things a step further and got the team involved in the design process. I’d create a starting point for discussion by displaying a set of KPIs, put them in front of the relevant team for a period of time and encouraged them to question if those metrics were interesting to their day-to-day work.
Following that, I’d iterate based on the feedback. I wanted to awaken their curiosity by engaging them in conversations around the KPIs, and empower them with the decision to define what mattered. This level of ownership engaged them with the metrics, but also ensured everybody really understood what the numbers and abbreviations in front of them meant.”
Using this approach, starting with a ‘prototype’ of a dashboard and actively soliciting feedback from your team, everyone on the team can feel like they’re part of the process.
Give context, and control access if needed
Sometimes teams can be reticent to visualize performance data – not because they're scared of it being tracked by others - but rather because the KPI itself can be taken out of context and misunderstood. Especially by members of different teams who don't understand how the metric behaves.
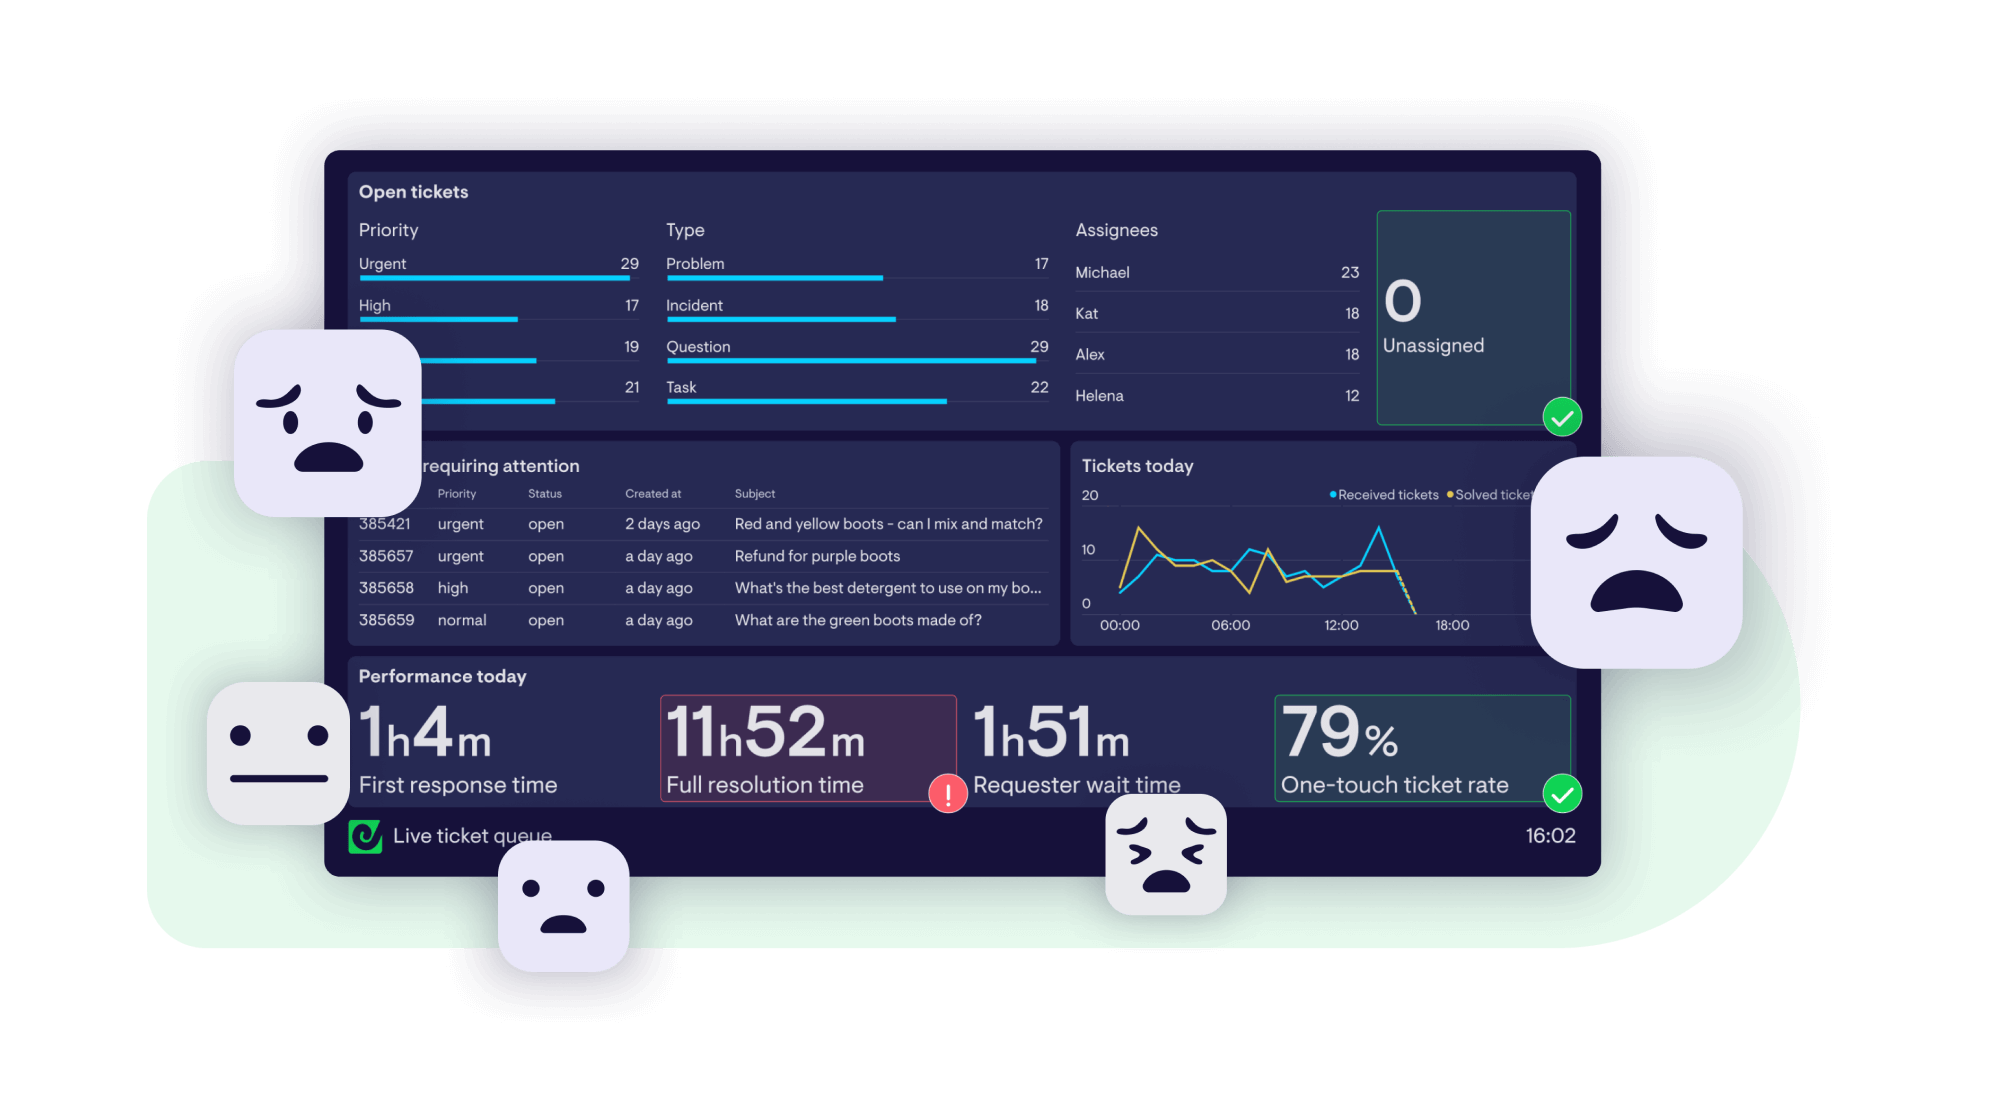
Take a metric like First Response Time, for example - one of the most commonly tracked Customer Support metrics. Most Customer Service professionals know FRT has a natural variance. It can move quite a lot throughout the day, without any real cause for concern.
Not everyone understands this however. And so you may want to limit the possibility of KPIs (especially real-time KPIs) being misinterpreted, by keeping your dashboards within the team.
Great news – with Geckoboard it's possible to control access to your dashboards. This can help to allay any fears that your team's dashboard might paint an inaccurate picture.
Keep the conversation going
Done well, dashboarding is an ongoing process. Goals change. KPIs change. Your dashboard should evolve with these.
Your team will also change, and it’s never a bad idea to check in with everyone from time to time to see how they’re feeling about the metrics currently on the board. New team members may also benefit from a walkthrough of what’s on there during their onboarding.
The main point here is: once you’ve shared your dashboard and everyone’s happy, the process isn’t over. A little ongoing effort to keep everyone up to speed and comfortable with what’s on there never goes amiss.
Start being more data-driven today
Ready to start rolling dashboards out for your team? Sign up for a free 14 day trial of Geckoboard and create custom dashboards in minutes, or check out these other blog posts:
