Geckoboard shines a light on hidden data at Periculo
See how Periculo used Geckoboard to make hidden business data visible, boosting sales forecasting, marketing ROI, and team performance with real-time dashboards....
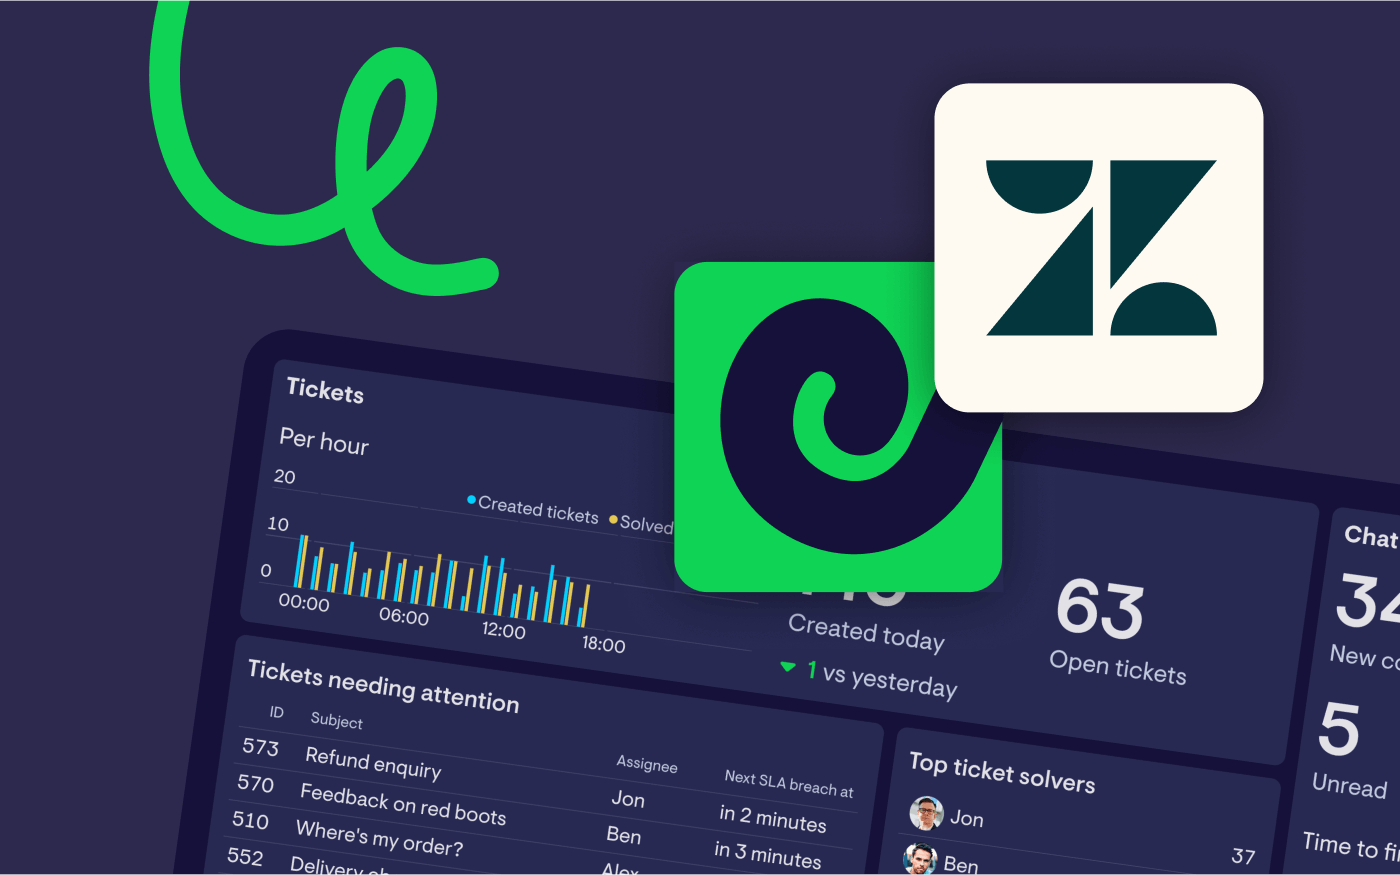
Geckoboard is the easiest way to make key information visible for your team.
Learn how