If you’re a manager using Aircall to power your call center operation, you’ll be no stranger to data.
Between Aircall’s own live view of the queue, call Analytics and Analytics+ , there are a whole host of ways to analyse the performance of your sales or support team natively in Aircall.
But chances are Aircall data isn't the only data you might need to monitor day-to-day.
If you’re running front line support, your ticketing or chat software holds rich data around how effectively your team are processing customer queries.
If you’re in sales, CRMs or similar systems will contain pipeline health data and productivity metrics which your team are accountable for.
And then there’s the whole lot of other systems, tools and spreadsheets you probably interact with on a less frequent basis that contain important KPIs you need to be aware of.
All this data is incredibly valuable, but also incredibly impractical to monitor closely if you and your team want to focus on your queue, rather than several browser tabs full of various data visualizations and reports.
Luckily there is a solution for this, and that’s to use Geckoboard - our own dashboard creation software - to create custom dashboards that give your team a single view of not only Aircall queue metrics, but also important KPIs from other systems. No juggling browser tabs, no hitting refresh, no exporting data into Excel; just a live dashboard providing the data your team needs to do their job effectively.
In this article we'll take a look at five different data sources you can combine with Aircall data to create the perfect KPI dashboard for your team using Geckoboard.
Jump to a section
- How to build a real-time Aircall dashboard with Geckoboard
- Add chat and ticket data from Zendesk
- Add HubSpot sales data
- Add Salesforce report data
- Add Shopify order data
- Add anything else using Zapier
How to build a real-time Aircall dashboard with Geckoboard
Before we jump into other data sources you can add alongside Aircall, it’s worth quickly recapping how you can build out a basic Aircall dashboard using Geckoboard. We’ve written a separate article covering this in more detail, but in summary:
- Sign up to Geckoboard for free and select the Aircall integration
- Connect Geckoboard to your Aircall account to start pulling data through
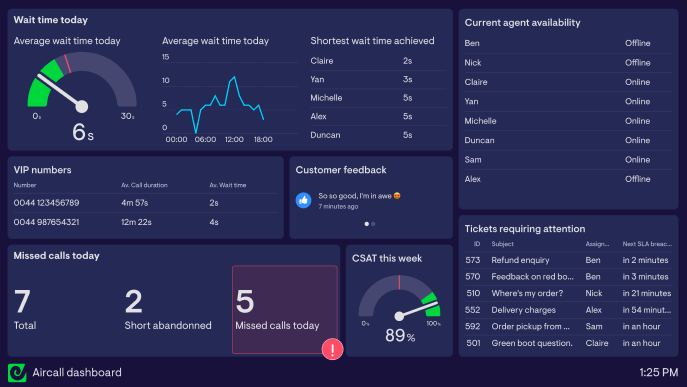
- Add popular metrics to your dashboard like calls waiting, average wait time and agent availability
- Apply filters to get precise performance data for specific teams, numbers or users
- Share your finished dashboard by copy/pasting a link, scheduling snapshots via email or Slack or displaying it on large screens or TVs in your call center.
Following these steps it’s absolutely possible to build a custom Aircall dashboard in as little as 15 minutes.
With your basic Aircall dashboard built out, it’s time to customize it further with data from your other tools…
Add ticket and chat data from Zendesk
If you’re using Aircall as part of a customer service operation, Zendesk needs no introduction. It’s the go-to ticketing and omnichannel platform for many thousands of businesses around the world.
It’s also the tool that has one of, if not the biggest number of Aircall customers on this list, and is one of Geckoboard’s most comprehensive integrations, making this an obvious place to start.
Geckoboard’s Zendesk integration supports all the channels you might want to monitor on an Aircall dashboard, covering Zendesk Support, Chat, Talk and Sell, making it possible to build comprehensive customer service dashboards containing data from across all your channels in one place.
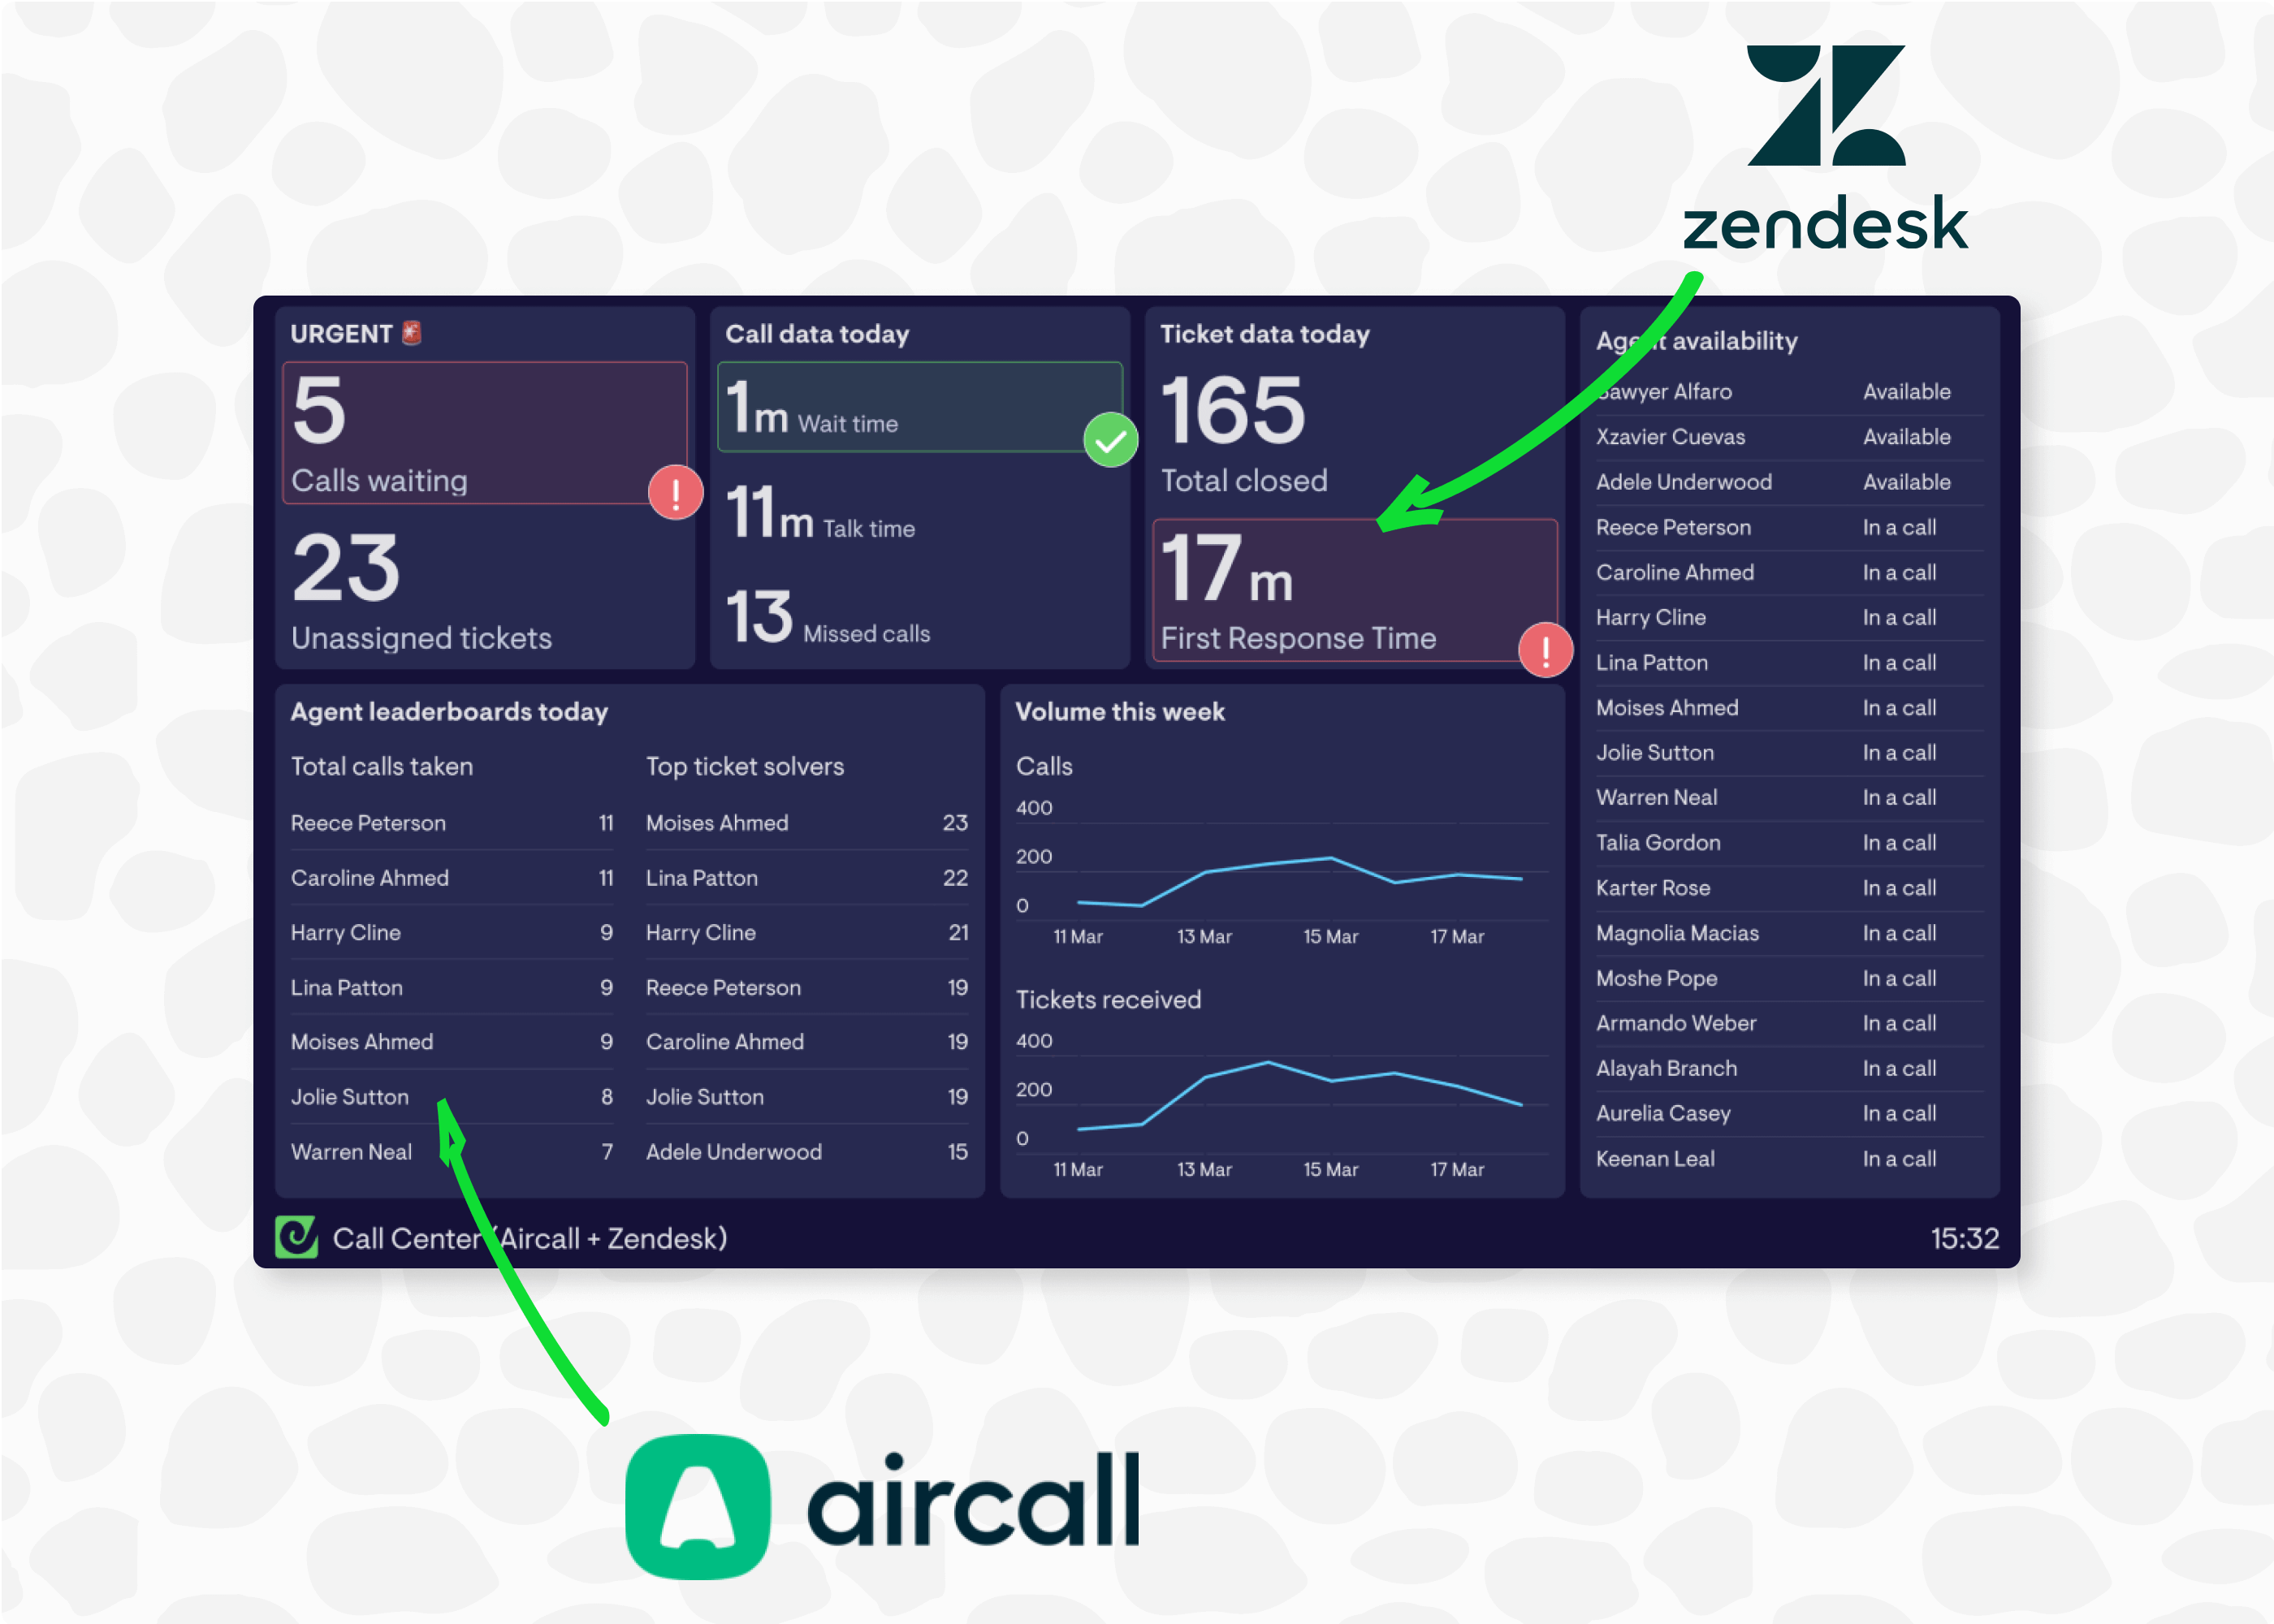
Popular Zendesk metrics to add alongside Aircall include:
- Tickets closed today
- Unassigned tickets
- Top ticket solvers
- Chats waiting and chats currently served
- Average first response time
- Agent status
Using Geckoboard to monitor live agent status gets particularly interesting if you’re using Aircall to power your phone operation alongside Zendesk for chat and/or email tickets. Using Aircall’s Aircall-Zendesk Agent Status Sync integration, agent status in Aircall can sync directly with Zendesk’s own agent status, giving you a single view of your team’s current status and workload across both tools, and all channels. Handy.
Read more about how to integrate Aircall and Zendesk data.
Not using Zendesk? Geckoboard also allows you to view customer service KPIs from Intercom, Gorgias, Freshdesk, Help Scout and Freshservice too.
Add HubSpot data to your Aircall dashboard
Next on our list is HubSpot. With over 194,000 customers, spanning marketing, sales, support and operations, HubSpot complements Aicall nicely as a robust platform for managing leads as well as support tickets.
Geckoboard’s HubSpot integration currently supports visualizing data from HubSpot’s Sales Hub, making it a powerful addition to your dashboards if you’re using Aircall in a Sales or outbound context.
Some of the most popular HubSpot data to add alongside Aircall metrics includes:
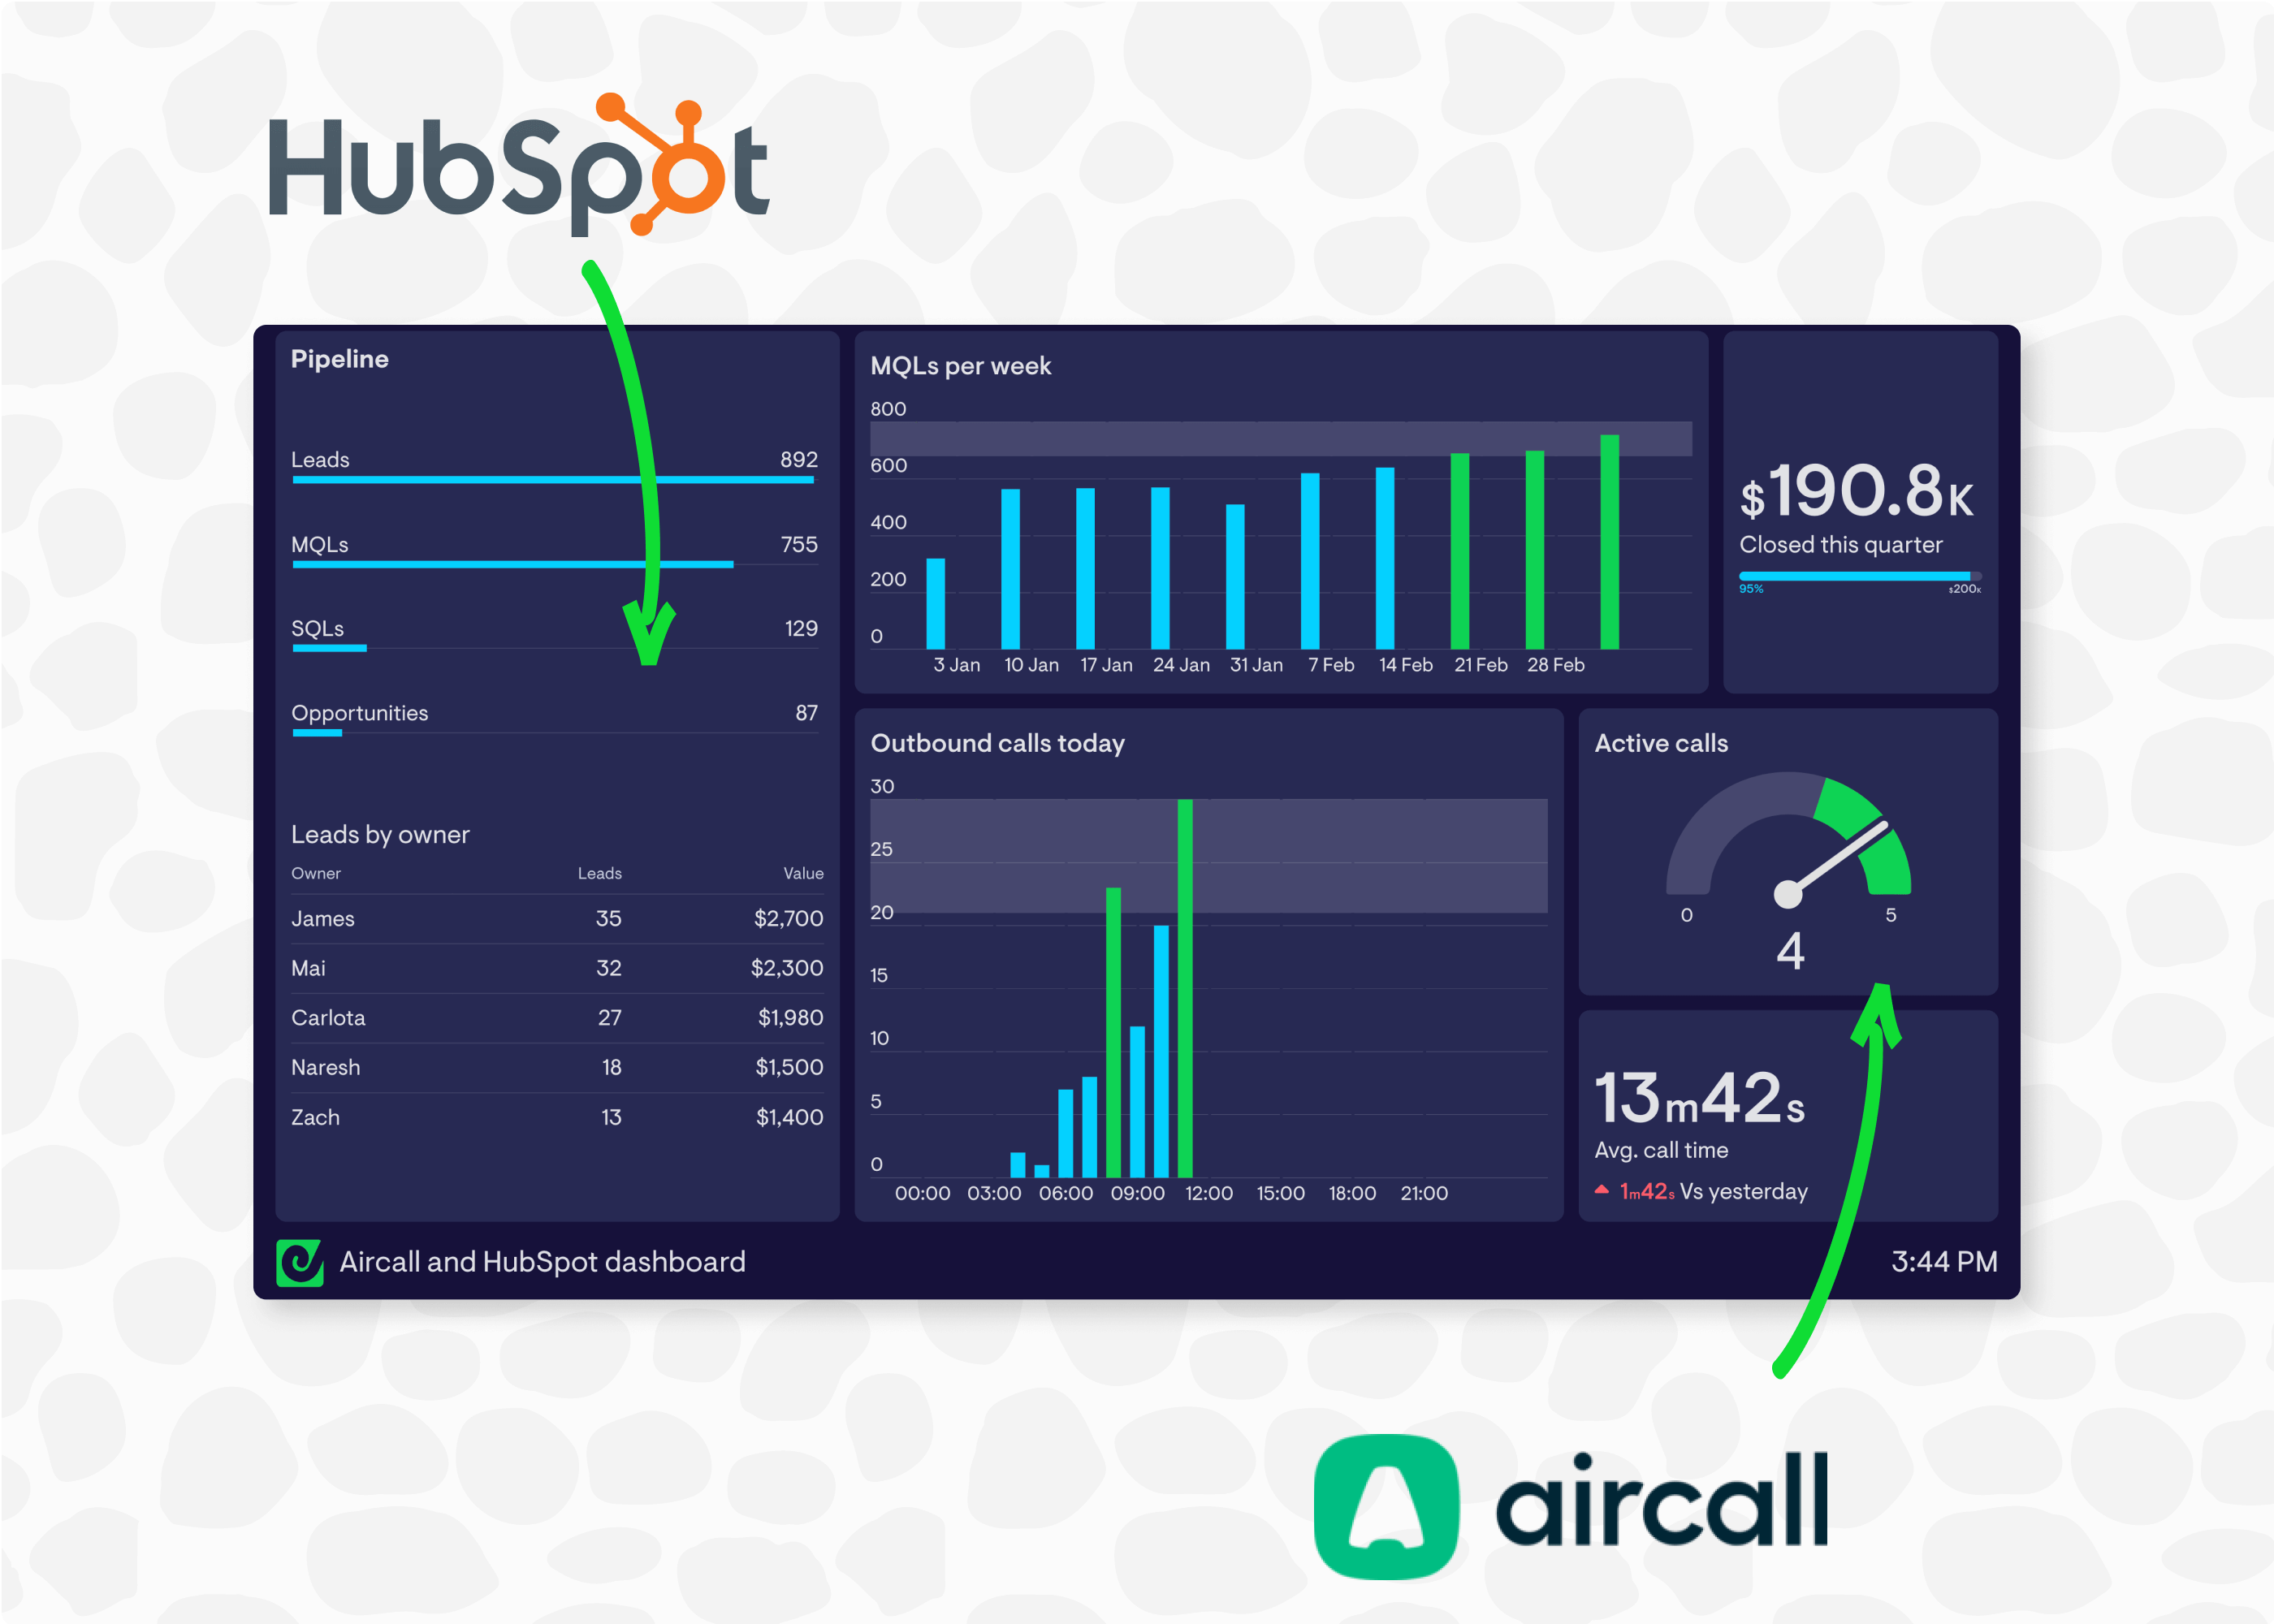
- Pipeline by deal stage (leads, MQLs, SQLs and opportunities generated)
- The number of deals closed, and their value
- Average deal size
- A feed of recently closed deals
- Number of unassigned leads
Like our Zendesk integration, adding live KPIs from Hubspot to your Aircall dashboard is easy even inf you’re not a developer. Just select HubSpot integration, set up a connection, and pick the metrics you want to monitor.
If you’re not using HubSpot as your core sales CRM, you can achieve similar results using Geckoboard’s integrations with Pipedrive, Zendesk Sell, Close.com and Salesforce.
Add Salesforce data to your Aircall dashboard
Salesforce is another hugely popular Geckoboard integration that’s virtually essential if you’re using Aircall and Salesforce together.
Geckoboard’s Salesforce integration works a little differently to the other data sources mentioned in this article, in that it allows Salesforce users to connect reports they’ve already built in Salesforce, and visualize metrics directly from those (rather than a pre-configured set of metrics). This opens up a huge range of possibilities - if you can add or compute a metric to a Salesforce report, you can visualize it in Geckoboard.
Read more on how to connect Salesforce to Geckoboard and visualize Salesforce data alongside Aircall.
Add Shopify data to your Aircall dashboard
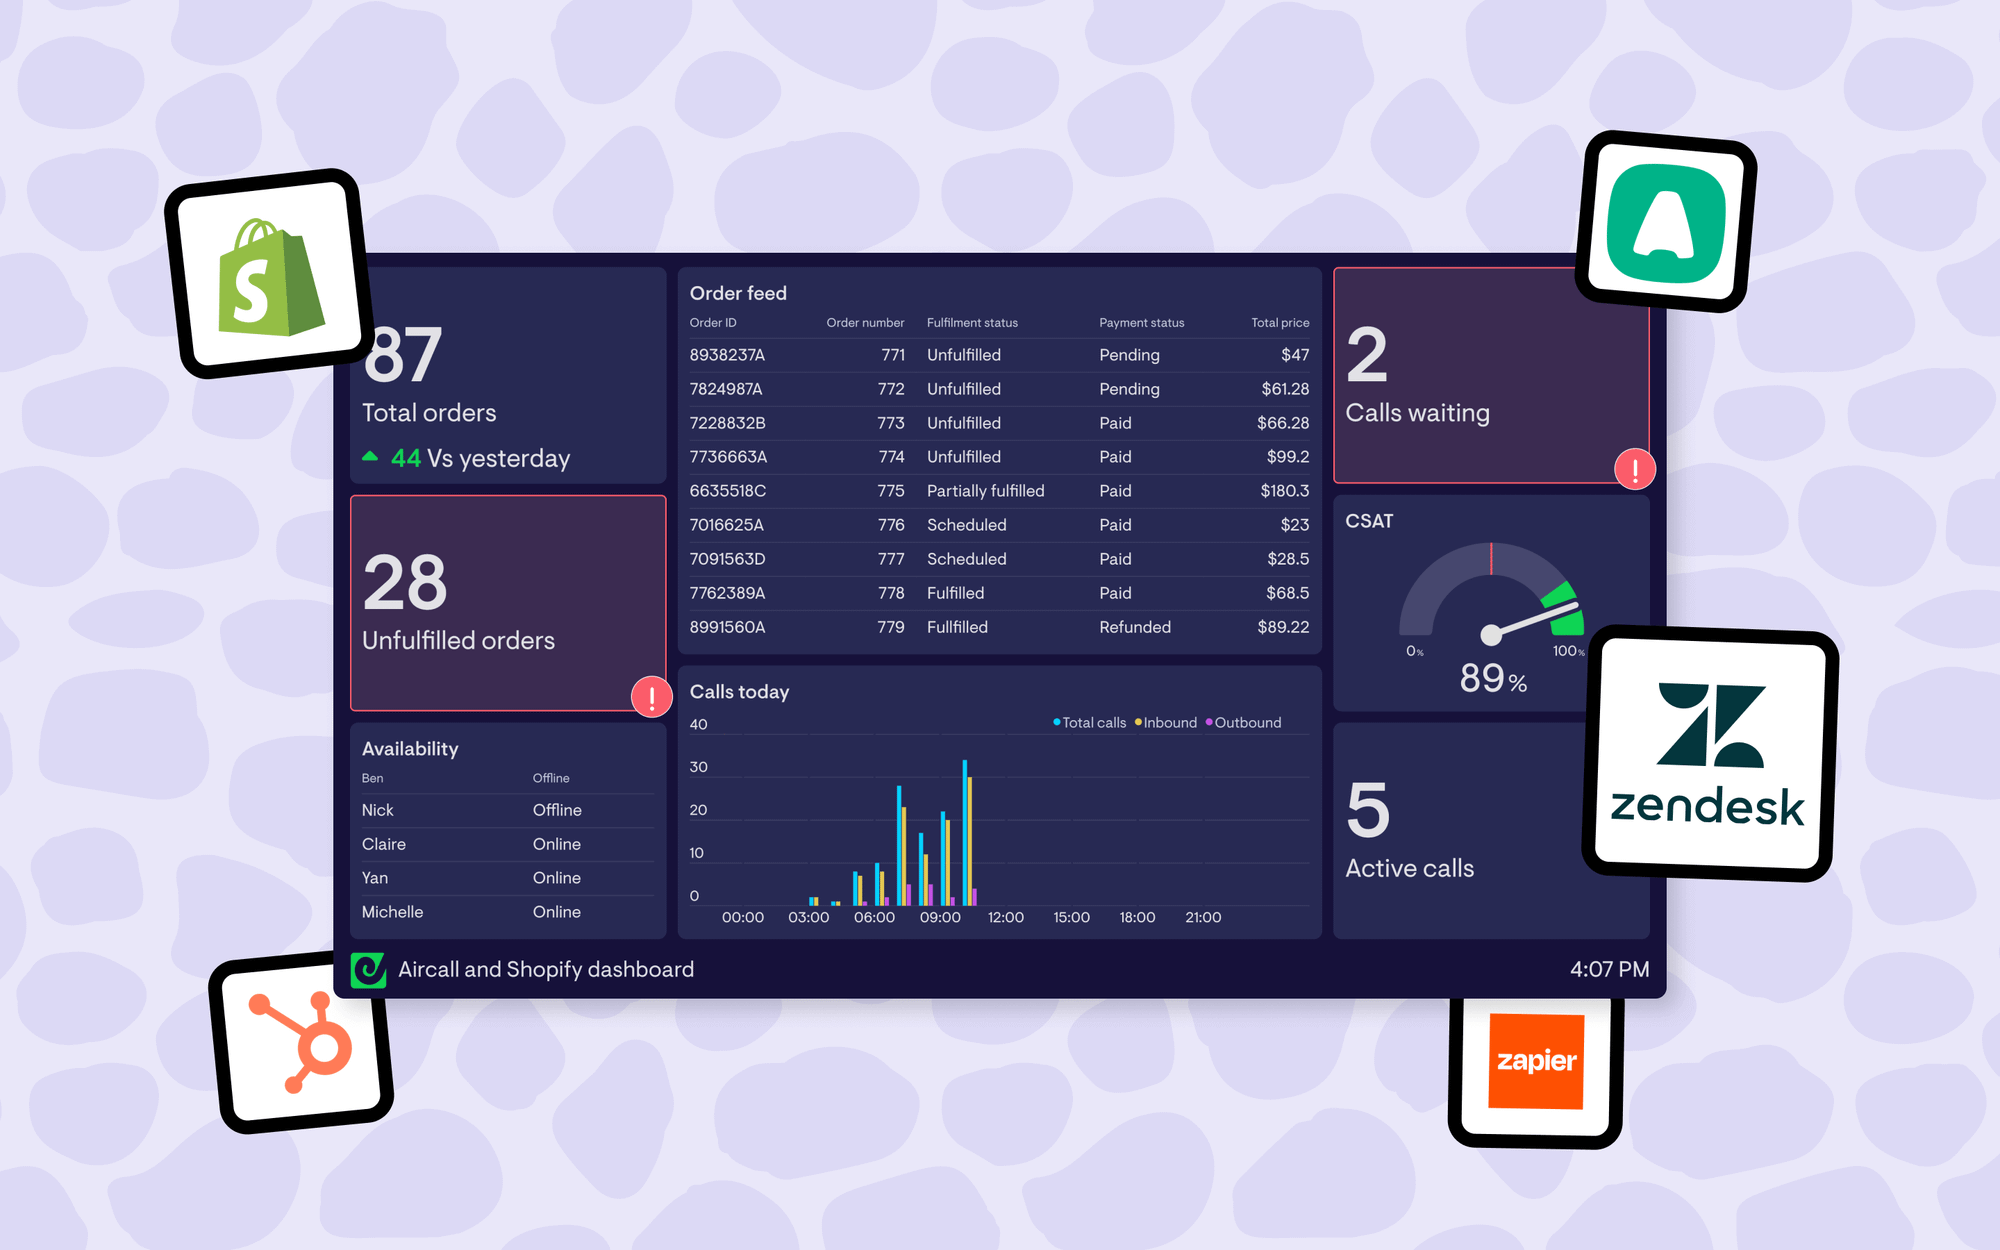
If your ecommerce operation relies on Shopify then Geckoboard’s Shopify integration is a powerful addition to any Aircall dashboard you build. It supports a range of metrics from Shopify - such as gross sales, best selling products and average order value - all of which can be filtered in a variety of ways.
For busy front line customer service teams, probably the most useful Shopify data to see is anything that can help them get a heads up on any potential bottlenecks or fulfilment delays.
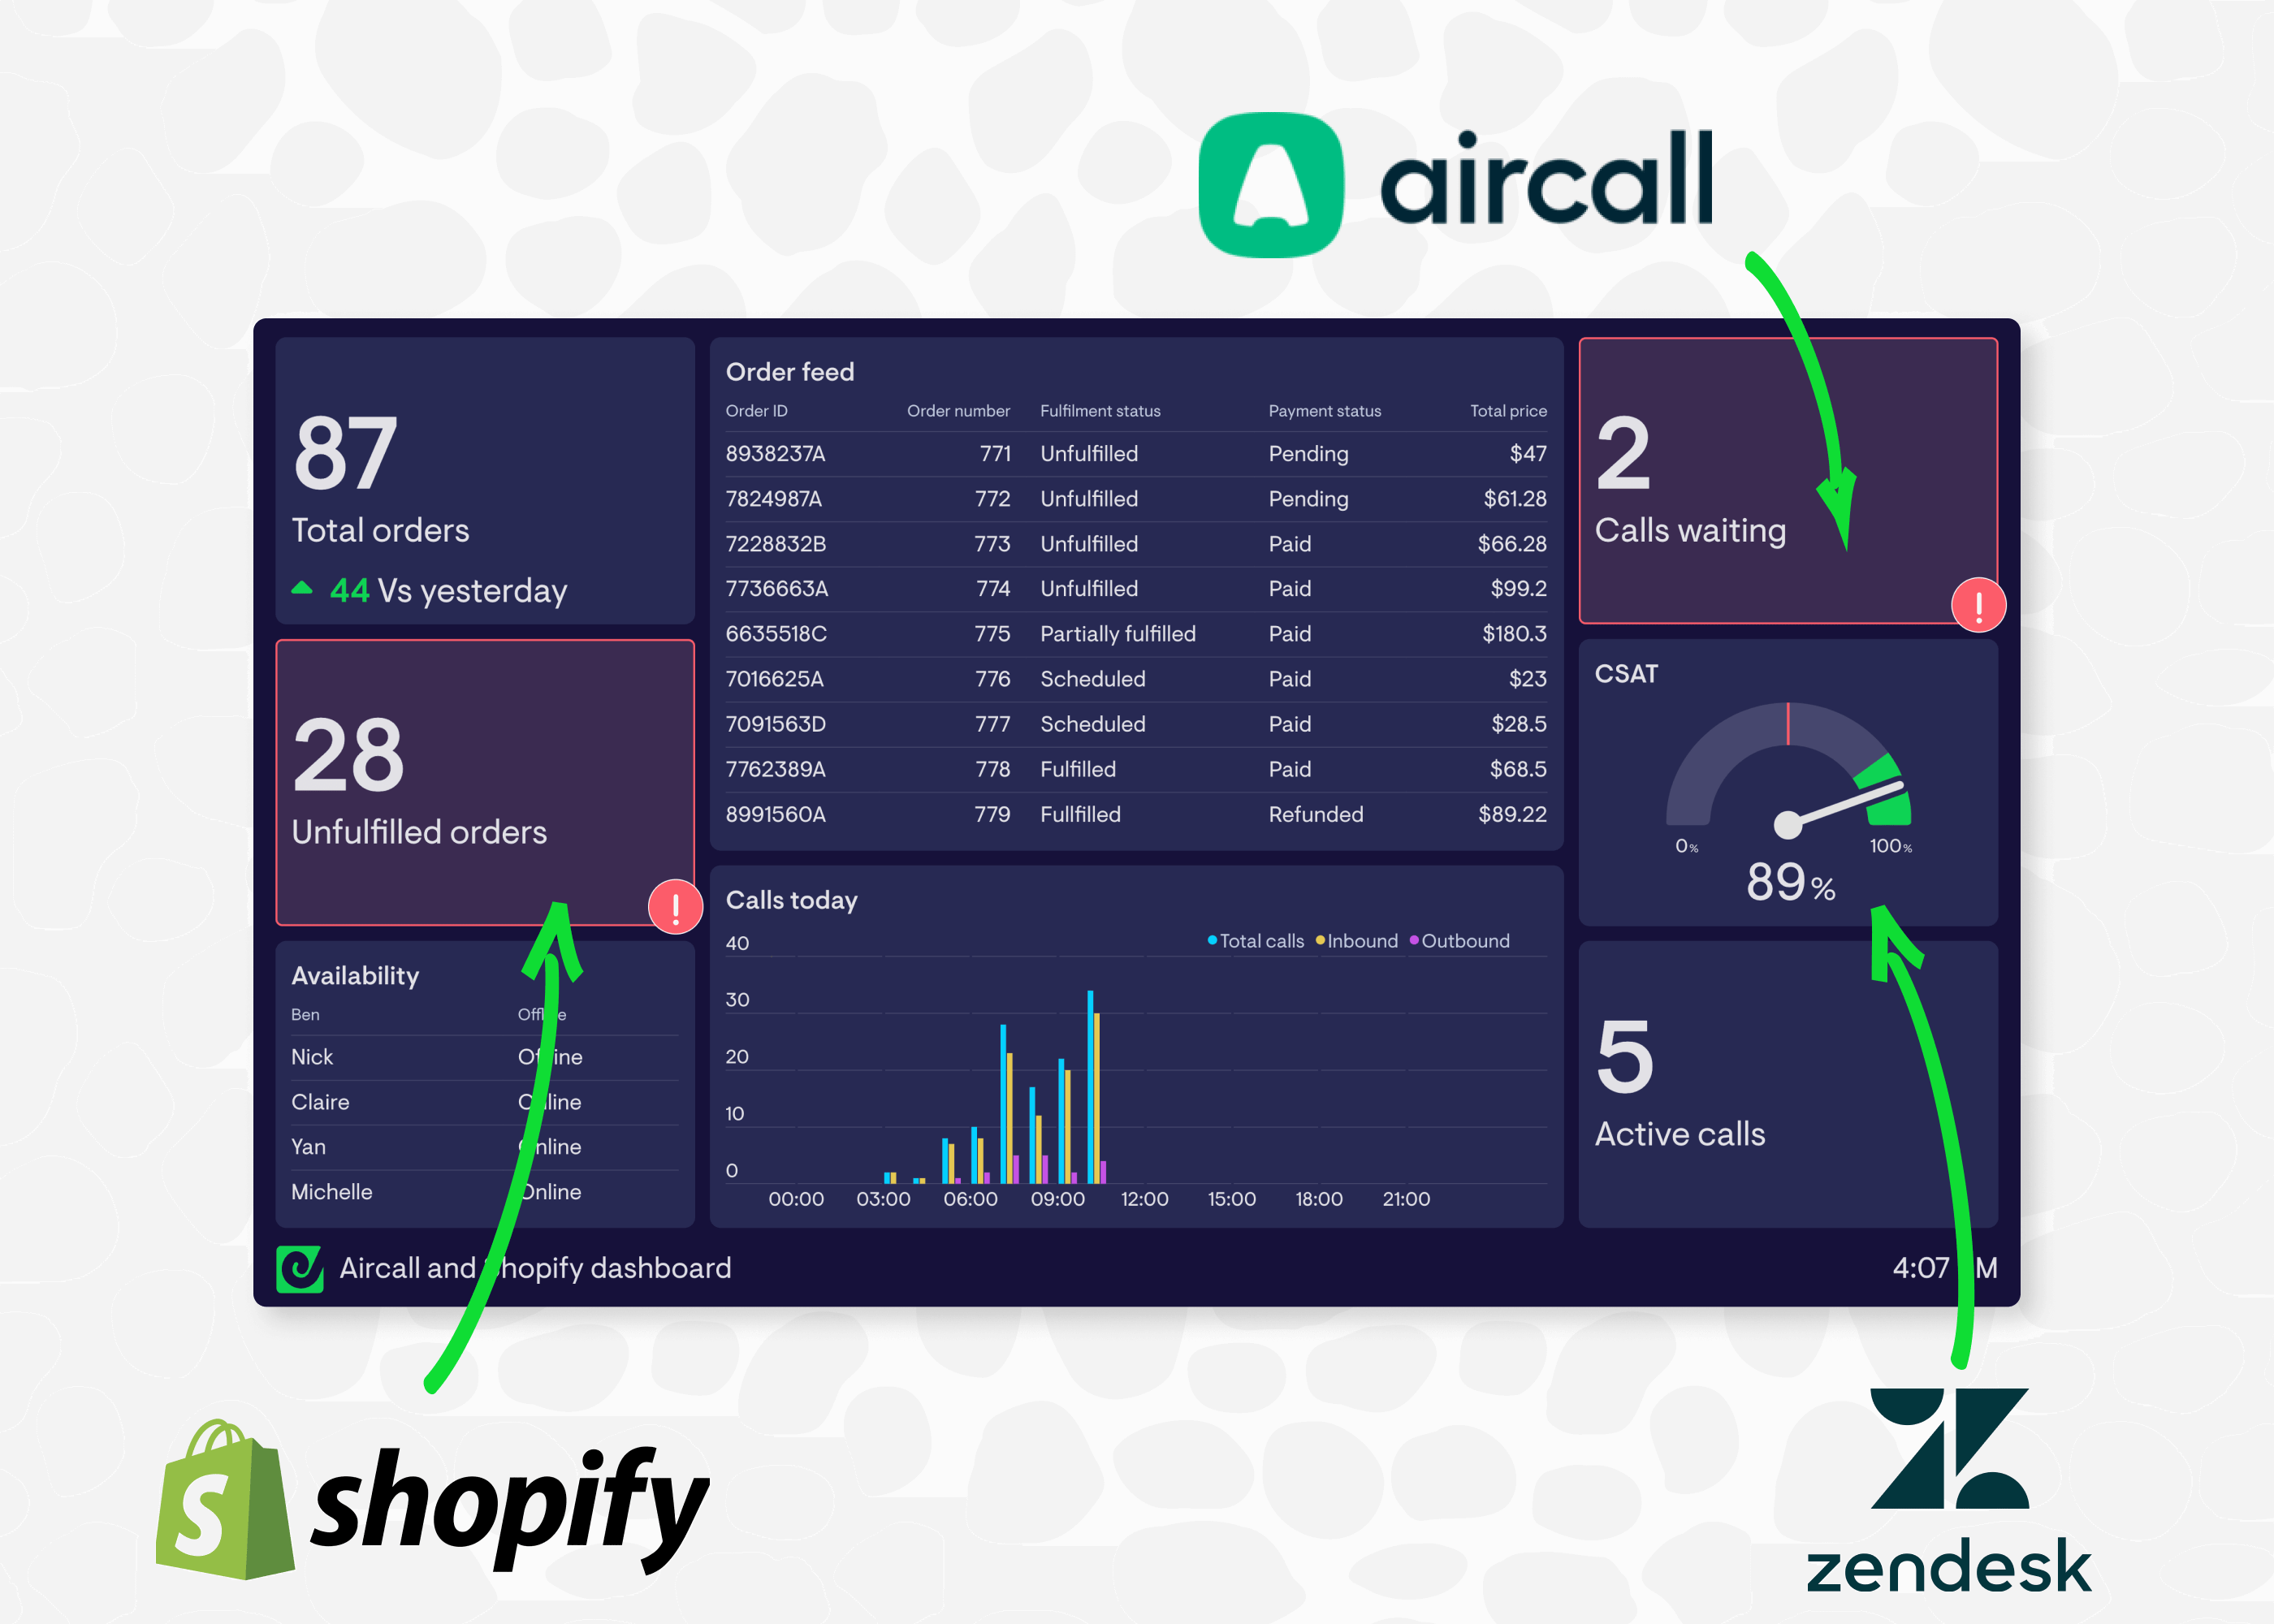
In the example above, total orders indicates whether things are ‘normal’ or particularly busy, which might result in shipping delays.
Unfulfilled orders shows whether the warehouse or fulfillment team are keeping pace with demand. This can also be broken out to list specific orders, so support agents can see at a glance which orders are yet to ship.
The order feed gives agents a quick way to see which customer might need contacting to complete payment successfully.
Geckoboard supports several other data sources that ecommerce businesses might want to leverage, including Google Analytics, spreadsheets, and SQL databases.
Add data via Zapier to your Aircall dashboard
Geckoboard integrates with over 90 different sources, and although we’re adding to that list all the time, this still doesn’t cover the full range of tools sales and support teams use. Which is one of the reasons we’ve built an integration with Zapier.
Zapier gives non-developers an easy way to automate workflows and data synchronization between 6000+ different tools and applications, and that includes Geckoboard. This means if you’ve got important KPIs or data sitting in other tools that you’d like to see next to data from Aircall, there’s normally a quick workaround.
Incidentally, if you are a developer or need highly customized KPIs on your Aircall dashboard, Geckoboard has an API that lets you visualize rich datasets in Geckoboard, which you can read more about here.
If this article has parked some ideas and you want to try any of these combinations yourself, log in or sign up to Geckoboard, select the data source you’re interested in and follow the instructions to set up a connection.
