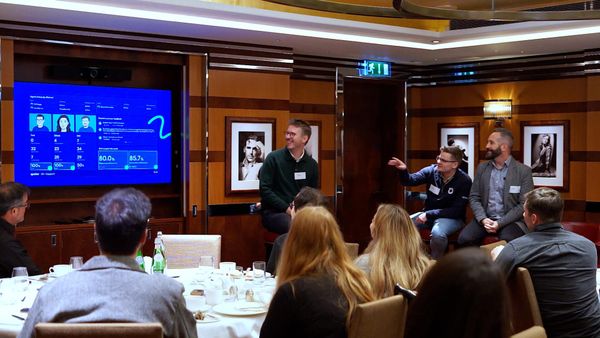
Geckoboard Breakfast: Measuring What Matters in Support, 2026
Key takeaways from our Geckoboard Breakfast event, including how leading teams use real time dashboards, measure AI performance and rethink reporting for 2026....
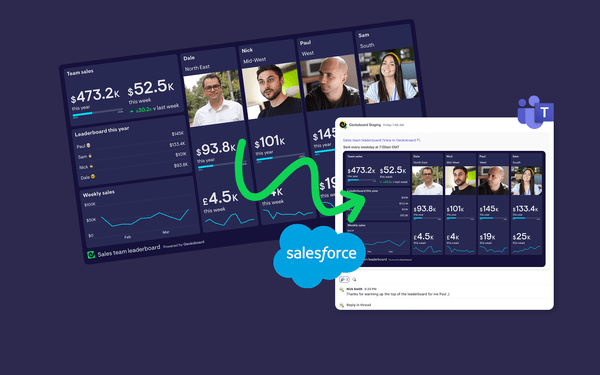
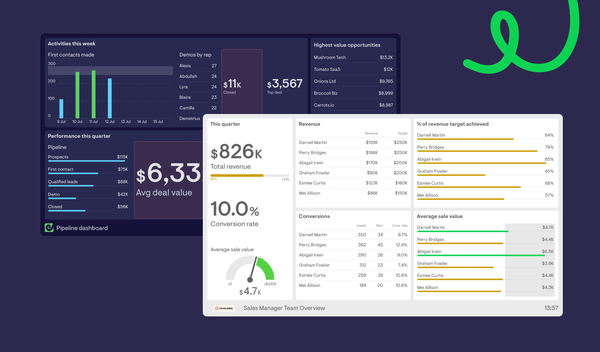
Geckoboard is the easiest way to make key information visible for your team.
Learn how