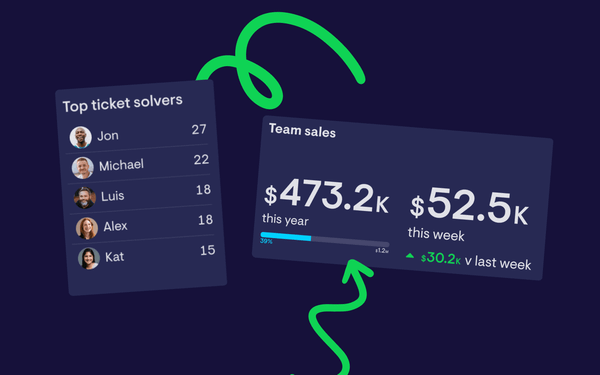
Gamification for Support and Sales teams: what works (and what doesn’t) by Nick Smith 22 January 2026
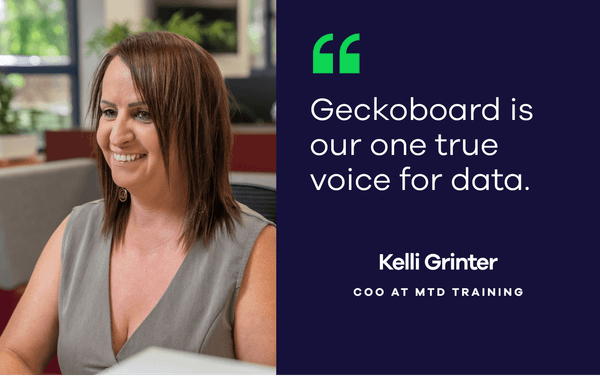
How MTD Training brought hidden data into the open and shifted their culture by Sam Gane 11 December 2025
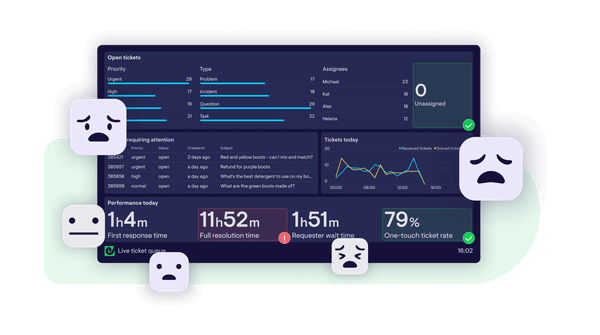
The Fear Of Being Tracked (FOBT): navigating dashboard anxiety in your team by Nick Smith 6 October 2023
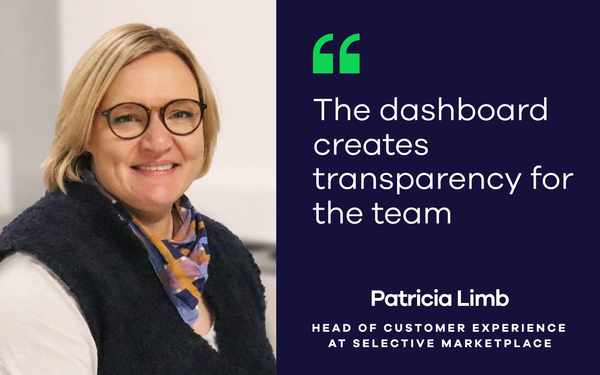
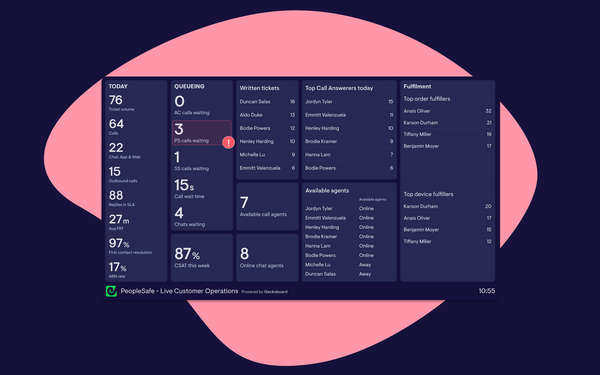
The Customer Ops dashboard that motivates agents and saves valuable time for PeopleSafe by Sam Gane 22 March 2023
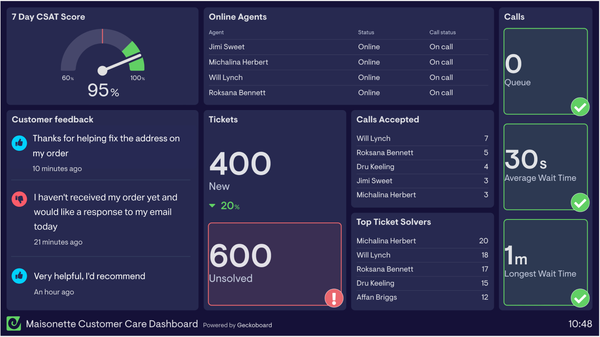
From consultant to Dir. of Customer Care at Maisonette: How Geckoboard helps Logan Grooms supercharge support teams by Sam Gane 29 October 2020
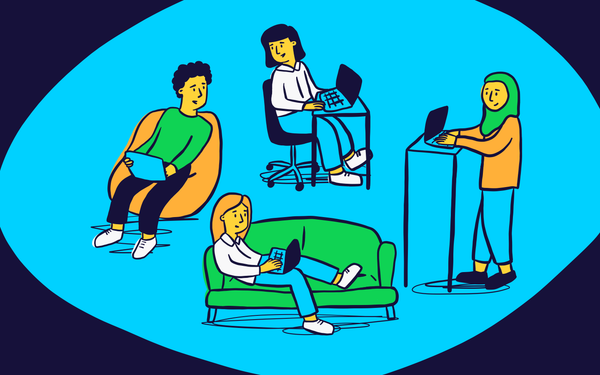
How 4 companies foster remote teamwork and collaboration with Geckoboard by Team Geckoboard 28 October 2020