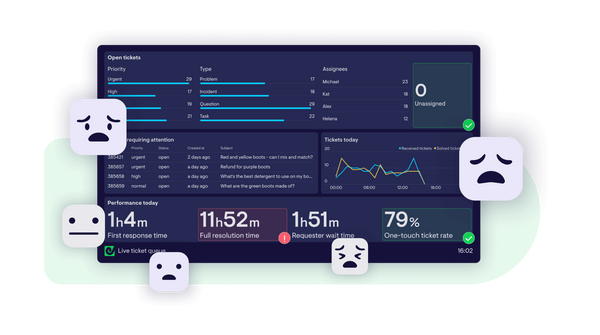
The Fear Of Being Tracked (FOBT): navigating dashboard anxiety in your team by Nick Smith 6 October 2023
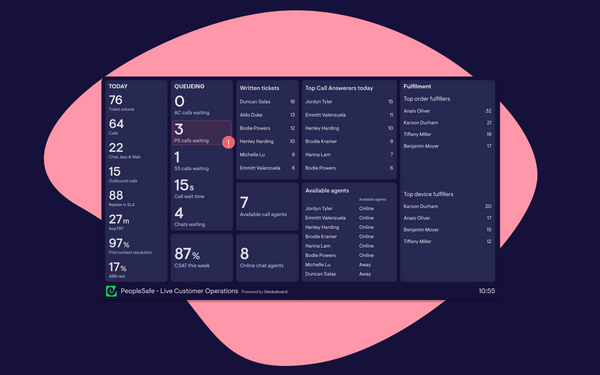
The Customer Ops dashboard that motivates agents and saves valuable time for PeopleSafe by Sam Gane 22 March 2023
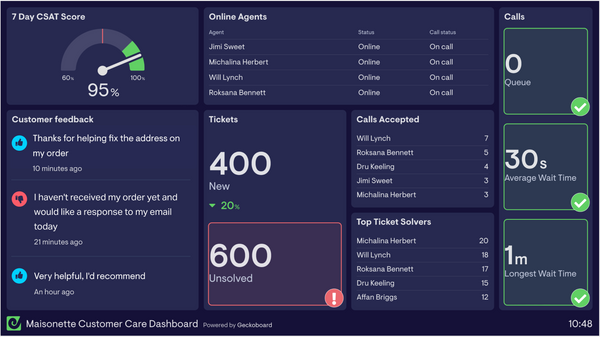
From consultant to Dir. of Customer Care at Maisonette: How Geckoboard helps Logan Grooms supercharge support teams by Sam Gane 29 October 2020
How 4 companies foster remote teamwork and collaboration with Geckoboard by Team Geckoboard 28 October 2020
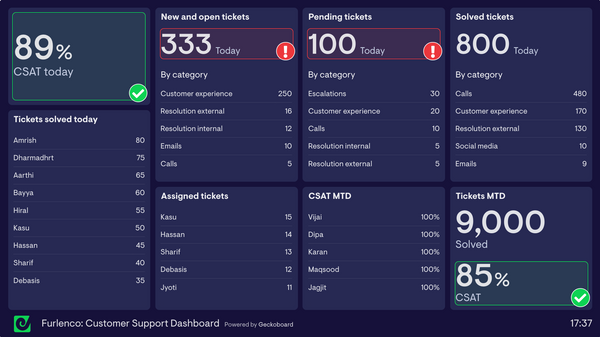
How Geckoboard dashboards help India’s largest online furniture rental company deliver incredible customer service by Sam Gane 4 September 2020