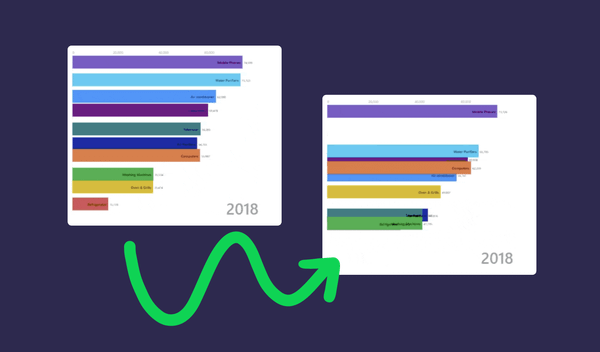
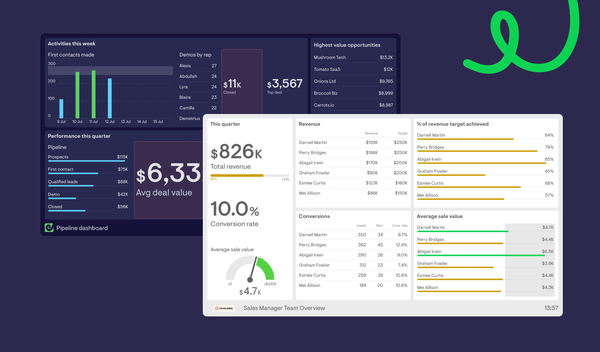
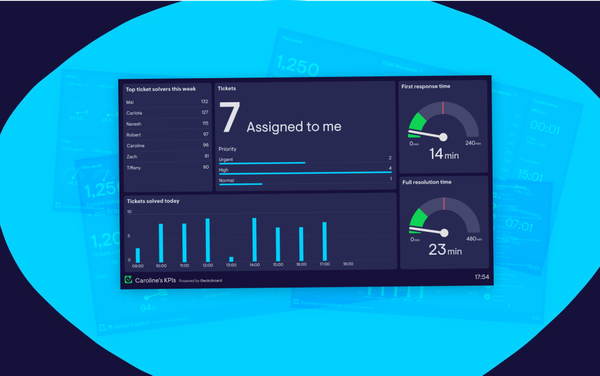
If you have ever worked with Shopify, you know it collects data on dozens of ecommerce metrics at any given time. You can track the number of sales, order values, sales by location, and more.

The sheer number of key performance indicators (KPIs) and ways to display them can be overwhelming. How do sellers keep their most important metrics from getting lost in the day-to-day shuffle? By building a Shopify dashboard.

Geckoboard’s Shopify integration makes it easy to keep your vital metrics top-of-mind for your ecommerce team. We talked to Adventure Cats co-founder Laura Moss to get the inside scoop on how she sets up her pet supply store’s Shopify dashboard with our integration.

With Laura’s input, we created a list of five dashboard design best practices to help ecommerce businesses align their teams and keep an eye on their top KPIs.

1. Include multiple visualization techniques

The main goal of a Shopify dashboard is to make your most essential metrics easy to find and read at a glance. Using a variety of different data visualization techniques can help you present the information in a way that stands out. Team members scanning the dashboard can immediately find the metrics they’re looking for.

Adventure Cats uses a different visualization depending on the metric it is displaying in its dashboard. For example, a gauge shows how close the company’s ecommerce team is to their goal for average order value (AOV), while a line graph helps them track the change in sales over time.

Gauge and line graphs on the Adventure Cats dashboard

Geckoboard offers several different visualizations to choose from, including line graphs, column charts, and gauges, so you can select the visualization that best displays each metric.

GIF of how to change visualizations in Geckoboard
You can change the visualization for each metric as you add it to the dashboard.

Keep in mind that you don’t want to crowd your dashboard with unnecessary graphs and charts. Choose the key data you want displayed on your dashboard, and then decide on the best visualization for that data type.

To learn more about the different types of data visualization and when to use them, check out 6 Data visualization techniques to display your key metrics.

2. Set status indicators and goals

A well-designed dashboard should do more than just display the current status of each key performance indicator. It should help motivate your team by showing how close they are to their goals and highlighting problem areas that need attention.

You can achieve this with your Shopify dashboard by setting goals and status indicators for individual metrics to place your KPIs in context. Your team can see at a glance how close they are to meeting their objective for each metric and whether they are on track.

One common way to display goals is with a progress bar. Below, you can see how Adventure Cats uses a progress bar to highlight how close the team is to meeting their weekly sales goal.

Progress bar screenshot

You can also set goals as a highlighted section on line graphs to immediately see how often your team is meeting their objective. If lines consistently fall below the goal threshold, it could indicate a long-term problem rather than just a bad day or week.

Line graph with goal appearing as a highlighted section
Goals appear on line graphs as a highlighted section.

Status indicators highlight whether your team is on track with a metric or if there is a problem. They display a red “warning” exclamation point if the metric is performing poorly and a green “success” checkmark if it is doing well. You can set different warning and success thresholds for each metric.

GIF of how to change status indicators
[Image source]

You can see a few status indicators on the Adventure Cats dashboard. There are both warning and success indicators on the average order value gauge to indicate the undesirable low threshold and the company’s target AOV.

Screenshot of warning indicator on Shopify dashboard

There is also a warning indicator on the daily sales metric, letting team members know if the daily sales are zero.

3. Group similar metrics together

Your ecommerce metrics’ position on your dashboard affects readability. Group related KPIs in the same box or section of your Shopify dashboard. When a team member looks at the board, they will be able to quickly see all the information related to the metric in question.

Adventure Cats, for example, displays average order value for the week and the past 30 days. The company puts both metrics in the same box, using a gauge for one and a line chart for the other.

AOV on Adventure Cats Shopify dashboard

Grouping variations of the same KPI into one box also enables you to remove redundant labels. Instead of having multiple graphs labeled “average order value,” Adventure Cats only needs to name the metric once. Removing redundancies helps keep the board uncluttered and free of unnecessary text.

Put similar metrics in the same area of the dashboard, even if they aren’t closely related enough to go under a single header. You might group sales metrics in one corner, for example, and website information in another. Or, If you have metrics for multiple teams on a single dashboard, you could group each team’s information together.

In the example dashboard below, Geckoboard grouped financial metrics along the bottom of the dashboard and website information along the top.

Example ecommerce dashboard
Contains sample data

Remember to keep your dashboard simple. It only needs to display your most important metrics. If you crowd the limited space by adding too much information, even grouping similar metrics together won’t improve the dashboard’s readability.

4. Make your key metrics bigger

Some metrics that you select for your dashboard are likely more critical than others. People’s eyes are typically drawn to the largest or most prominent object first, so make your top metrics larger to emphasize their importance to your team.

On the Adventure Cats dashboard, dollar sales and number of orders are two of its core KPIs. To keep them top-of-mind and visible for its team, the company made the displays for these metrics larger than its less-vital metrics, like sales by location.

Adventure Cats Shopify dashboard

Notice that Adventure Cats puts its core metrics on the left-hand side. In English (and many other languages), we read from left to right. If your employees read in this direction, placing your top KPIs on the left of your dashboard increases the likelihood that viewers will look at those first, especially if they are also the largest displays.

5. Don’t be afraid to customize

Use customization features to create a unique dashboard display that matches your company’s colors and themes. With Geckoboard, you can upload your logo and branded colors or themes so that your dashboard matches the carefully-crafted aesthetic of your company.

Adventure Cats customized its dashboard with its logo colors. Now the team can see their metrics displayed in a way that matches the branding they are familiar with.

Geckoboard logo and theme customization screen
Geckoboard logo and theme customization

You might also customize your dashboards based on their associated team or project, so it’s easy to distinguish between each one.

Customization isn’t limited to color coordination. If you want to track metrics that aren’t included in the pre-built dashboards, you can use the “build-your-own” option to create a custom display.

Geckoboard custom metric setup

Create a custom dashboard to ensure your dashboard fits your company aesthetic and displays the metrics your team needs to track most at any given time.

Share your Shopify dashboard with your team

Now that you’ve built, customized, and optimized your Shopify dashboard, it’s time to share it with your team. If you work in an office setting, connect it to a TV or computer monitor so that it’s always on display for easy reference. Your group can quickly check their top metrics without having to look them up in Shopify.

If you have a distributed team, set a schedule to send regular dashboard snapshots to Slack. Or, share your dashboard using a sharing link. You can even use sharing links to send your dashboard to outside consultants or business partners. For example, you might share your finances dashboard with an external accountant.

Ready to set up your own Shopify dashboard? Get started with a free trial today!