In a world where data really matters, we all want to create effective charts. But data visualization is rarely taught in schools, or covered in on-the-job training. Most of us learn as we go along, and therefore we often make choices or mistakes that confuse and disorient our audience.
From overcomplicating or overdressing our charts, to conveying an entirely inaccurate message, there are common design pitfalls that can easily be avoided. We’ve put together these pointers to help you create simpler charts that effectively get across the meaning of your data.
Present facts
"Most people will believe whatever you tell them as long as a chart is involved," researchers found in a 2014 study "Blinded with science". Given the persuasive power of charts, it’s important we use them correctly and put our audience’s best interests at the heart of our design. There are many different ways a chart can accidentally communicate the wrong message, distort the truth, or make the data difficult, if not impossible, to decipher and consume quickly.
“Many charts have sophisticated and intelligent underlying information, but their presentation fails to convey the intended message”
Dona M. Wong, Data visualization expert
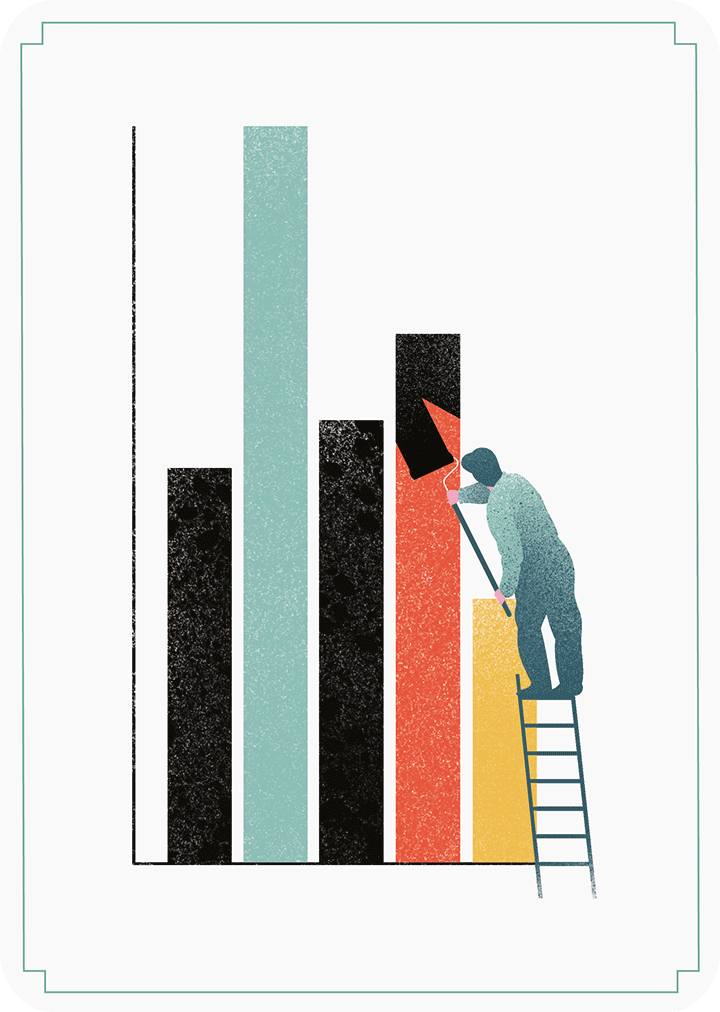
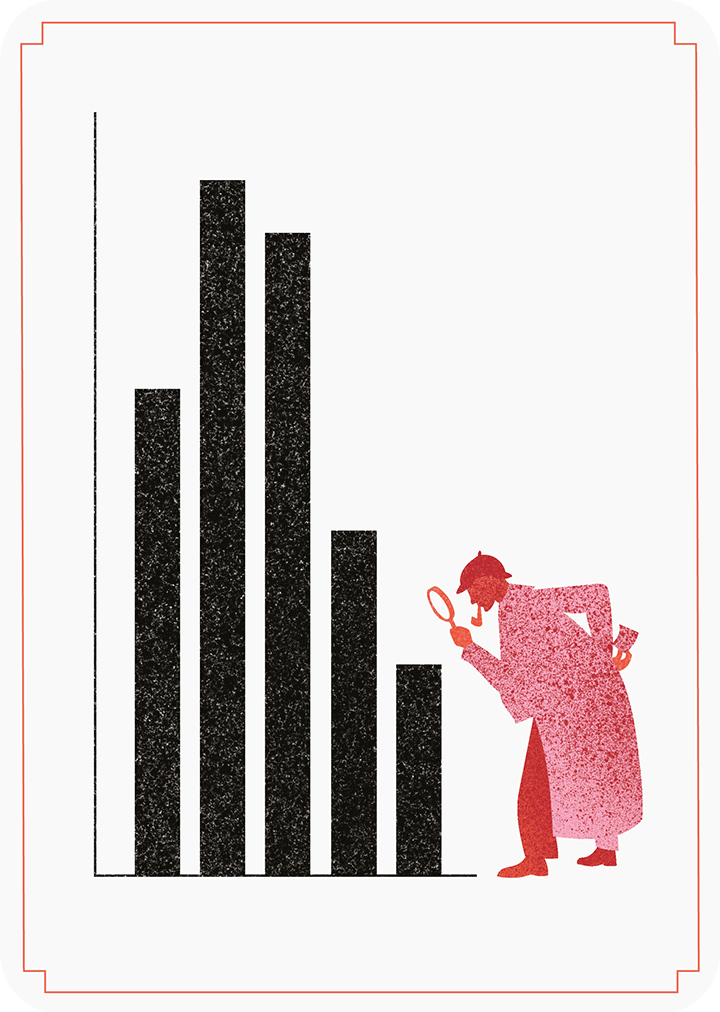
Start from nothing
Bar charts are great for comparisons. To judge their end points, the bars should begin at a zero baseline.

For people to draw meaningful conclusions from a bar graph, the bars have to be presented in full. To do this, you need to start your vertical axis at zero.
Bar charts are generally easy to read because they "ask" our eyes to do a simple thing: compare the relative heights of the bars. But if we show just the tips of the bars to exaggerate differences in the data, our audience loses the ability to make useful visual comparisons.
"Truncation equals misrepresentation," writes Dona M. Wong. So people are either misled and take away the wrong message, or end up having to read the numbers, which defeats the purpose of the chart.
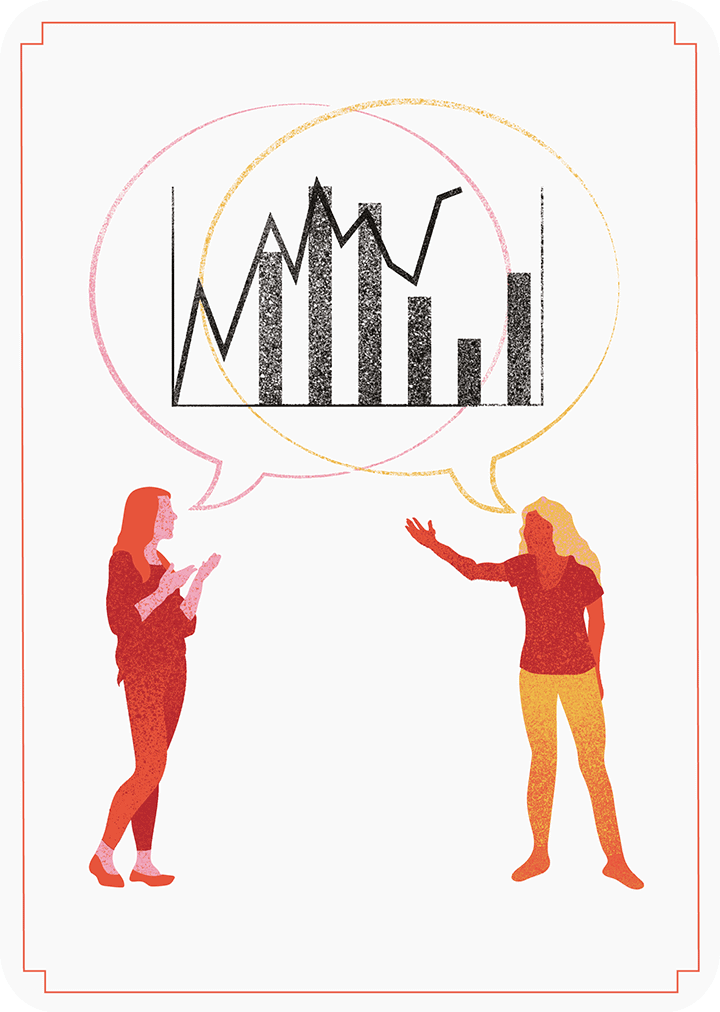
Distorted reality
Line charts often show a trend. Stretching the height of the graph can create fake drama, while stretching the width can underplay it.
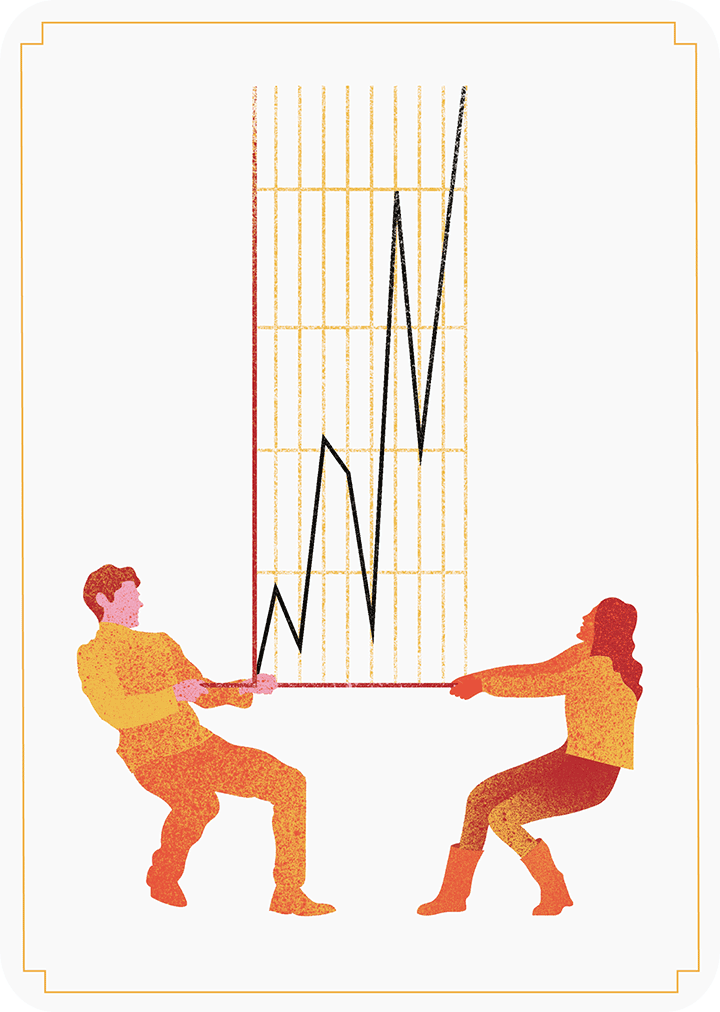
Similar to a stretched or squished photo, a chart’s dimensions — or its aspect ratio — can change the image that we’re presenting. But while you usually can’t get away with a wrong aspect ratio in a photo, a distorted one in a chart can easily go unnoticed. Whether this results in an overblown or understated message, it just misleads your audience.
"There is no single rule to follow in terms of how high or wide to make the graph, but a useful notion involves 'banking to 45°,' whereby the average slope angle across your chart heads towards 45°," writes data visualization specialist Andy Kirk. This is probably impractical to measure, but judging by eye tends to do the trick.
Ditch the pie
Pie charts seem friendly, but in reality they’re hard to read. In most cases, you can find a better alternative.

Pie charts are part of the larger family of area graphs, which are all difficult to interpret. Nevertheless, pie charts are widely used and abused in almost every professional and educational setting.
The reason why pie charts are best avoided is straightforward: our brains can’t make accurate estimates or comparisons of angles. If the slices are fairly close in size, it’s difficult — if not impossible — to tell which is bigger, and when they’re not close in size, the best you can do is determine that one is bigger than the other, but you can’t judge by how much, explains data visualization expert Cole Nussbaumer Knaflic.
Delivering precise numbers with a pie chart requires a lot of effort, such as relying on direct slice labels that might not fit, or legends that make our eyes jump back and forth between the pie and the legend.
Size matters
It’s harder to compare areas or volumes than lengths. To avoid people getting the wrong impression, use them as a last resort.

When we’re asked to judge and compare two dimensions at once, for example, two circles, we rarely make accurate estimates. We usually underestimate the size of the bigger circles and overestimate the size of the smaller ones. This happens because we instinctively judge the lengths or widths of the shapes and not their areas.
"The geometric accuracy of the size calculations is paramount," writes Andy Kirk. When building or reading a proportional shape chart, it’s useful to remember a simple rule: when we double the height of a circle we actually quadruple — not double — its area. And just bear in mind, if you decide to make your circles appear as 3D spheres, you’re no longer representing area but volume.
Less is more
"Perfection is achieved not when there is nothing more to add, but when there is nothing left to take away," said French writer Antoine de Saint-Exupery.
A common mistake we all make with charts is overdressing them with unnecessary elements. The usual suspects are excess color, graphical clutter and abuse of special effects. Displaying too many decimal places in our values is another one to watch out for. Details like these won’t impress anyone, but decluttering your charts will.
“Charts are not just mere illustrations, they are not just drawings, they carry meaning.”
Alberto Cairo, Visual and data journalist
Over the rainbow
Use color to communicate information and not for decoration. Too many colors can confuse and disorient.
When designing a graph, color can be both your friend and your enemy. Depending on how we use it, it can either gracefully highlight data and show a change, or create visual overload and confuse the audience.
"When any color appears as a contrast to the norm, our eyes pay attention, and our brains attempt to assign meaning to that difference," writes data visualization expert Stephen Few. Too many meanings, or colors, just blur your message and throw people off-track.
Also, using different colored elements, like bars or lines, may be illegible for colorblind readers. For this reason, you can either vary the intensities or add a symbol or number to make it clear for these readers.
"Admit colors into charts gracefully, as you would receive in-laws into your home," says Dona M. Wong.
Spare the ink
Background, borders, shading, dark grid lines and needless labels are your enemies. Banish them to draw attention to the data.
To get this point across, American statistician, Edward Tufte, in one of his most influential books, coined the term 'chartjunk': "The interior decoration of graphics generates a lot of ink that does not tell the viewer anything new. The purpose of decoration varies — to make the graphic appear more scientific and precise, to enliven the display, to give the designer an opportunity to exercise artistic skills. Regardless of its cause, it is all non-data-ink or redundant data-ink, and it is often chartjunk."
The simple solution is to use the least amount of ink to communicate your message, and remove anything that’s distracting. This way, you’ll make your data and your graph stand out. As Alberto Cairo says: "white space isn’t empty space."
A dimension too far
Unless you’re actually plotting the third dimension, don’t use 3D. It skews the data and makes comparisons harder.
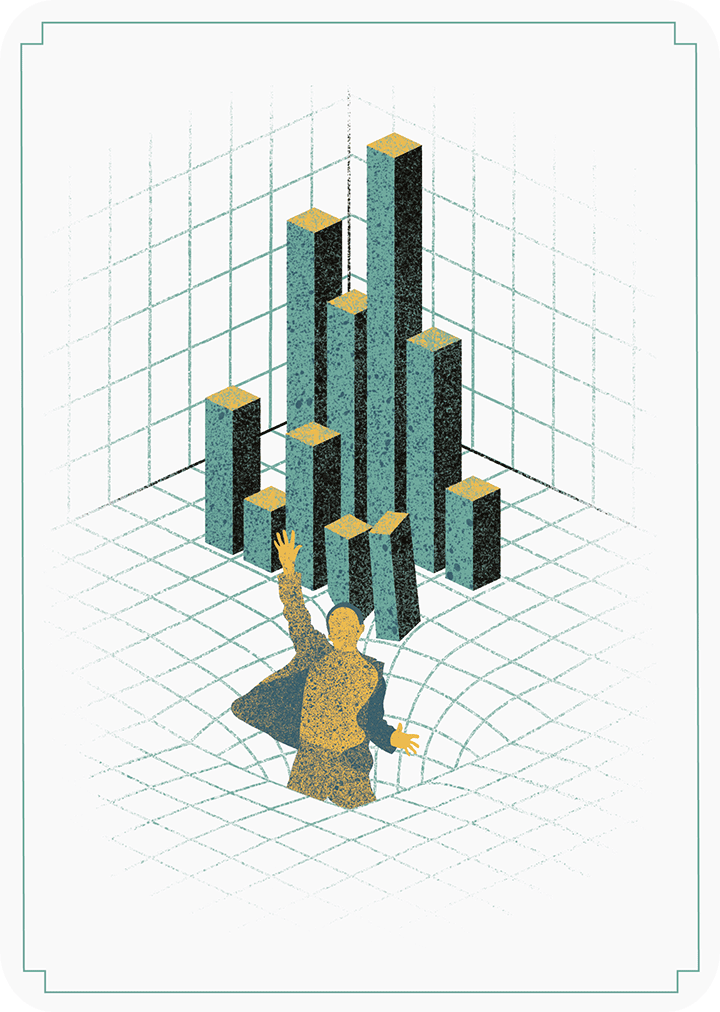
Most data visualization experts agree that use of 3D special effects is, at best, an unnecessary and, at worst, a disorienting and confusing element. It "distorts the viewer’s ability to read values within any degree of acceptable accuracy," writes Andy Kirk.
There’s something very appealing about fancy 3D charts. However, in most cases, the third dimension — or depth — is purely decorative, and makes it difficult for people to process the data. In a 3D chart, the back part looks smaller in relation to the front, or is even hidden by it, which makes judgments of values and comparisons almost impossible. Also, people don’t know which point on the 3D shape to measure against the axis scale.
3D charts, in most circumstances, are just a waste of time and effort for both you and your audience.
Stick to the point
Extra decimal places look impressive and imply accuracy, but they’re often pointless. So, take a step back and round numbers off before plotting.

Overstating the numerical precision of your data by showing too many decimal places can make your chart seem accurate, but this specificity is just misleading. Even when you don’t exaggerate the precision of your data, and your numbers are genuinely accurate, overloading your audience with such detail is often useless.
"Selecting the appropriate level of precision for numbers boils down to a single design practice: the level of precision should not exceed the level needed to serve your communication objectives and the needs of your readers," writes Stephen Few.
Just remember, when using less precision than is available, it’s important you keep your audience in the loop.
Keep it simple
Charts are all about making data accessible to a broad audience. This doesn’t mean you need to over-simplify or dumb things down — just be direct and get your point across without overcomplicating things.
People tend to question their intelligence and blame themselves when they have difficulty interpreting a graph. But in most cases, it’s not people’s fault, it’s the design’s.
“It’s relatively easy to take something simple and make it complicated. It’s much harder to take something complex and present it in a way that is accessible to your audience. Aim for straightforward.”
Cole Nussbaumer Knaflic, Data visualization expert
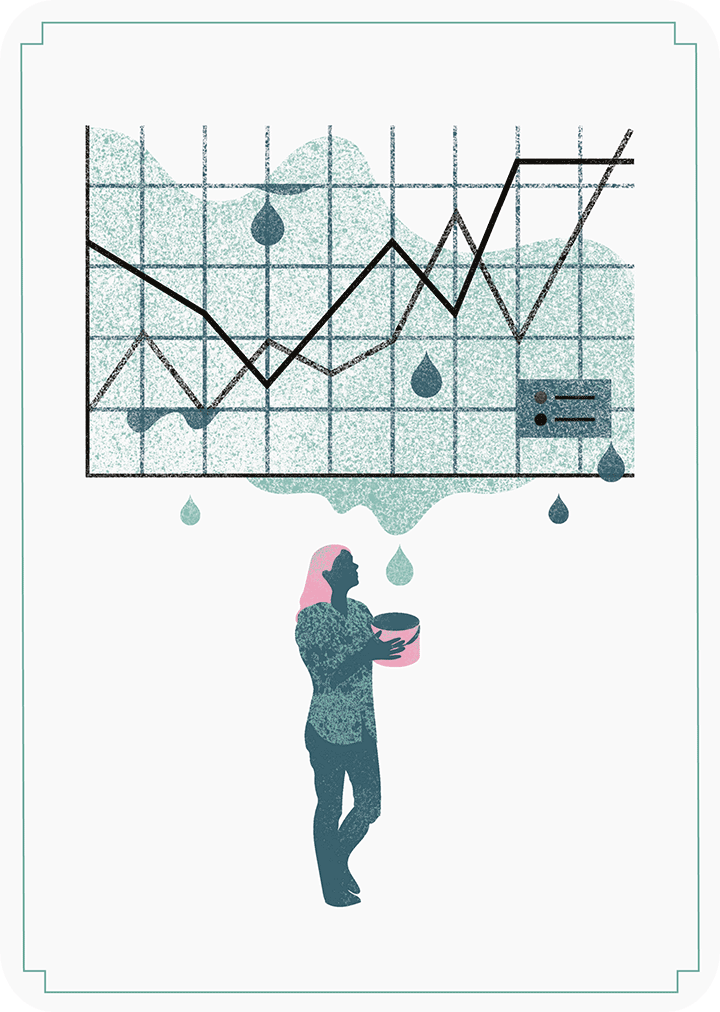
Avoid mysteries
Text is your friend. Thoughtful use of labels means no one’s in the dark. Every chart and every axis need at least a title.
Annotation is the most straightforward, but often the most neglected, step in making a graph accessible. Adding the right text, that’s brief and relevant, helps people use their brainpower to understand the data rather than figure out the chart.
"Text plays a number of roles in communicating with data: use it to label, introduce, explain, reinforce, highlight, recommend and tell a story," suggests Cole Nussbaumer Knaflic.
The basic types of labeling include chart titles, axis titles, axis labels or scales, which appear around the graph, plus data labels that mark specifics inside the chart. Units of measurement and data sources are frequently overlooked, but they also play a key role in removing the guesswork when people interpret your graph. Just remember, words are there to help, not to hijack the attention from the data.
A tale of two stories
Charting two sets of data with one scale on the left and another on the right can be confusing, and suggests a relationship that may not exist.
It’s relatively easy and sometimes helpful to plot multiple sets of data using a common horizontal axis if all the data is expressed with the same unit of measure. But if they use different units, you’ll need to add a secondary vertical axis on the right of the chart.
This display requires time and effort from the audience to decode and understand which data should be read against which axis. But even if they solve this puzzle, they’re tempted to compare the magnitudes of values between the two sets of data, which is meaningless given that the scales and units of the data are different, says Stephen Few.
As a general rule, try to avoid squeezing too much data in a small space. To tell an elaborate story, it’s better to use two or more charts.
Stand on the right
Tables are good for looking up individual numbers. But, to help people scan and compare them, align whole numbers flush right.
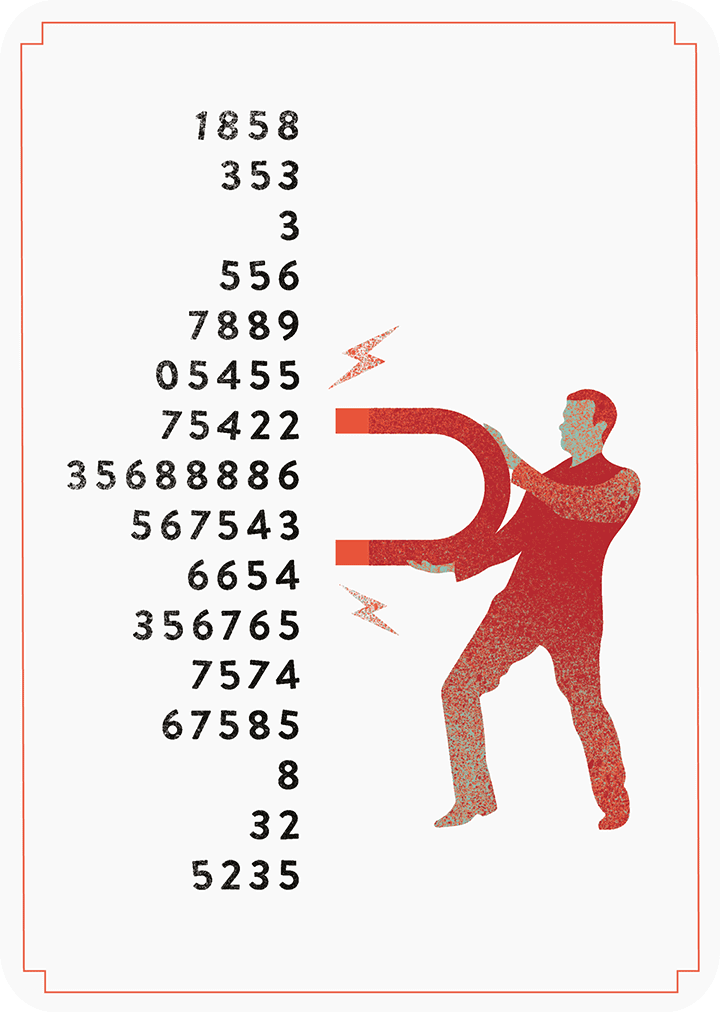
For a table to do its job, it has to show information in a way that makes spotting numbers, and row-to-row comparisons, easy. If we align numbers to the left or center, this defeats the purpose and forces people to jump back and forth between values, making comparisons of magnitudes difficult.
Aligning numbers to the right holds true for both whole and decimal values. For values with decimal digits, Stephen Few suggests aligning both the decimal point and the final digit to the right. He explains that "this can be accomplished by expressing each value using the same number of decimal digits, even when they are zeroes."
Also, adding thousands separators — like commas, dots, or spaces — to break the numbers up into smaller chunks, can help people store values in working memory and easily spot differences between the numbers.
Back to basics
With charts, simpler is always better. To keep things even clearer, when you have one or two values, just show the numbers.

We often ask ourselves: what kind of graph should I use? Most data visualization experts agree that it’s always better to use graphic forms that people are familiar with. Bars, lines, tables, or just a number, in most cases, are the most efficient ways to show your data to the world, with the minimal amount of effort and space used.
"The fact that you have some numbers does not mean that you need a graph," underlines Cole Nussbaumer Knaflic. When we try to present just one or two numbers on a chart, the medium steals the attention from the data. Showing the number directly is much simpler and truly impactful.
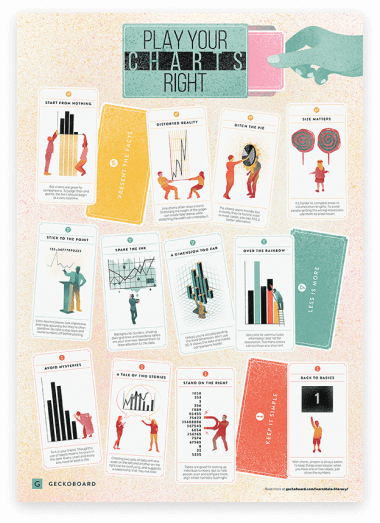
Get the poster
Here’s a handy poster with our first 12 data visualization tips.
Download the Data Visualization Poster (PDF)