 QuickBooks Online dashboards
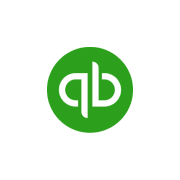
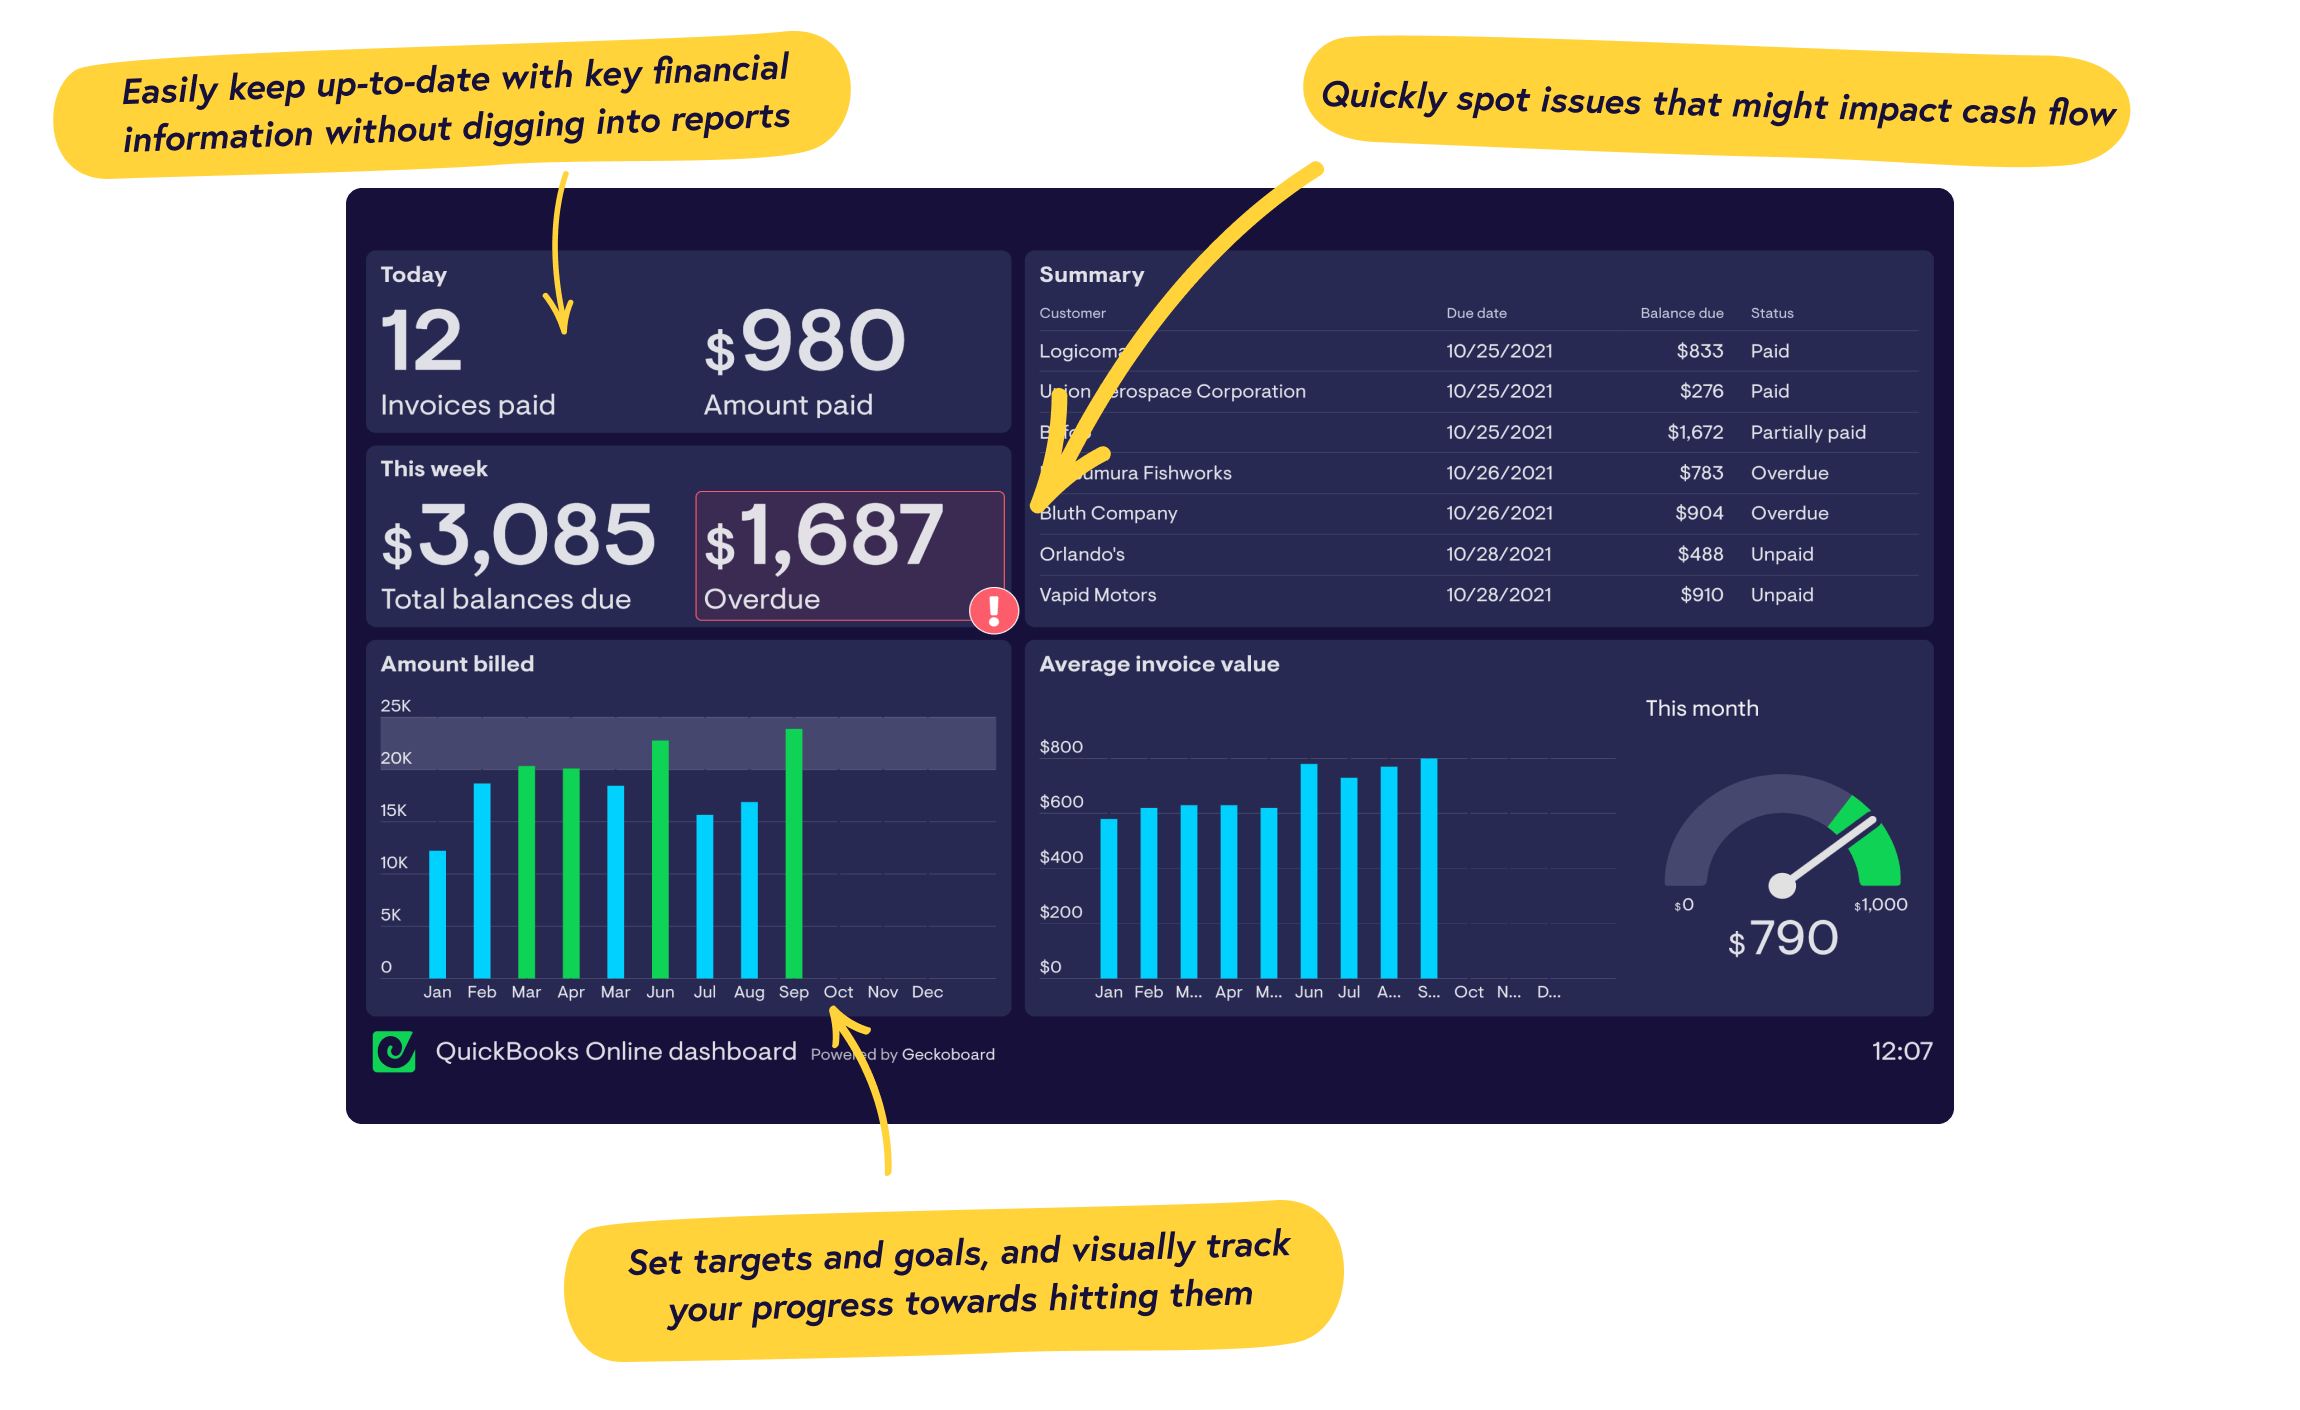
Keep on top of cash flow with a real-time QuickBooks KPI dashboard
Trusted by 1000s of data-driven organizations
Create dashboards for QuickBooks that surface key financial data for you, your clients, and your team.
No coding or extra training required.
Connect to your data
Securely connect your QuickBooks Online account and access dozens of metrics effortlessly.
Read our step-by-step guide
Visualize QuickBooks data
Filter your data and adjust presentation options to build easy-to-understand visualizations of QuickBooks Online data.
Create dashboards for QuickBooks everyone can understand
Resize, group, and rearrange the visualisations to create your own custom dashboards.
Highlight what’s important
Use goals and status indicators to draw attention to interesting changes as they happen.
Key metrics supported
- Overdue invoices
- Balance due per customer
- Average invoice amount per customer
- Paid, unpaid and partially paid amounts
Go beyond baked-in charts and static reports
Bring all your key metrics from different tools together into one dashboard.
Metrics refresh every few minutes so you're always up to date
Visually highlight targets and noteworthy changes in your data.
Add your logo and brand colours for a fully custom look and feel.
It’s a great way to educate employees about key company metrics and show that the company is going in the right direction.
Over 90 data sources and counting
Easily access KPIs throughout the day
No more digging around in different platforms to see the data that can make a difference. Our sharing features make sure key metrics get seen by the right people at the right time.
-
Generate a link to your live dashboard – share on email, IM, embed or bookmark.
-
Schedule daily, weekly or monthly snapshots to send to your Slack channels.
-
Automatically email screenshots of your dashboards on a schedule of your choice.
-
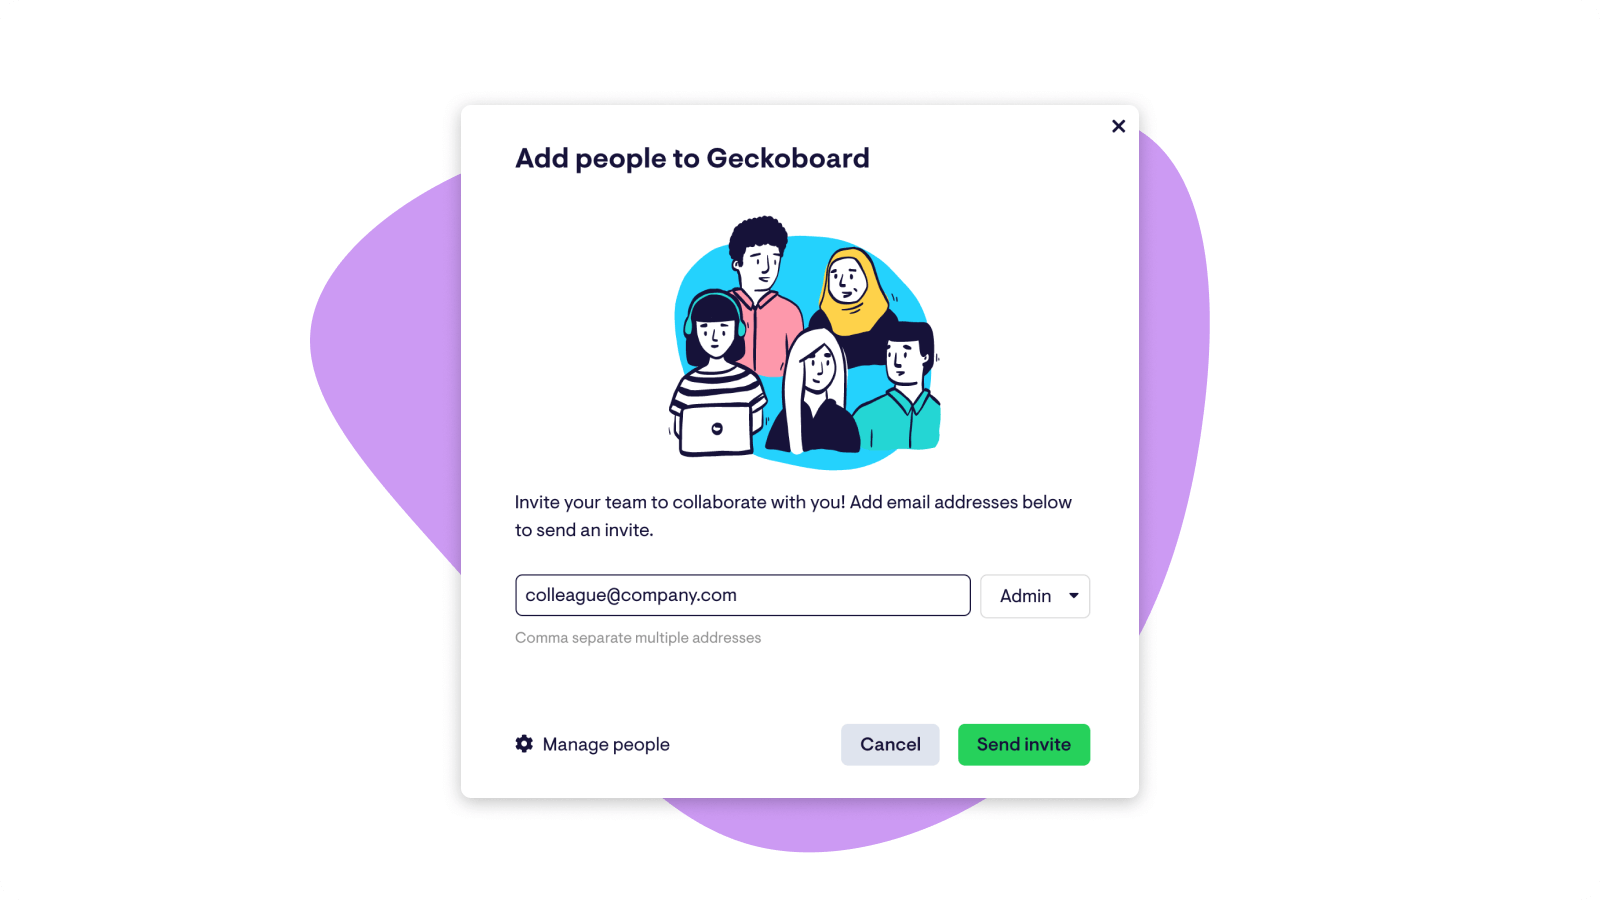
Invite team members to view private dashboards, and even start building their own.
-
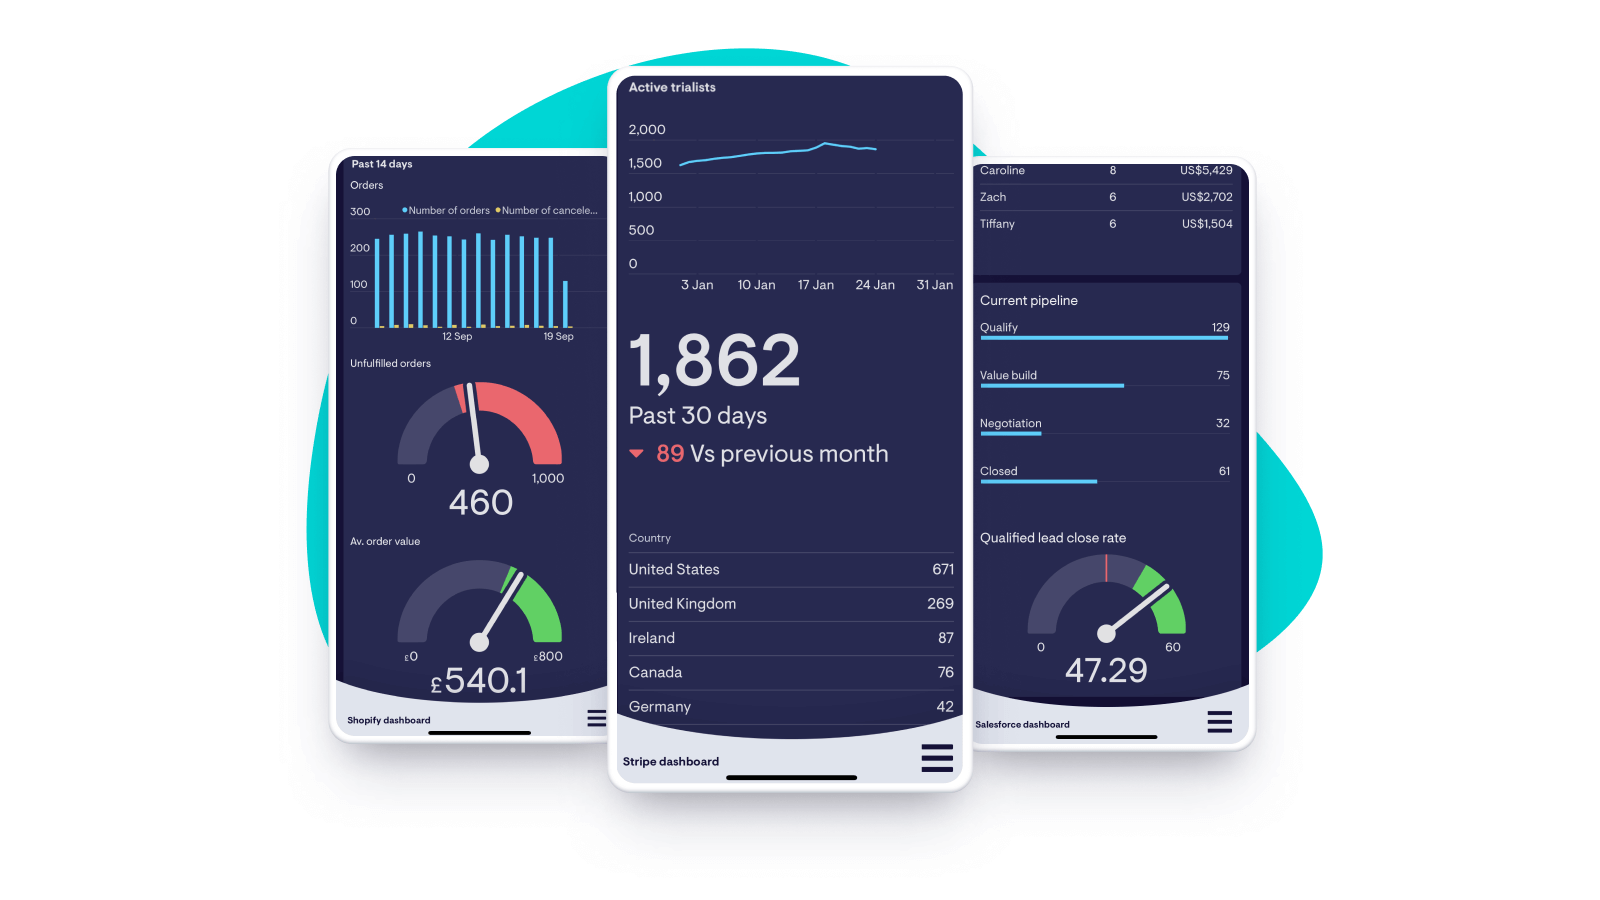
Use a phone or tablet to check your dashboards on the go. Learn more
-
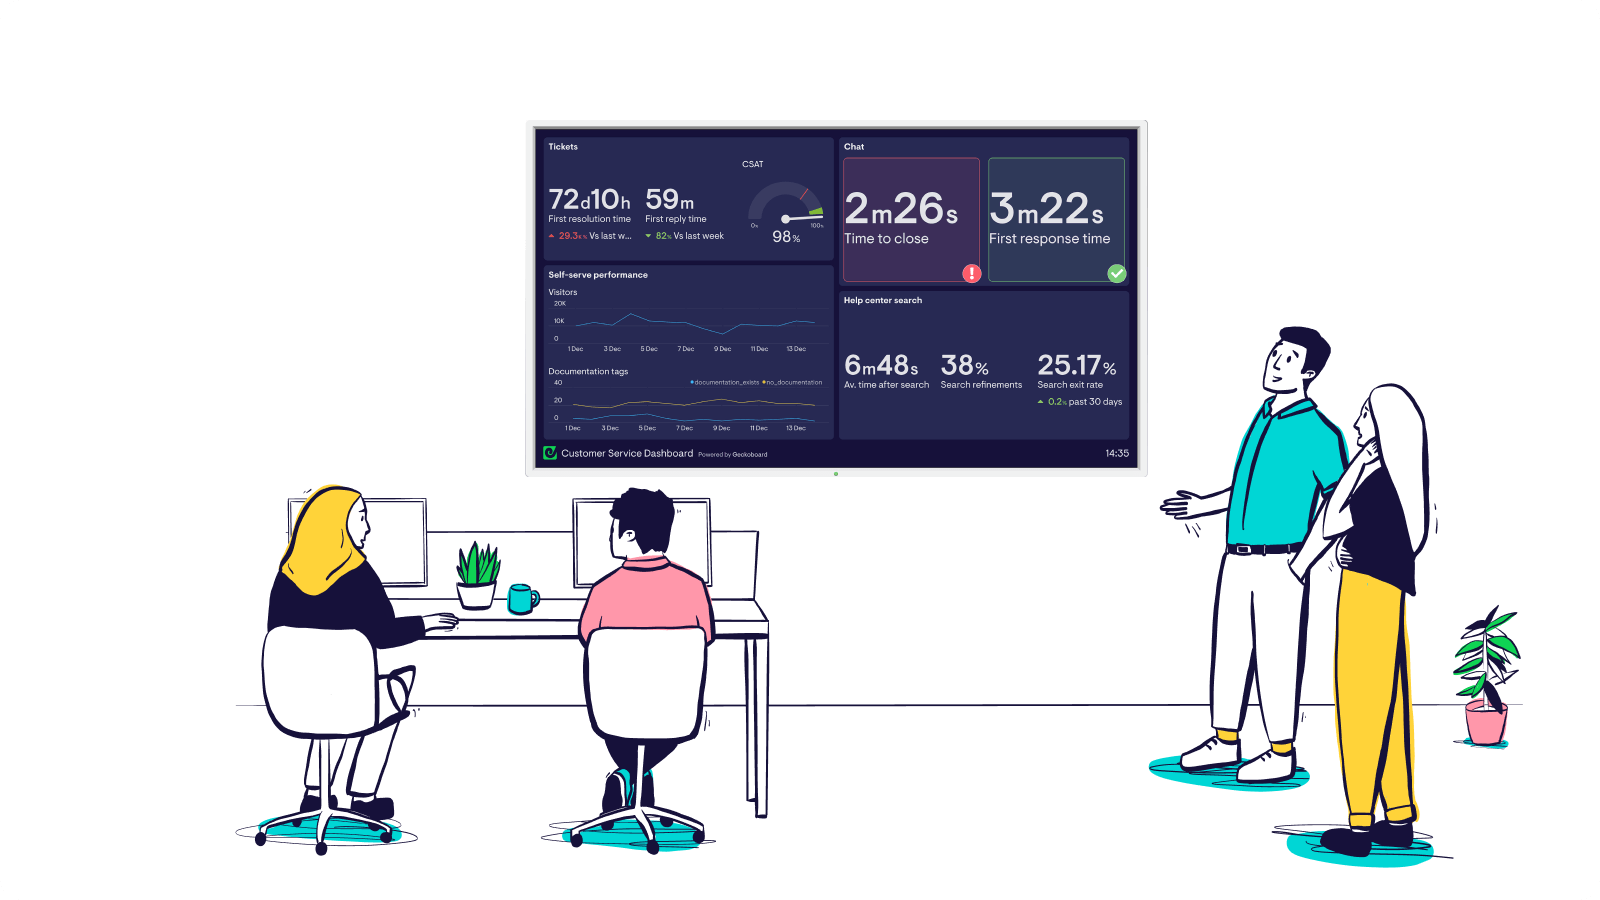
Pair a TV and proudly display your dashboards where everyone can see them. Learn more
-
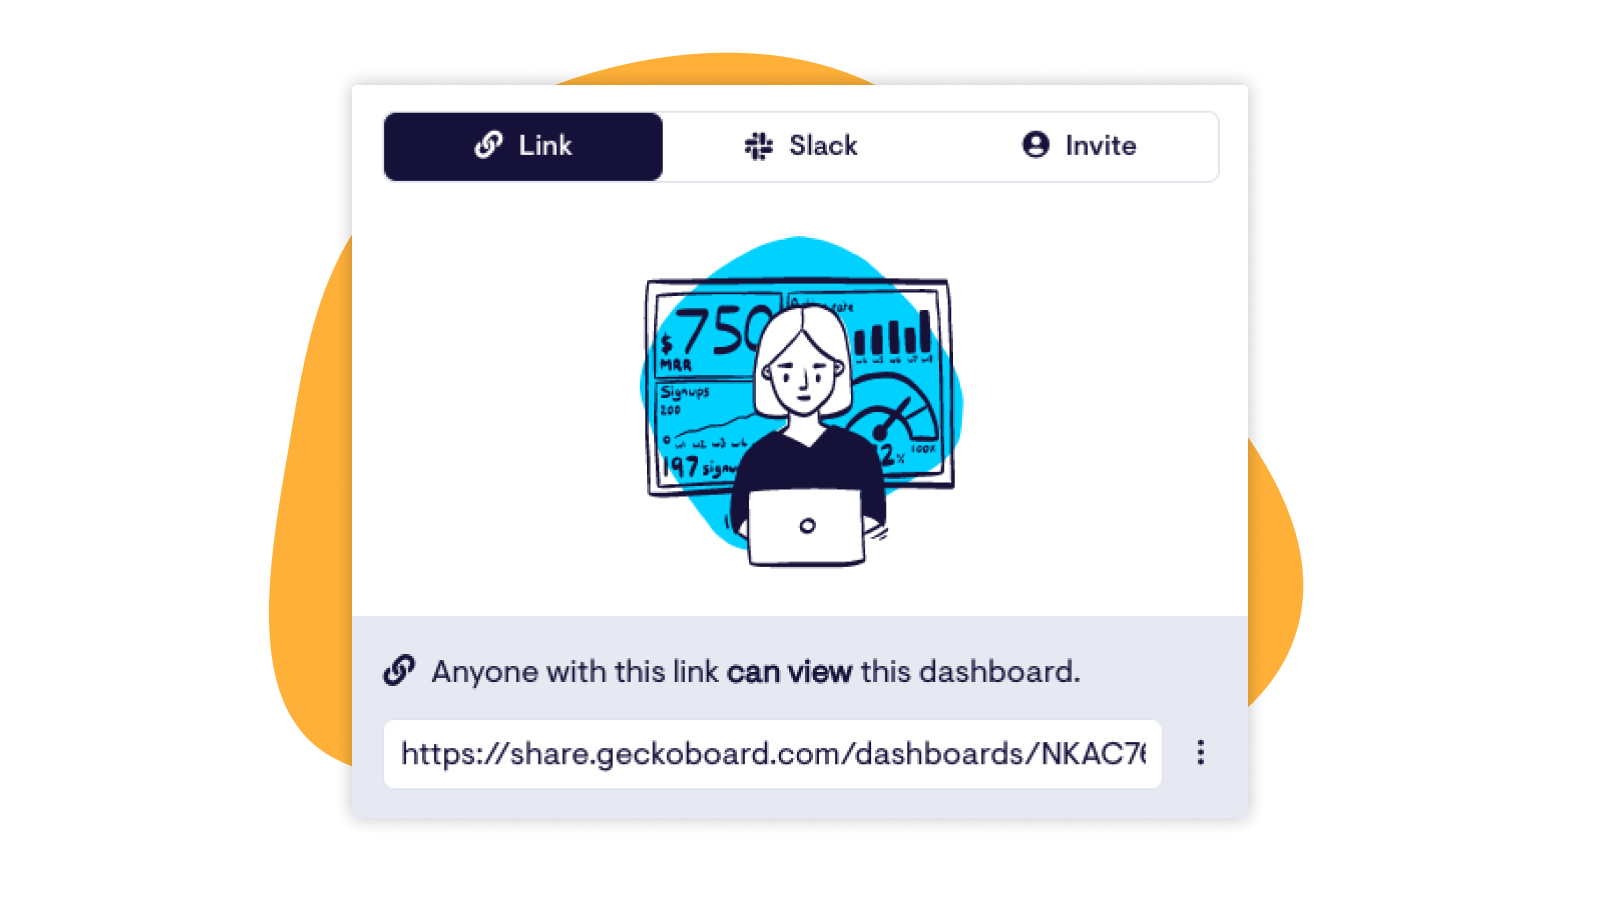
Share a link
Generate a link to your live dashboard – share on email, IM, embed or bookmark.
-
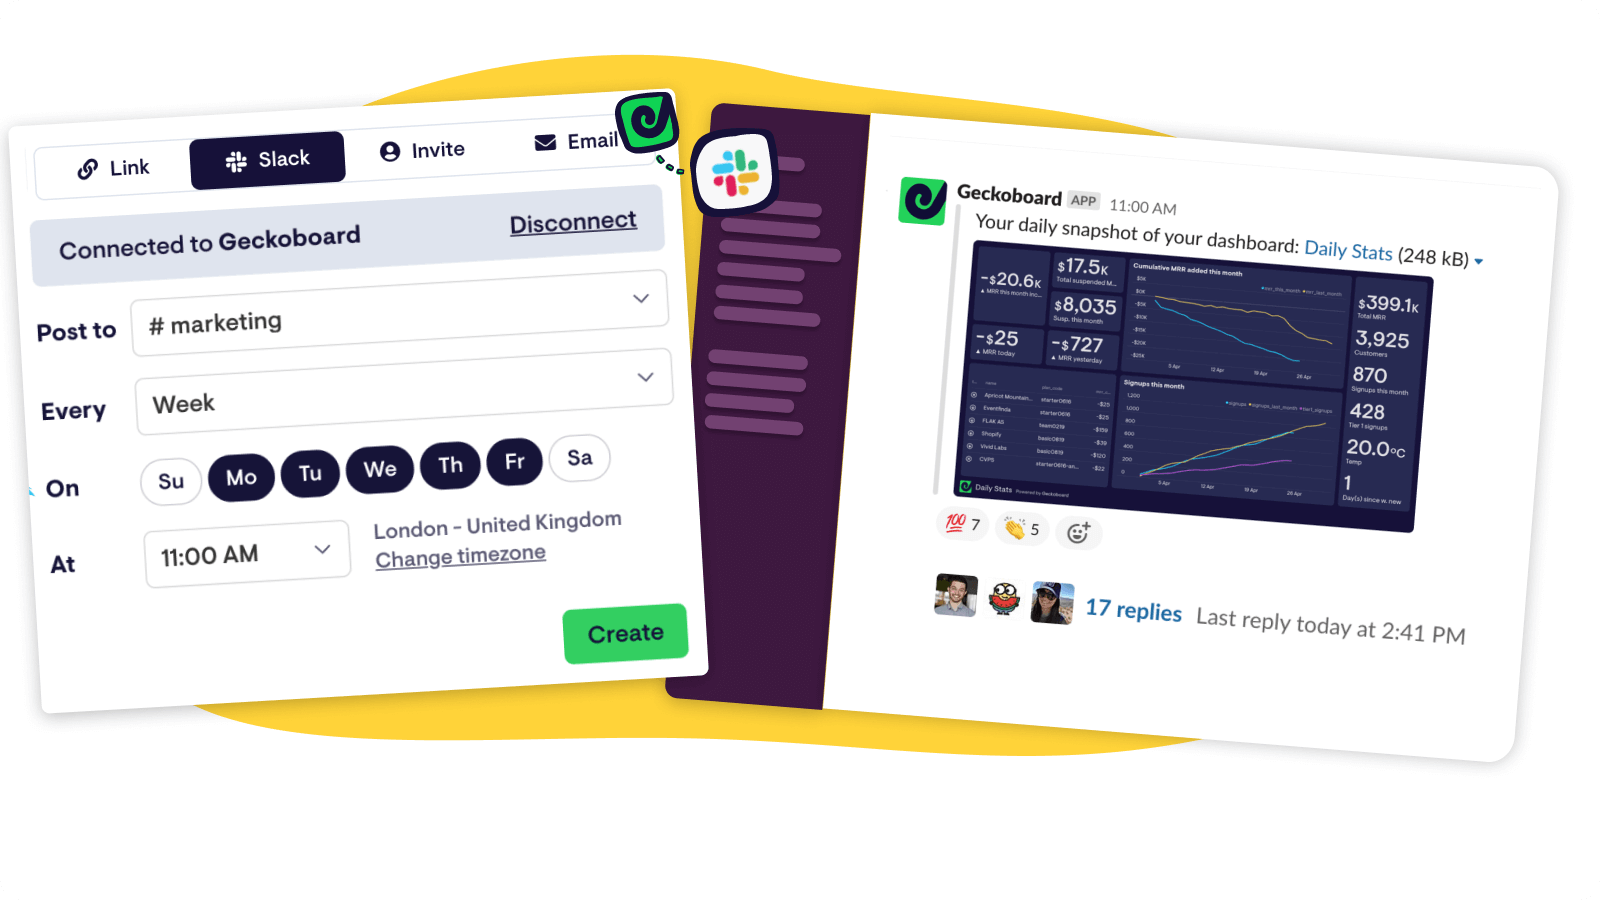
Post to Slack
Schedule daily, weekly or monthly snapshots to send to your Slack channels.
-
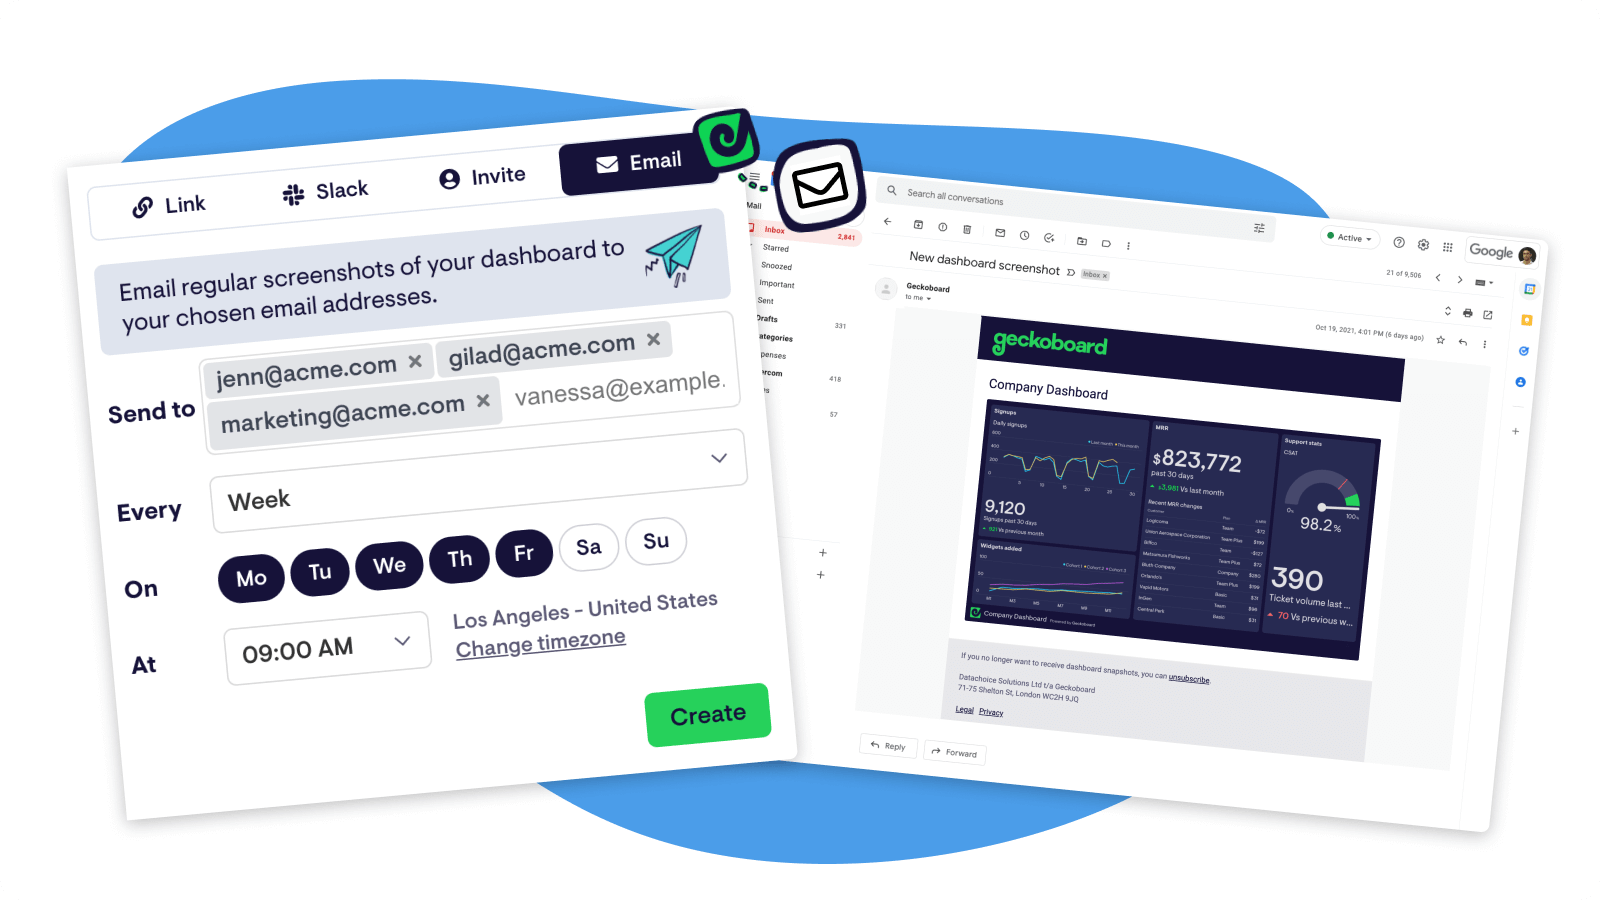
Email snapshots
Automatically email screenshots of your dashboards on a schedule of your choice.
-
Manage users
Invite team members to view private dashboards, and even start building their own.
-
Mobile friendly
Use a phone or tablet to check your dashboards on the go. Learn more
-
Display on a TV
Pair a TV and proudly display your dashboards where everyone can see them. Learn more
We want to be as data-driven as we can and Geckoboard allows us to share the right data with each team in the clearest way.