IT dashboard examples
An IT dashboard gives IT teams a live view of the metrics that matter most to their work — from service desk performance to system health. What goes on it depends on whether you're monitoring infrastructure, tracking support requests, or both.
IT team dashboard
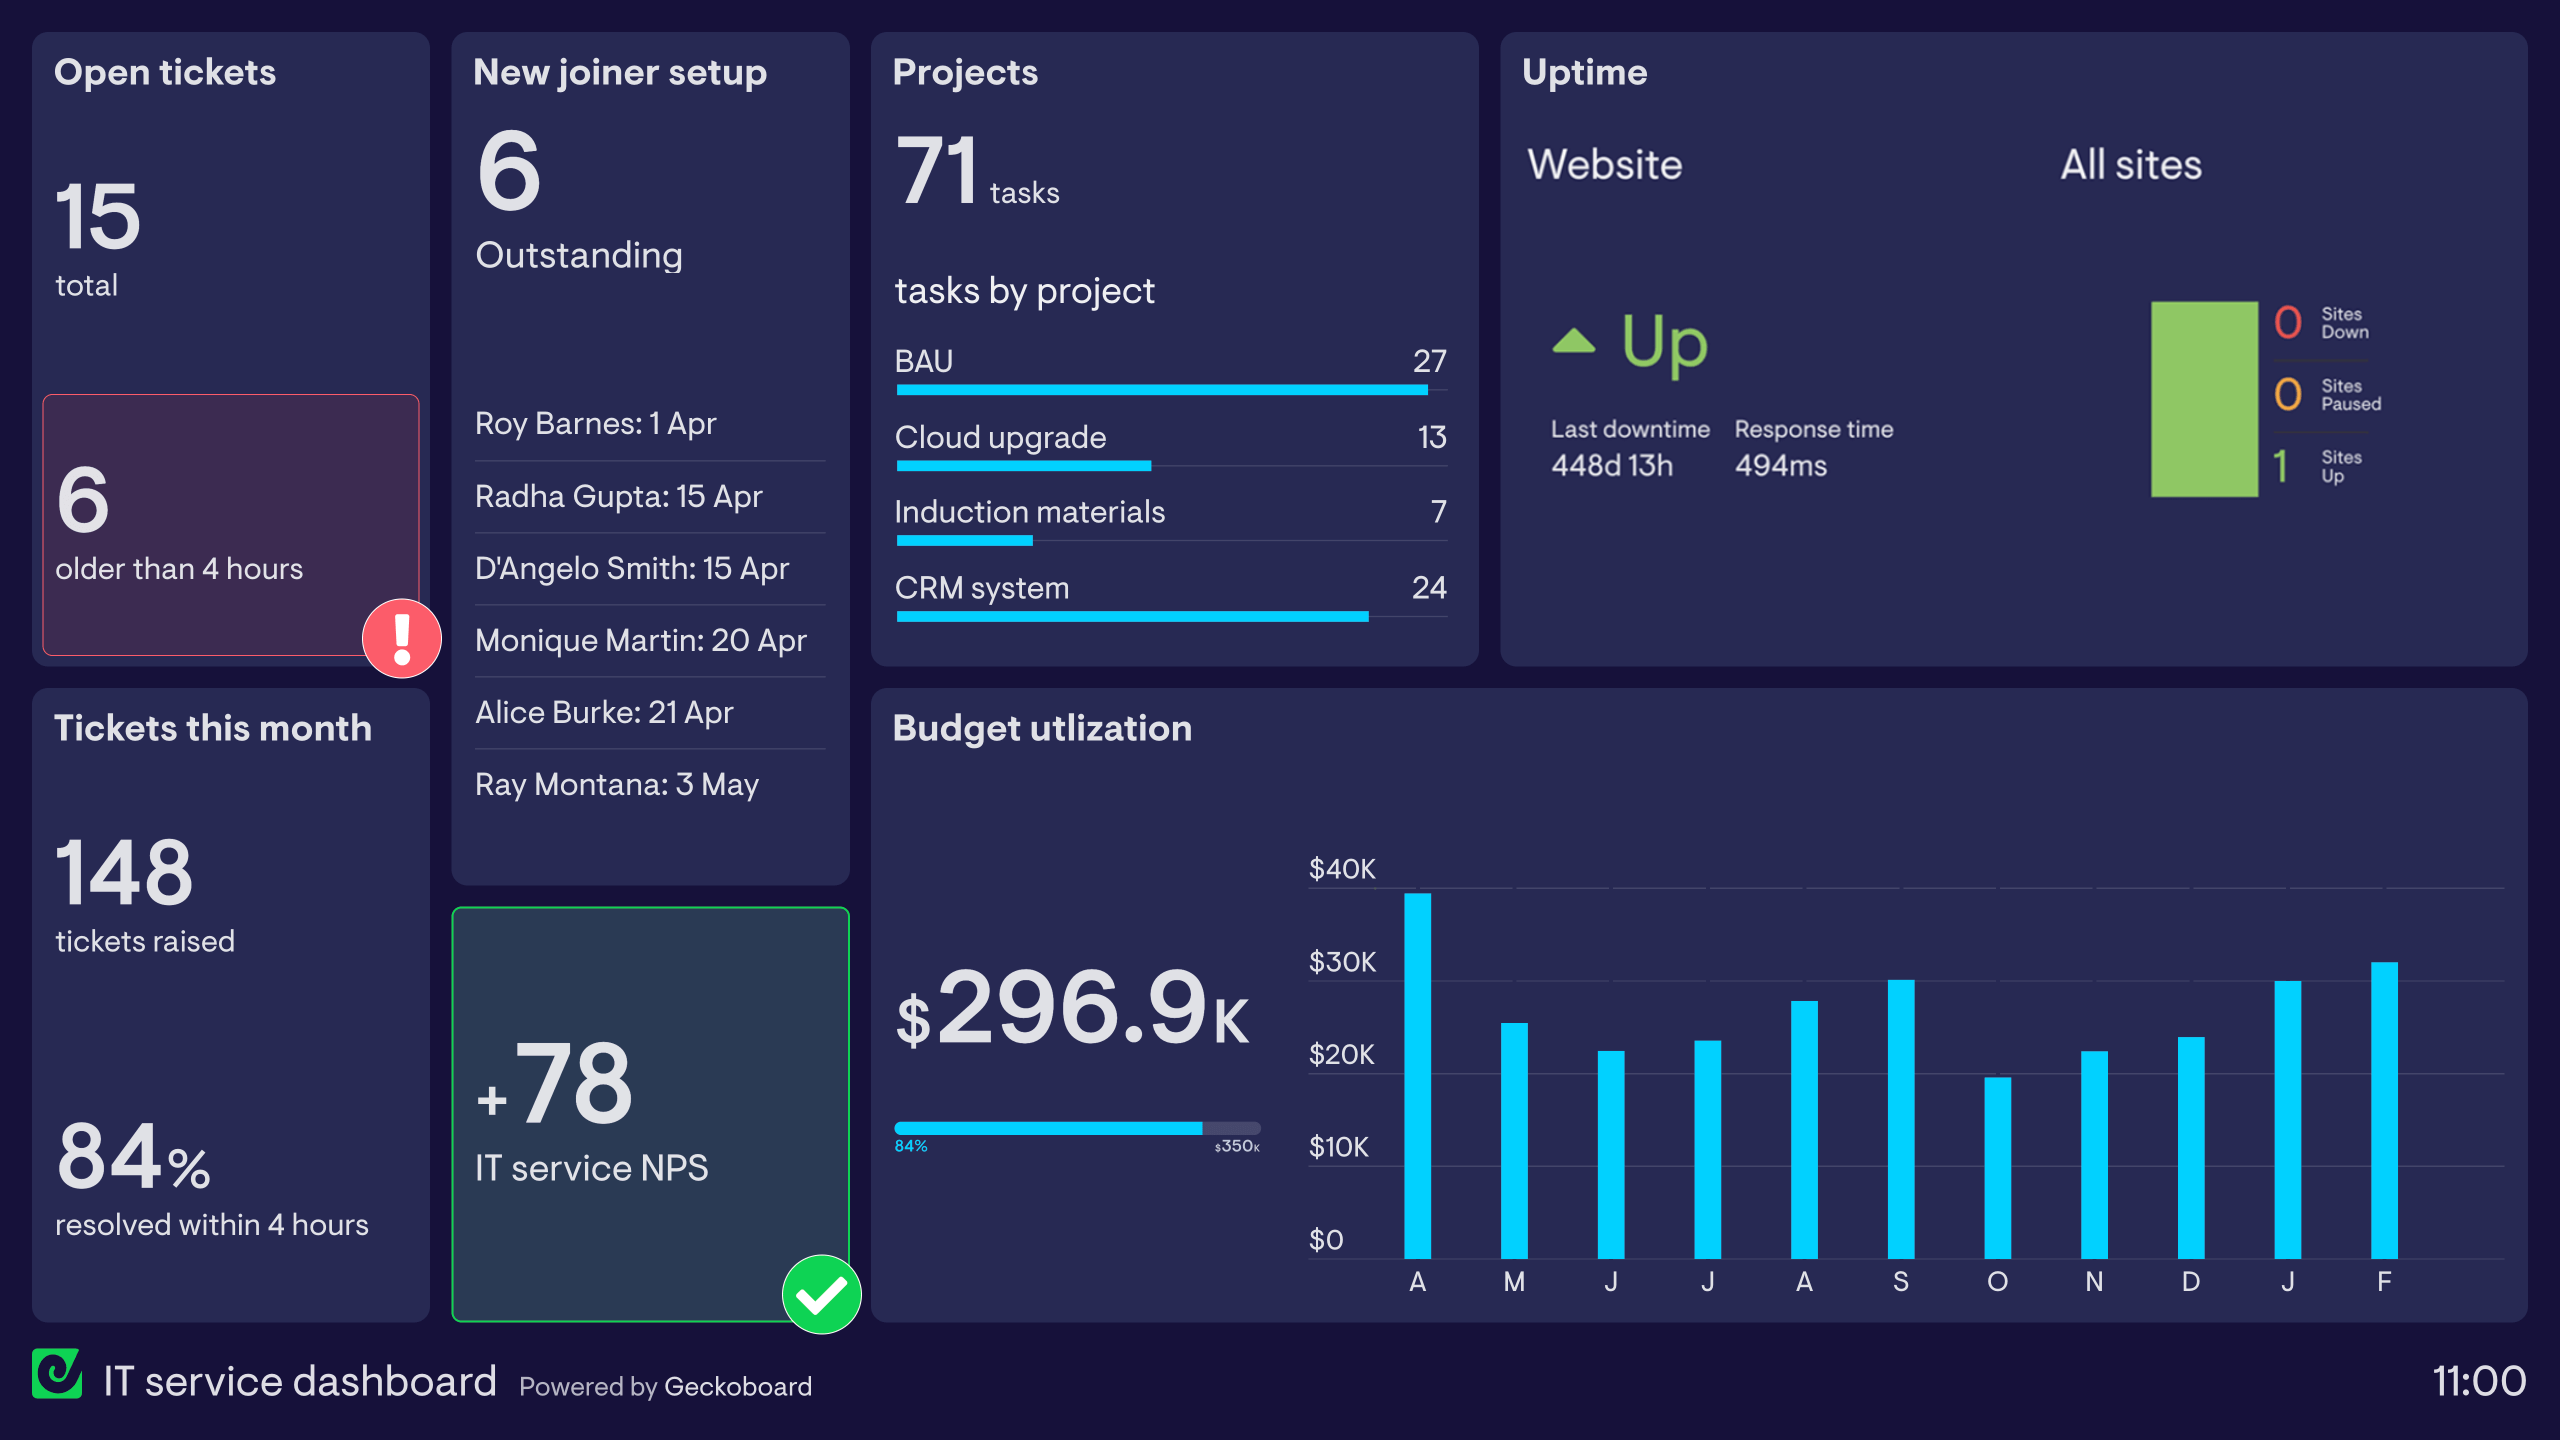
This dashboard monitors various metrics related to the IT team’s day-to-day operations, goals and responsibilities.
The first two rows (on the left hand side of the dashboard) visualize metrics related to the team’s internal support. The IT team can quickly see how many tickets have been raised by colleagues who require urgent IT support. They can also see how quickly and efficiently they are resolving new issues. In this case, a backlog of tickets has built up, triggering a red status indicator.
The team can also see how many new people are joining the organization, ensuring they have been set up on the company system and have received their IT equipment before their first day. Finally, this section includes a Net Promoter Score (NPS) taken from a mini survey which measures how satisfied colleagues are with their level of IT support.
On the right hand side of the dashboard, the team is tracking other important metrics. These include status updates on long term projects, budget utilization and website uptime. The variety of metrics goes to show how these dashboards can be entirely customized to the users’ needs.
Amazon Web Services expenditure dashboard
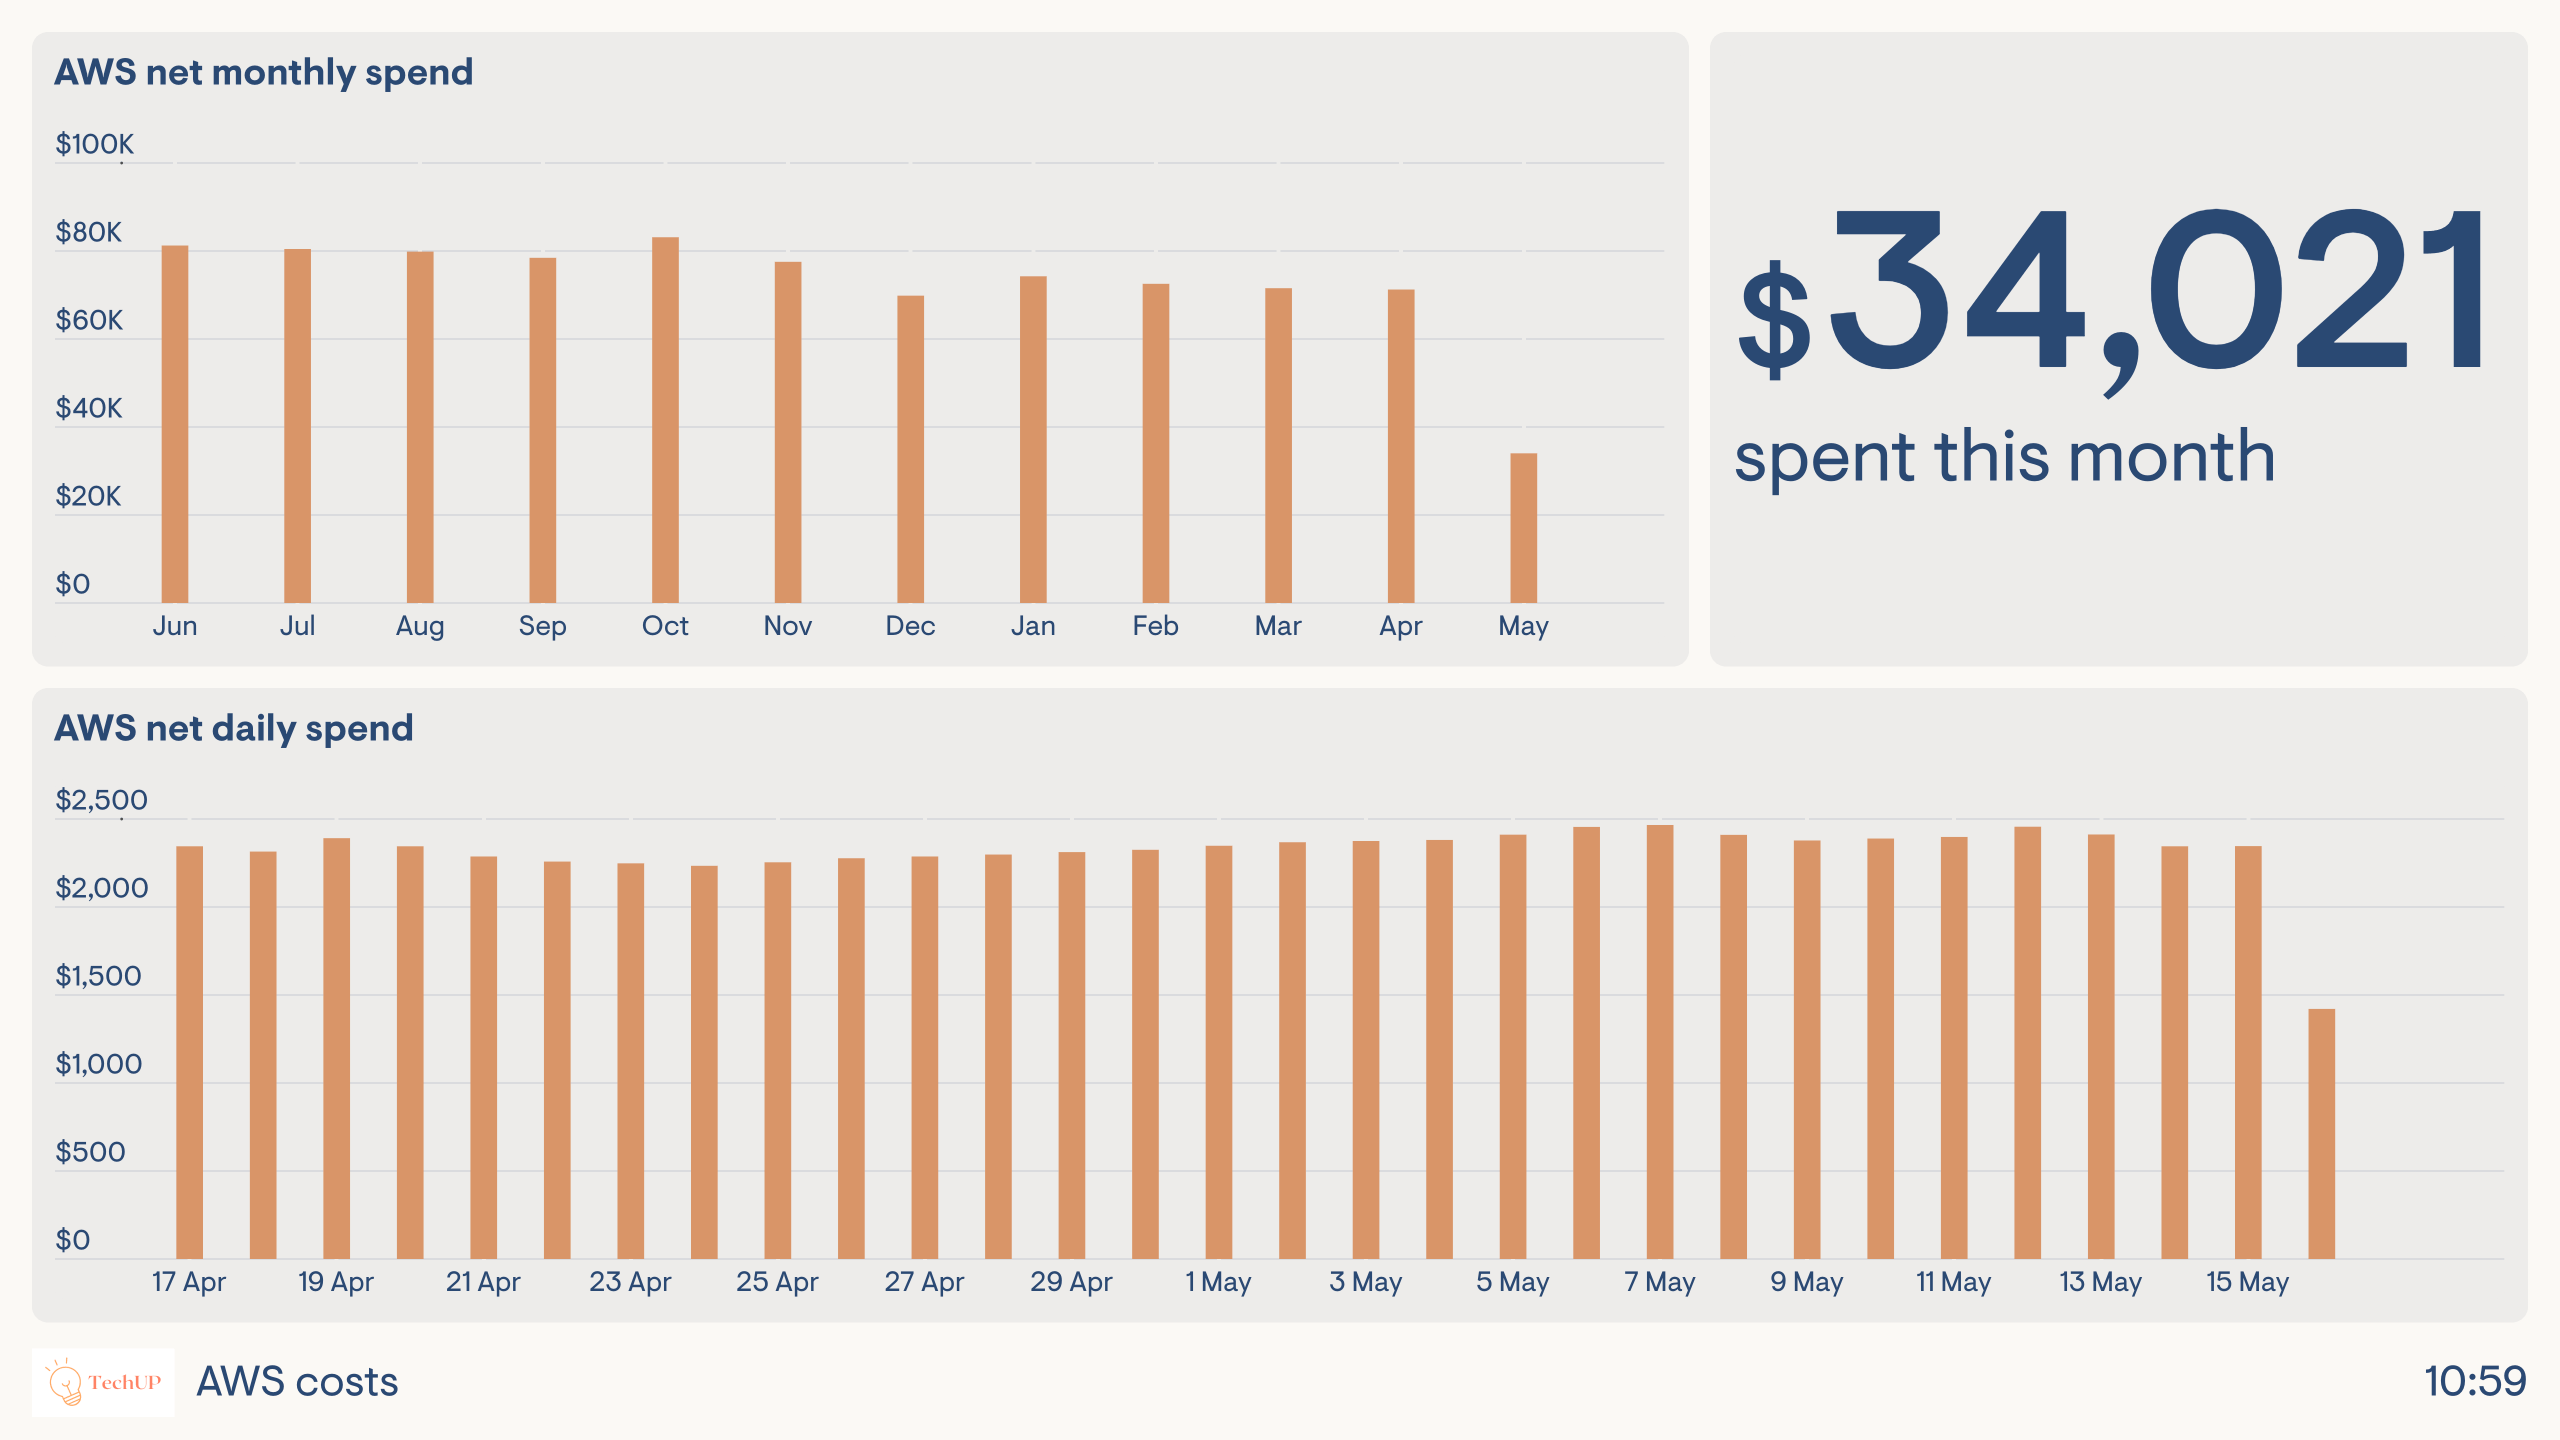
This dashboard has one purpose, to monitor the company’s expenditure with Amazon Web Services. (AWS)
For this EdTech company, who uses AWS to manage their cloud-based servers, their AWS spend represents a significant proportion of their overall IT budget. It’s therefore vital that they keep on top of how much they are spending. Unfortunately, updates on billing information are both infrequent and only accessible via the account admins. This creates the prospect that developers can cause a significant increase in the net daily spend, without anyone noticing.
That’s why the account admin has created this dashboard to keep everyone aware of daily and monthly spend. More eyes on these metrics – more frequently – reduces the likelihood that expenditure will ever get out of control.
An IT dashboard gives technology teams a consolidated view of infrastructure health, project status, and operational costs in one place. IT managers and team leads use it to track incidents, monitor uptime, manage spend, and keep projects on track — without switching between multiple tools.
Geckoboard is a live dashboard tool that connects to monitoring services, databases, and project management tools to give IT teams a single view of operational health. Dashboards can be displayed on office screens or shared with the wider business as links or automated snapshots.
Common metrics include server uptime, incident count and resolution time, cloud spend, ticket volume, deployment frequency, and project progress. Teams monitoring AWS often add cost-per-service breakdowns alongside operational KPIs.
Building a custom IT dashboard is straightforward with Geckoboard's dashboard builder. Connect Amazon CloudWatch, Pingdom, Monday.com, and SQL databases and custom data sources to centralise your infrastructure and project data, then pick your metrics and build the view you need. Share with your team as a TV dashboard, shared link, or scheduled snapshot. Start a free trial or learn more about how Geckoboard works.
Use it to bring data together from monitoring tools, project management platforms, and databases into a single view the whole team can act on. It also helps deliver executive visibility into IT spend and system reliability without requiring leadership to dig into technical tools.