Boost team performance with real-time Pipedrive dashboards
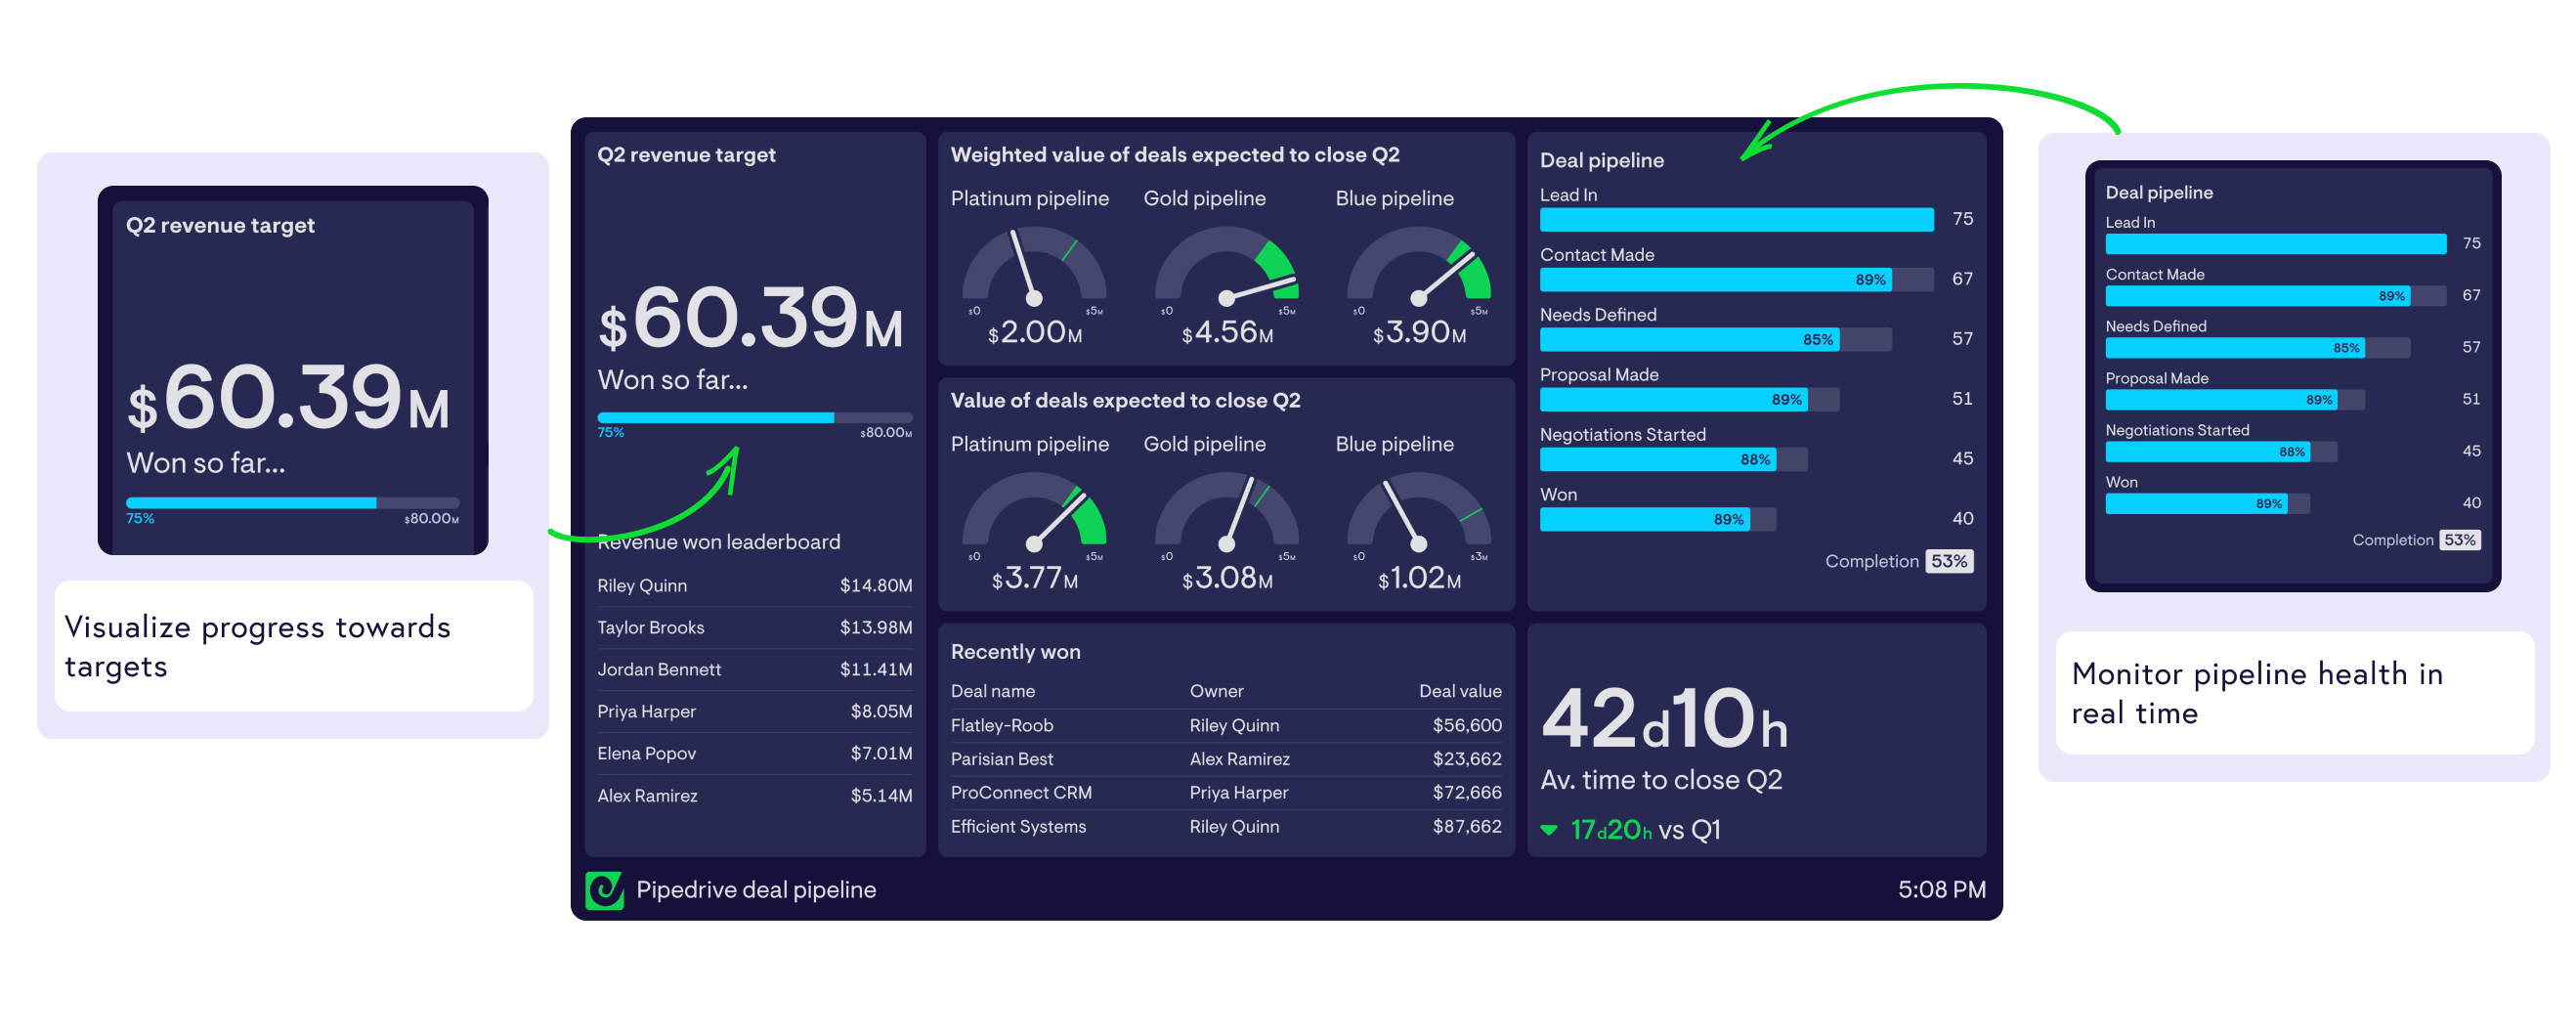
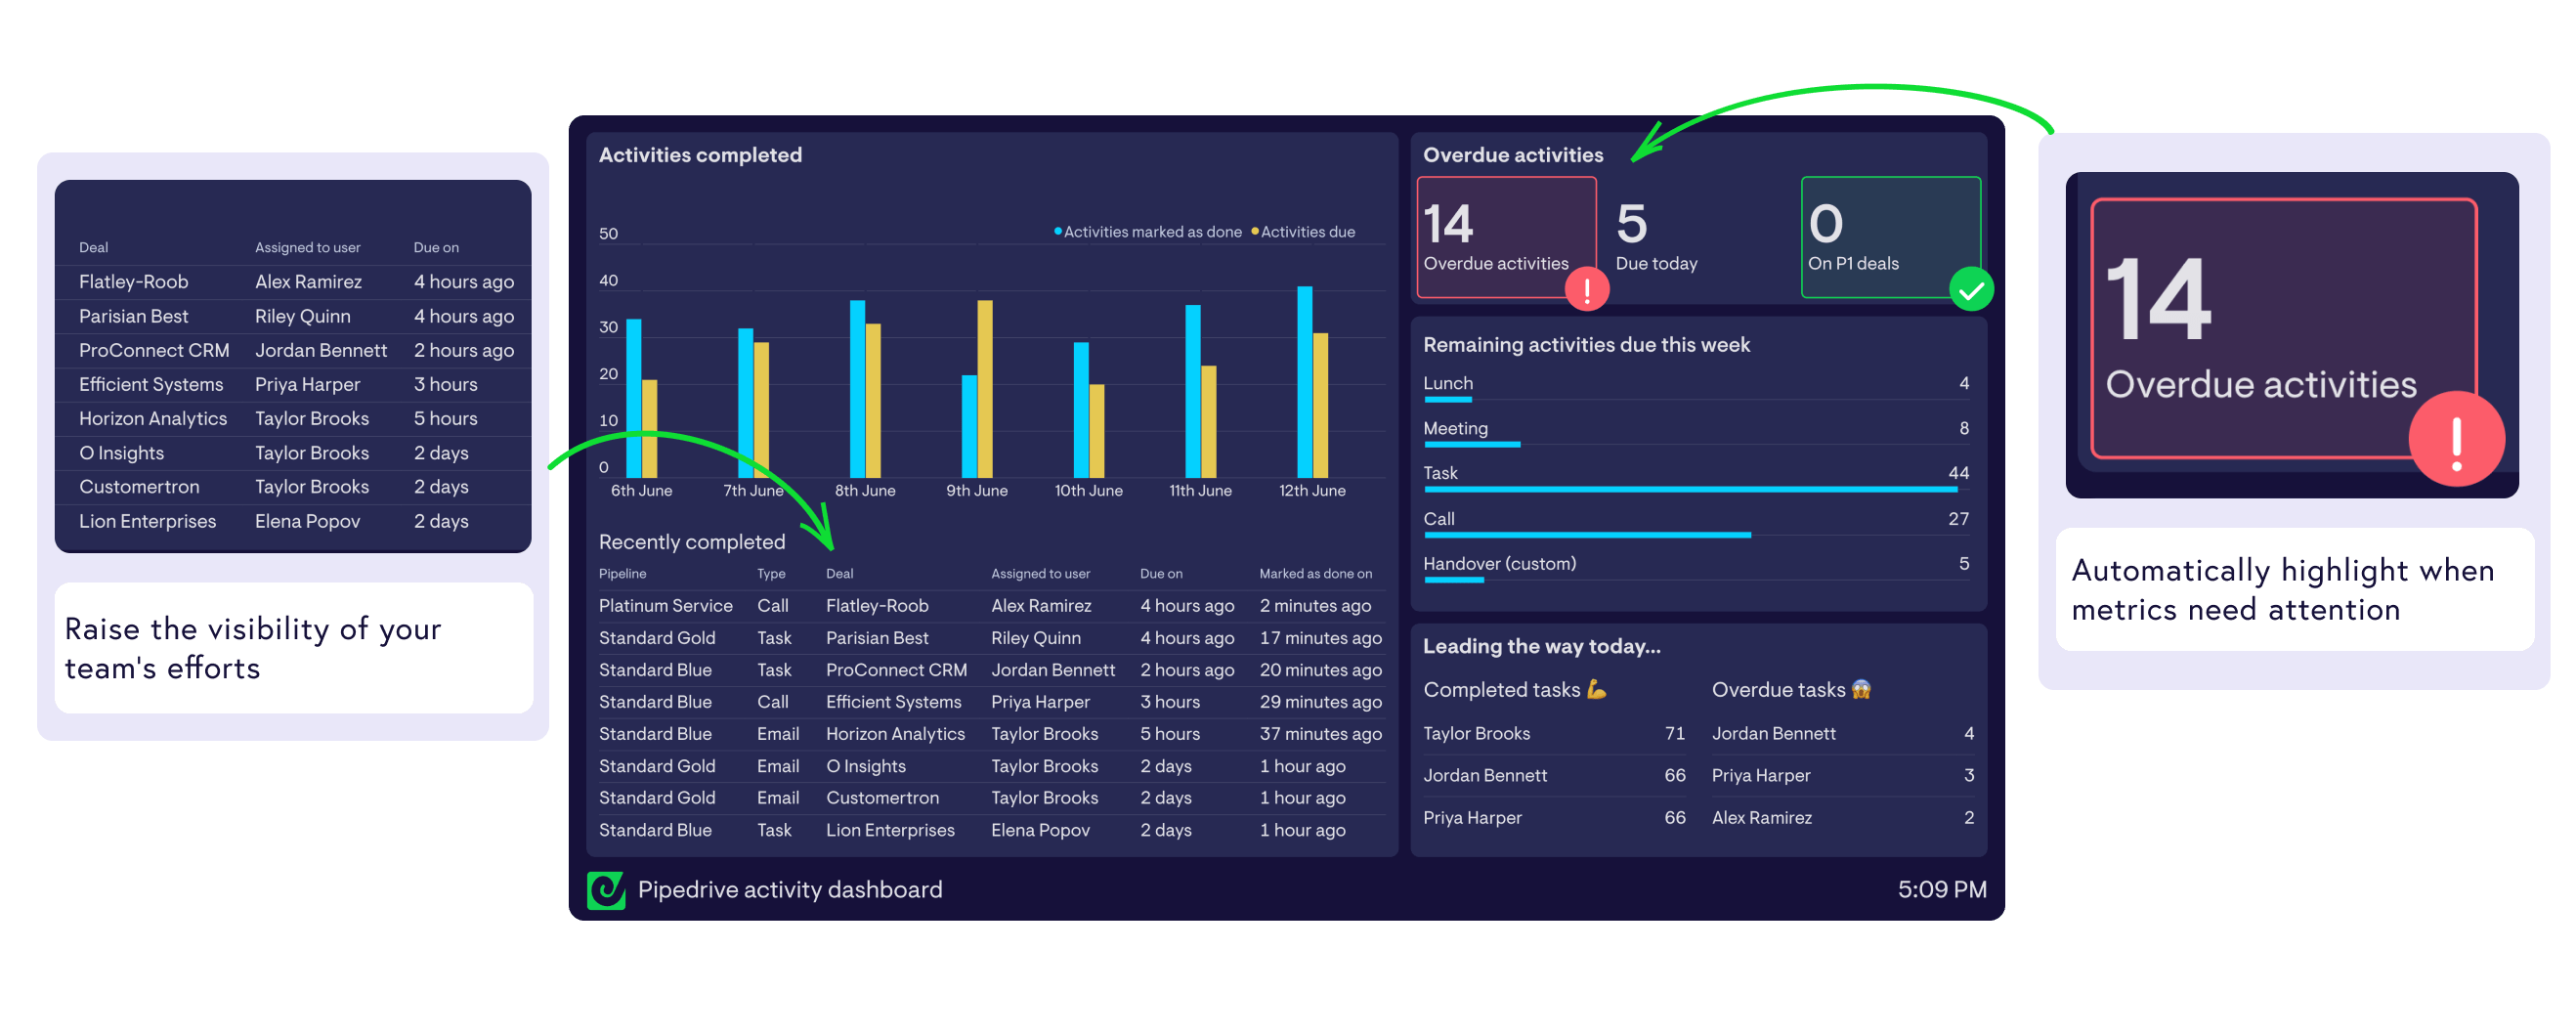
Raise the visibility of team KPIs, goals and pipeline data, all updating in real-time.
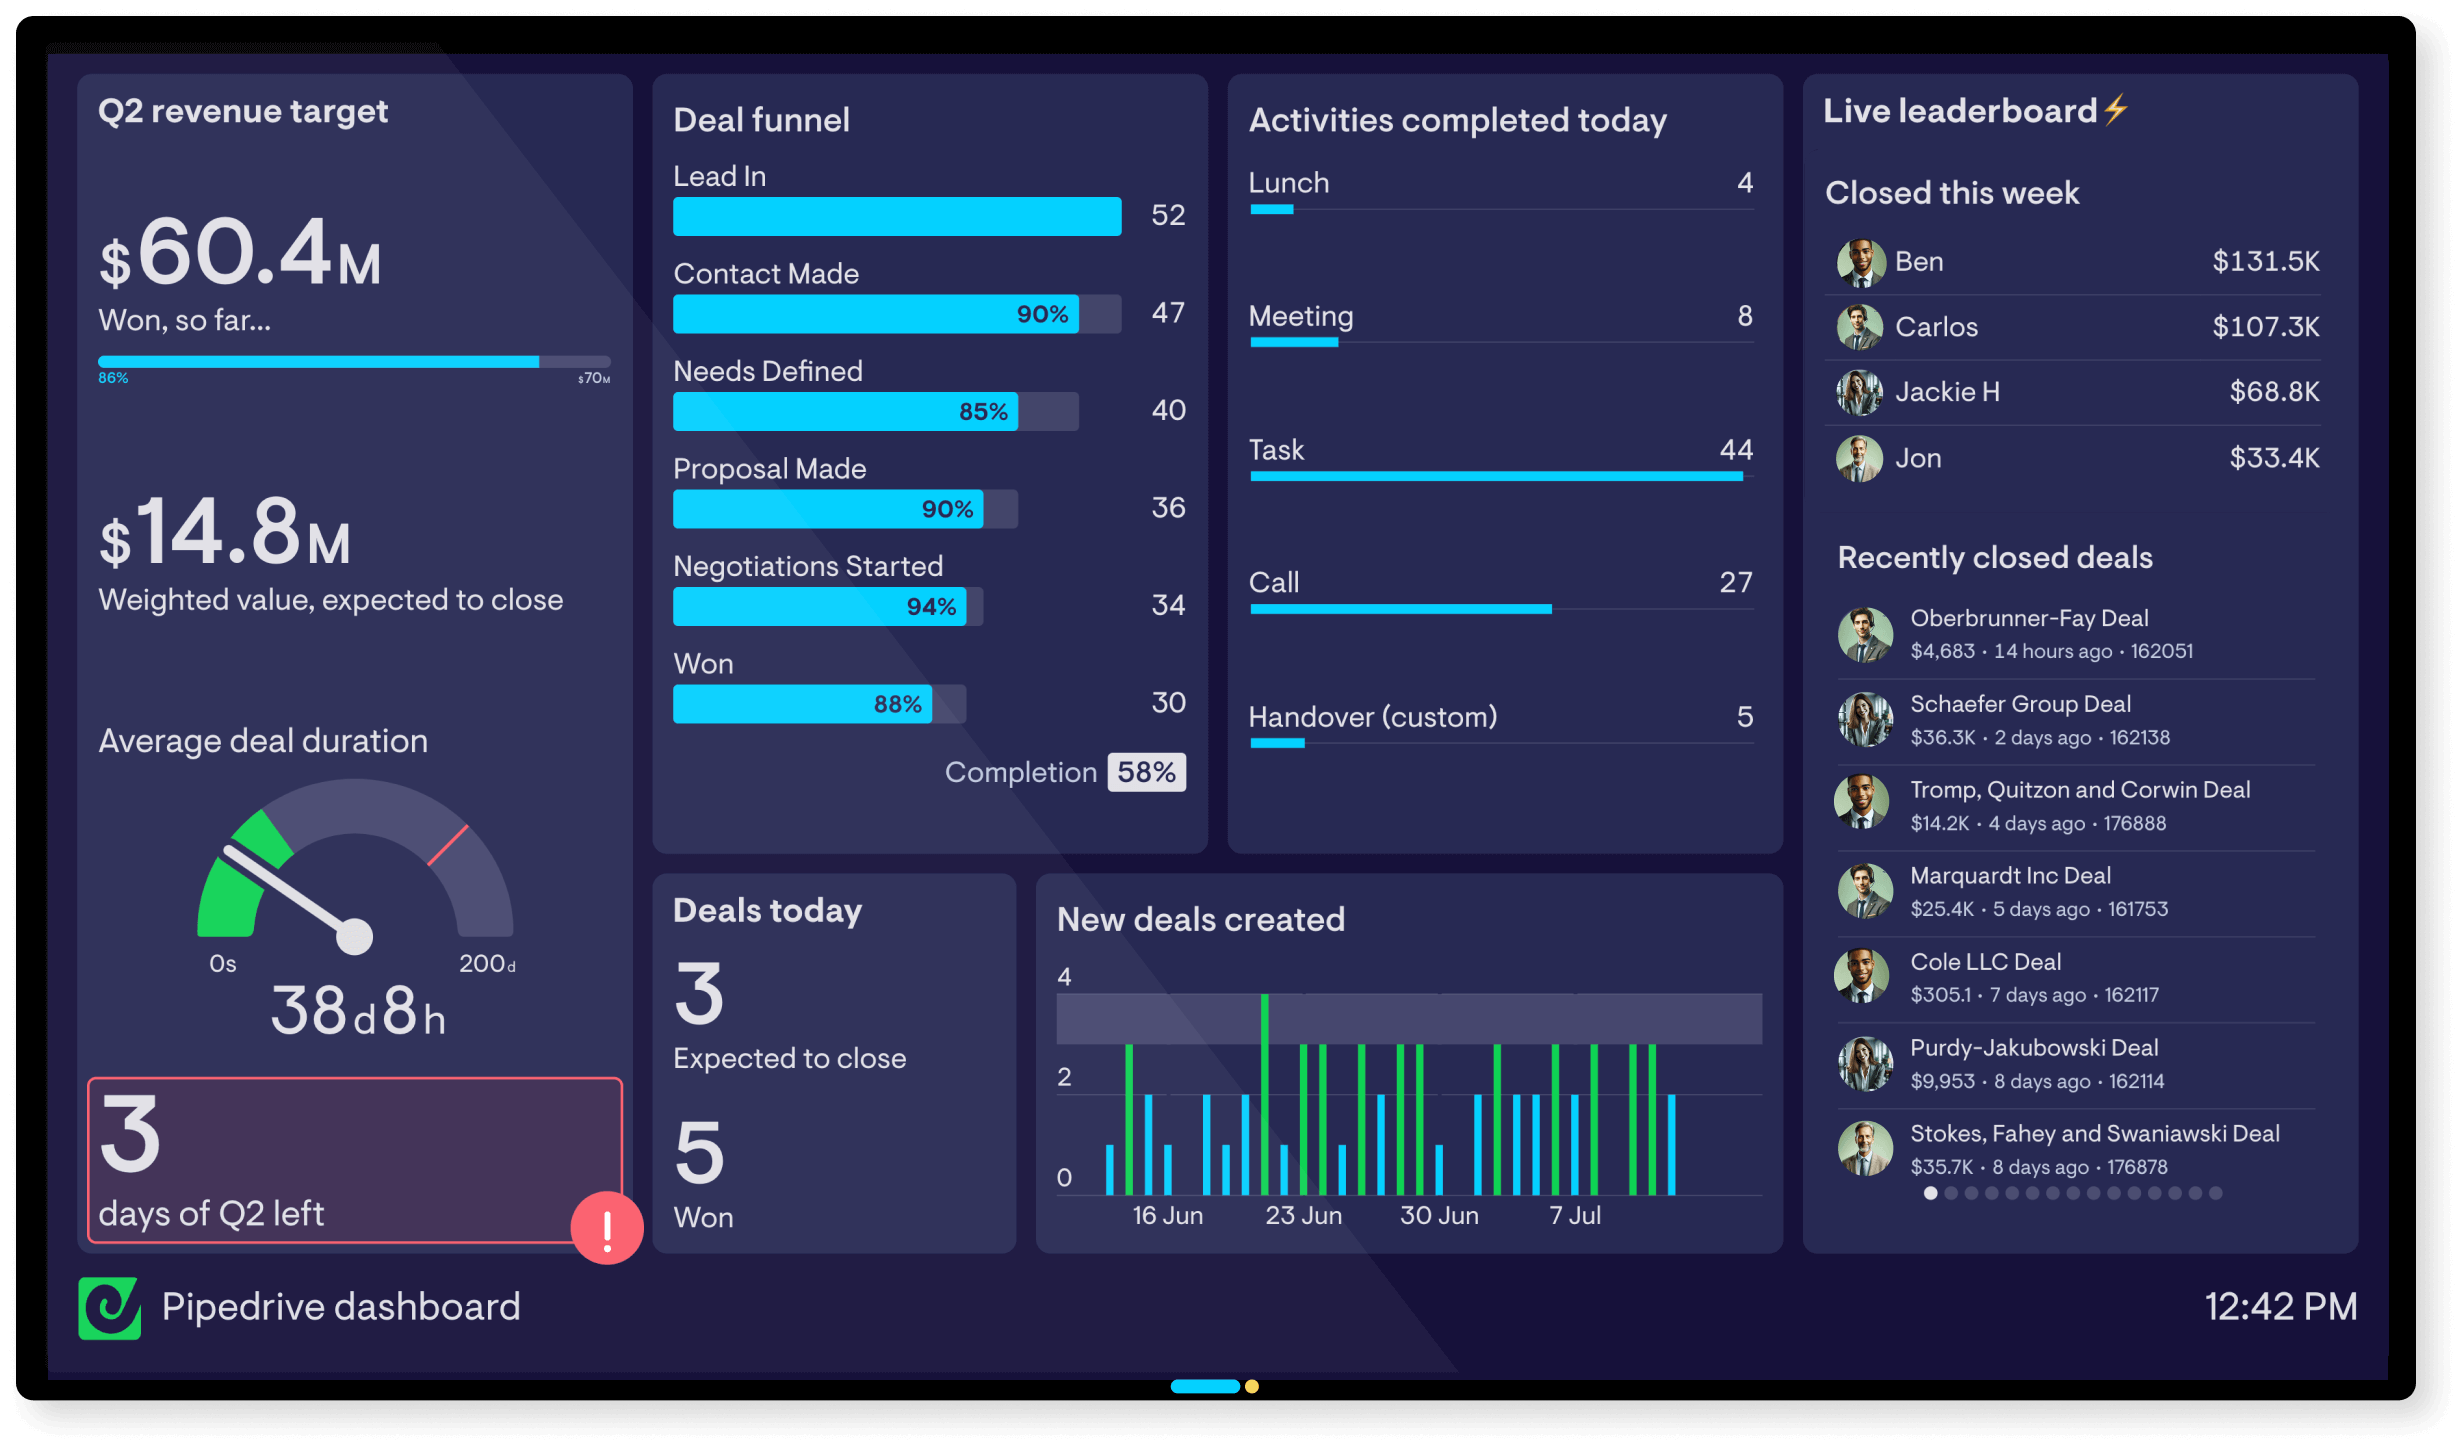
Updates instantly
See immediate impact when activities are completed, deals are won and goals are hit.
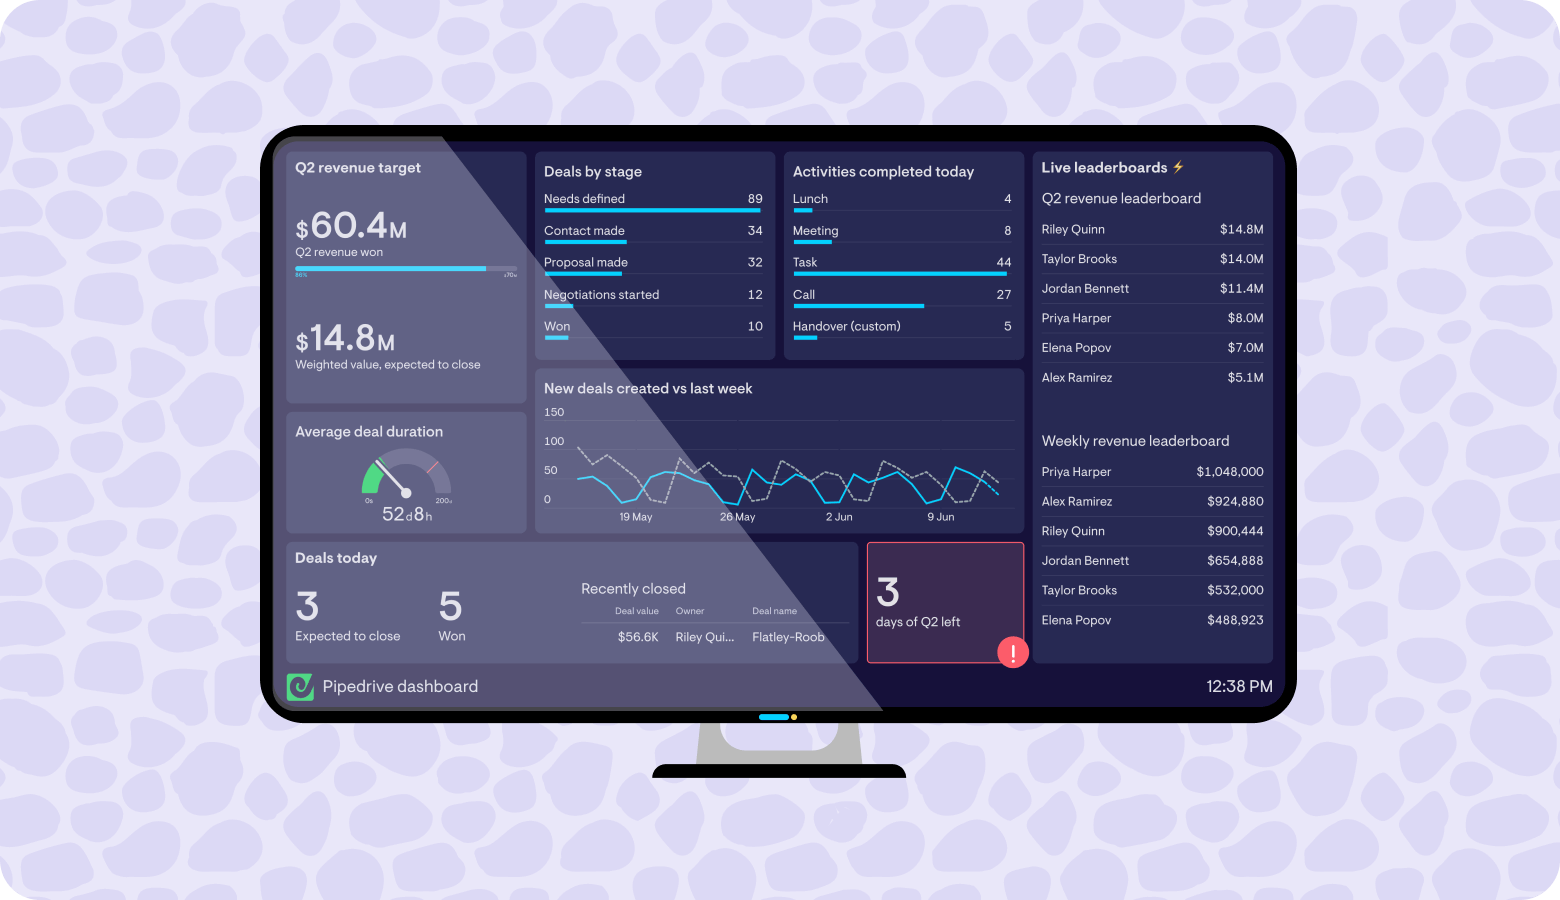
Tailored to your team
Showcase the metrics that matter, with powerful filters and support for custom fields in Pipedrive.
Designed to be shared
Display on TV, share on desktop, access on mobile.
Share real-time data with your team in under 15 minutes
Geckoboard integrates directly with Pipedrive to make visualizing sales KPIs a breeze.
Pull live data from Pipedrive
Securely connect your Pipedrive account to Geckoboard to start visualizing sales and activity data.

Fine-tune to focus on the KPIs you care about
Apply filters to zone into specific areas of performance.

Compare performance
Show how metrics have changed over time and compare between teammates.
-
Live TV dashboards made easy
Display Pipedrive dashboards on TVs and large screens around your workspace. We’ve made it easy with simple, affordable hardware you can set up yourself. Learn more.
-
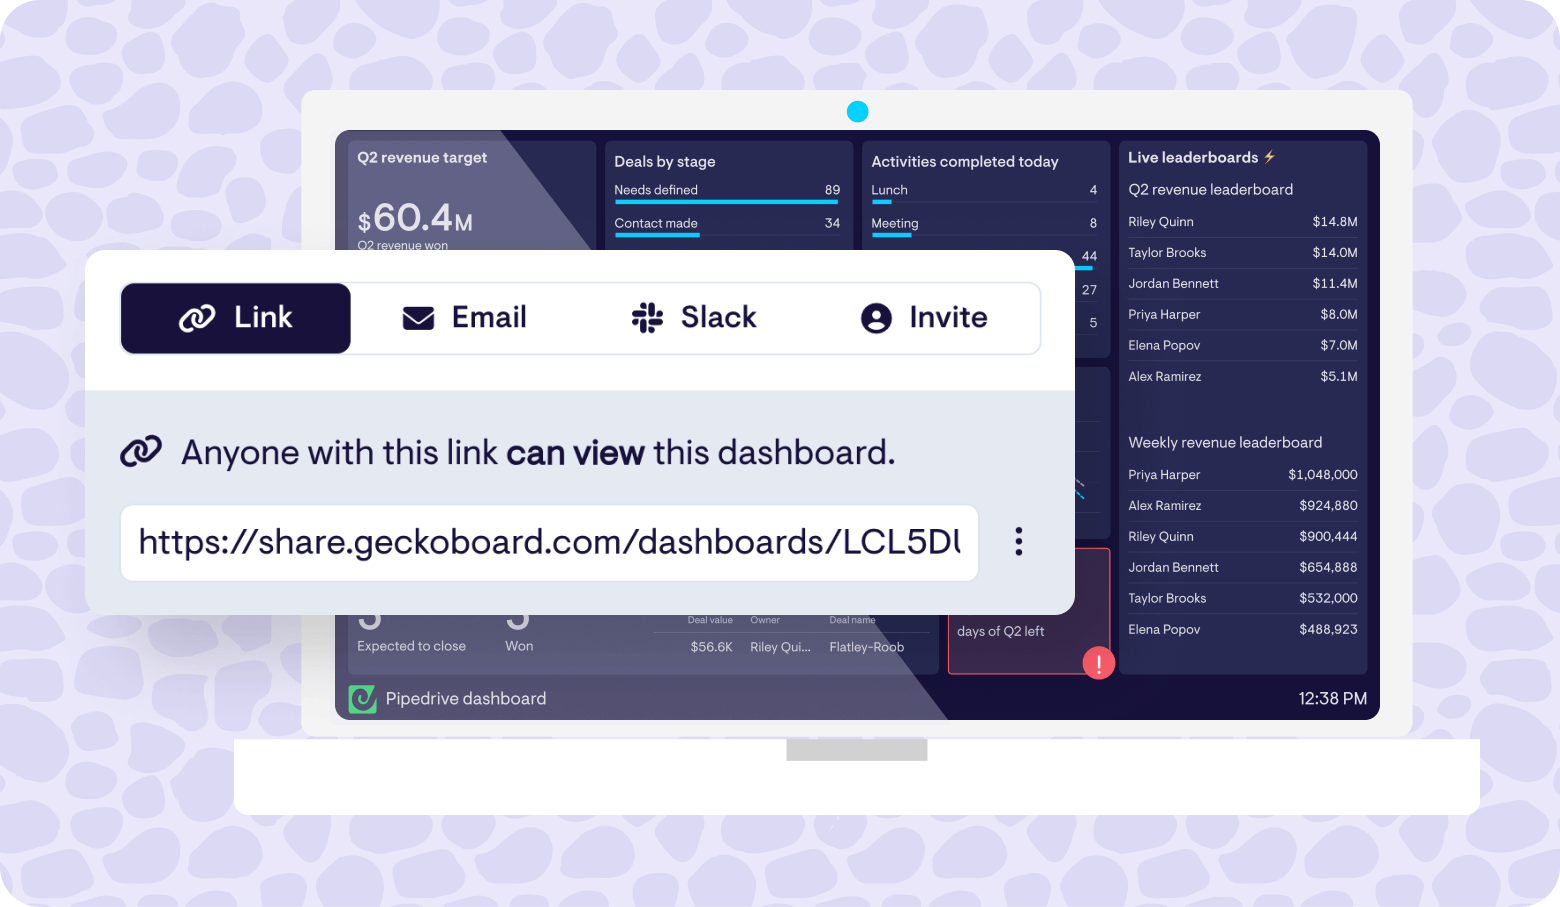
Keep remote teams in sync
Give access to live dashboards with just a link. ldeal for remote or hybrid teams who went to quickly access key data on desktop, or embed them in tools like Notion or monday.com.
-
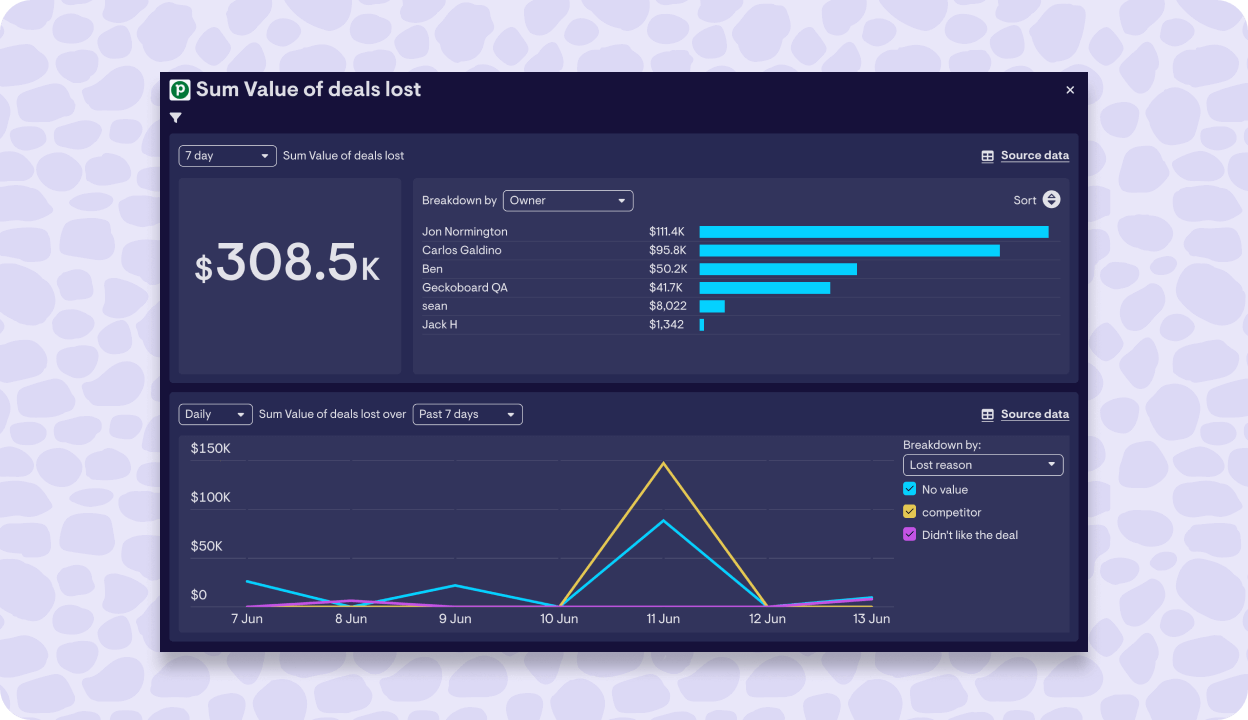
Speed up analysis
Spotted something on your dashboard that needs investigating? Explore different dimensions to your data and drill into the specific deals involved from Geckoboard.
-
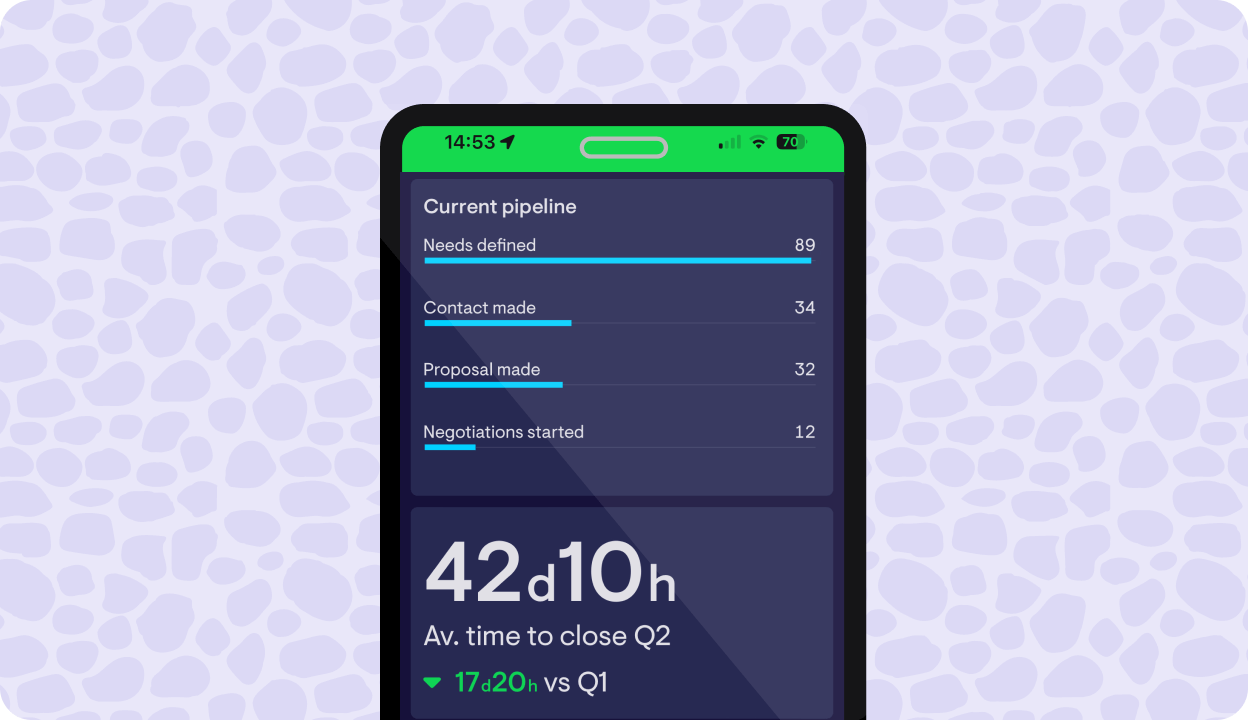
Access data on the go
Access mobile-friendly versions of your Pipedrive dashboards using a smartphone or tablet. Learn more.
-
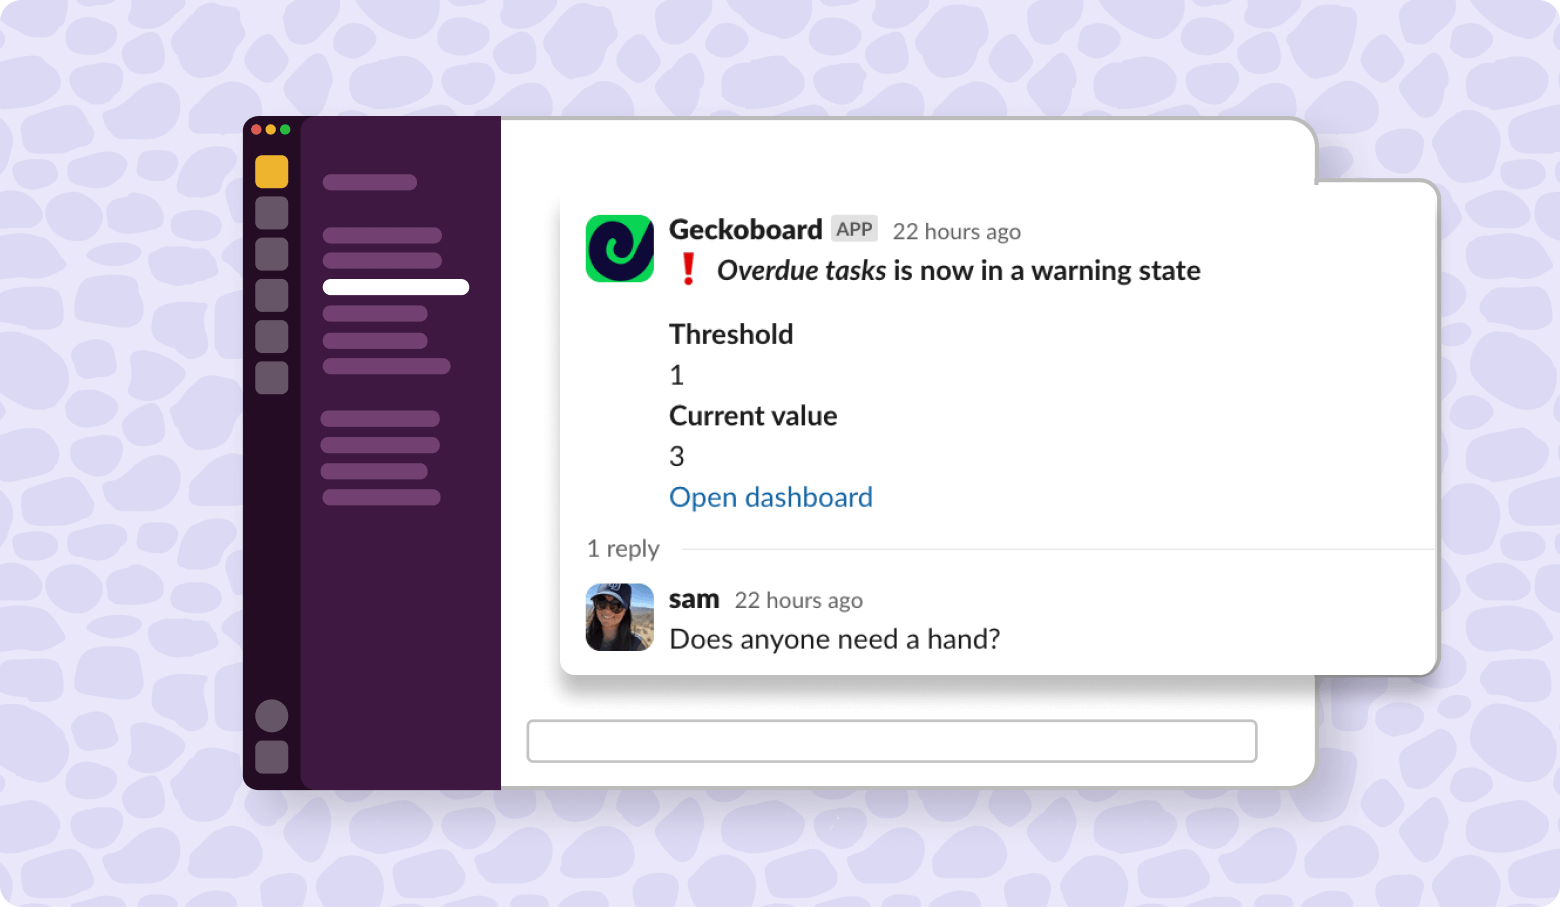
Get alerted in Slack when KPIs change
Connect Slack to Geckoboard to get notified immediately when something needs your attention - from bottlenecks in your pipeline to hitting hard-won goals. Learn more.
-
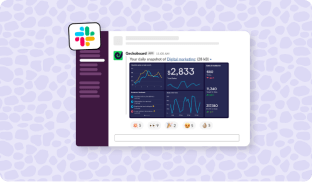
Schedule reports
Schedule snapshots of your Pipedrive dashboards to send automatically over email or post to Slack. Learn more.


Bring KPIs together from 90+ sources
Add live data from over 90 other business tools alongside your Pipedrive data and monitor everyone in one place.


Pipedrive dashboard examples built with Geckoboard
FAQ
What Pipedrive metrics can I track?
Geckoboard connects directly to Pipedrive, allowing you to pull live data directly from your Pipedrive account. Popular metrics that are supported include deals (created, won, lost, expected to close…), value of deals and weighted value of deals, activities (created, due, marked as ‘done’, duration…), lists of deals and activities and more. Most metrics can also be filtered by the following dimensions to give even more precision - specfic pipeline, deal owner, creator, status and more. Filtering by custom fields you’ve set up in Pipedrive is also supported. The best way to check if a specific Pipedrive metric is supported by our integration though is to try it yourself for free. Alternatively, ask our friendly support team.
What sort of dashboards can I create?
Geckoboard is ideal for creating a real-time view of metrics that you, your team or stakeholders should be regularly monitoring. This can include data from several Pipedrive pipelines, and other data sources too. Examples might include dashboards containing live leaderboards showing this quarter’s top closers as well as a handful of other high-level metrics, dashboards focusing on the health of your pipeline, or using data sources like Aircall to show a live view of calls and activities occuring throughout the day. For inspiration, check out our dashboard examples.
How real-time is Geckoboard’s Pipedrive integration?
Pipedrive widgets update within a second or two of data being updated in Pipedrive itself. See this help article for refresh rates of all our other data sources.
Can I connect multiple Pipedrive accounts?
Absolutely, and you can add metrics from different Pipedrive accounts to the same dashboard too.
What sort of support does Geckoboard offer?
Geckoboard is designed to be easy for anyone to use without any training or complicated setup. To help along the way, we’ve put together useful articles answering common questions, and for anything else, our friendly and knowledgeable team are on hand 24/5 to help you succeed with your dashboards, whatever time zone you’re in. Pro and Enterprise plans offer even snappier support, with priority support and dedicated support reps available.
How much does it cost?
You can try Geckoboard completely free for 14 days by signing up for a free trial - no payment details required. Plans then start from $60/month, with options for more dashboards, users and TVs on your account. View our pricing here.
Loved by data-driven teams at businesses big & small