SQL dashboard examples
An SQL dashboard lets you query data directly from your databases — MySQL, Redshift, and others — and display it alongside metrics from your other tools in one live view. It's the right approach when the data you need to track isn't available through a standard integration.
MySQL dashboard
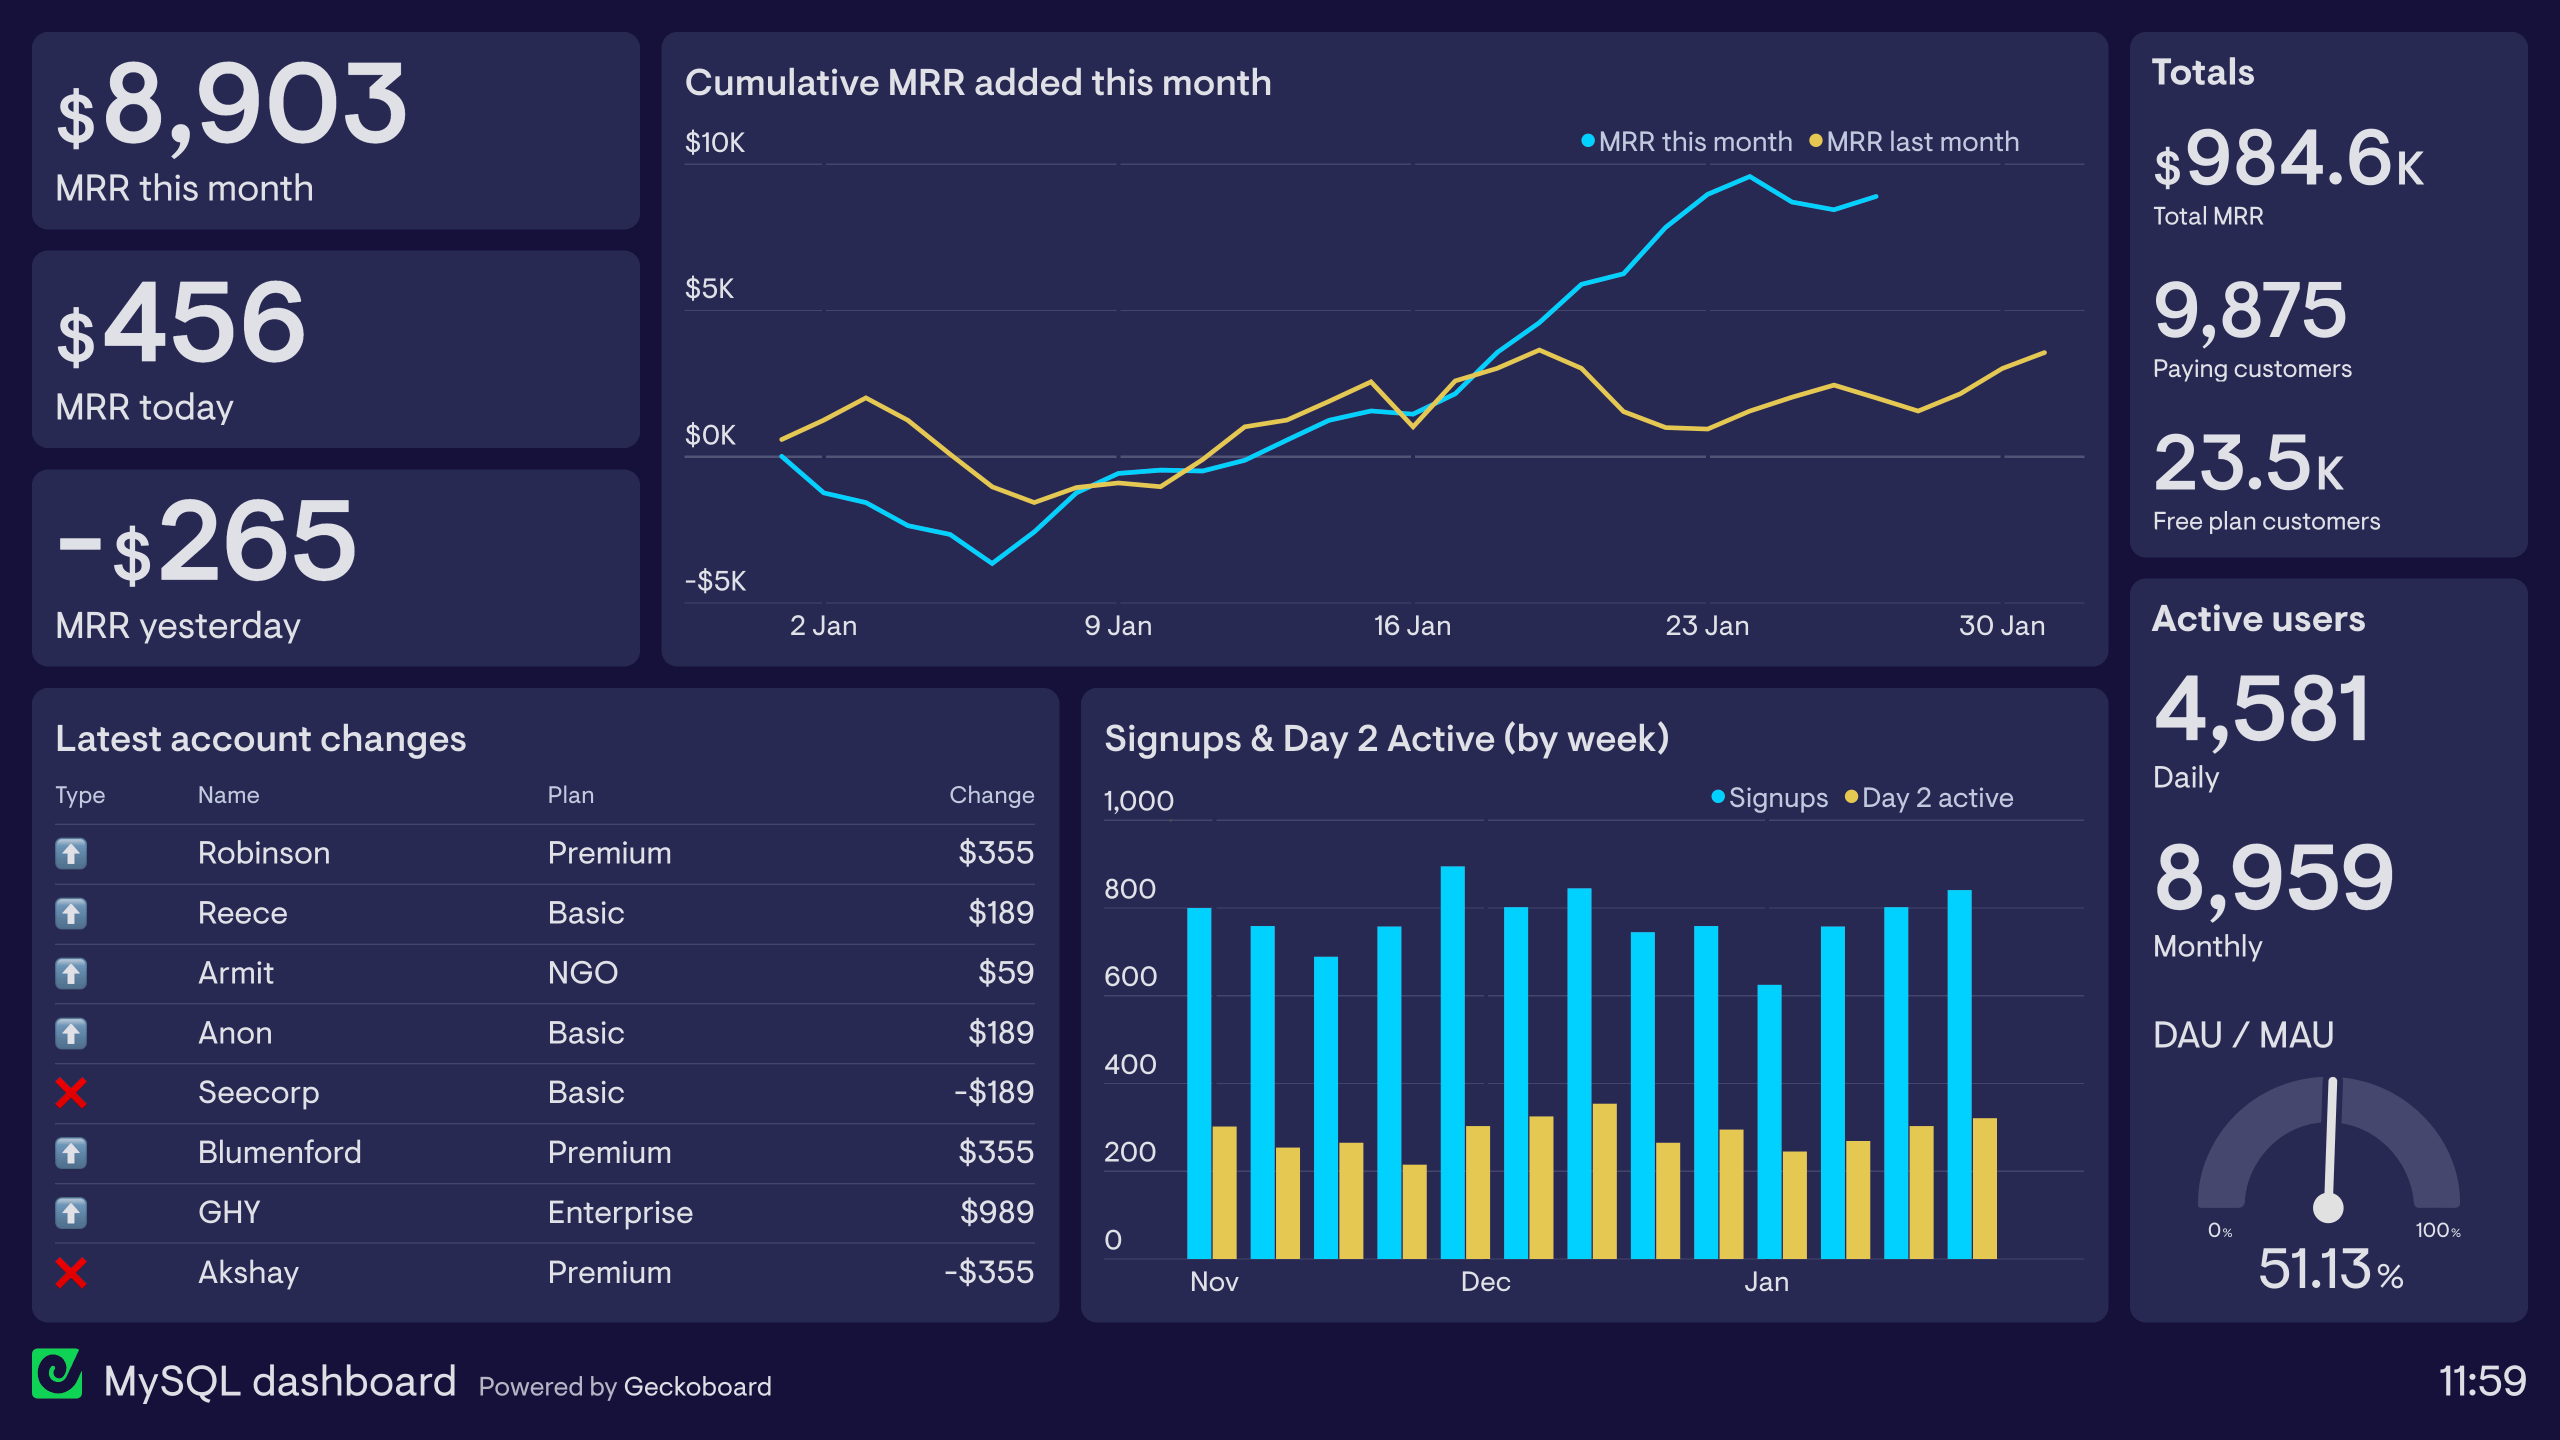
This dashboard has been created with data from a MySQL database. However, it also includes data from Mixpanel and Google Sheets. It’s been designed by a member of the company leadership team to keep the organization informed about the company’s growth and financial performance.
Primarily the dashboard focuses on Monthly Recurring Revenue (MRR), including how much MRR has changed recently, and which account changes have driven it.
The dashboard also includes some non-financial health metrics associated with the growth and performance of the company, including the number of new signups (including how many are still active on Day 2) and what proportion of the user base is active each day and each month.
PostgreSQL dashboard
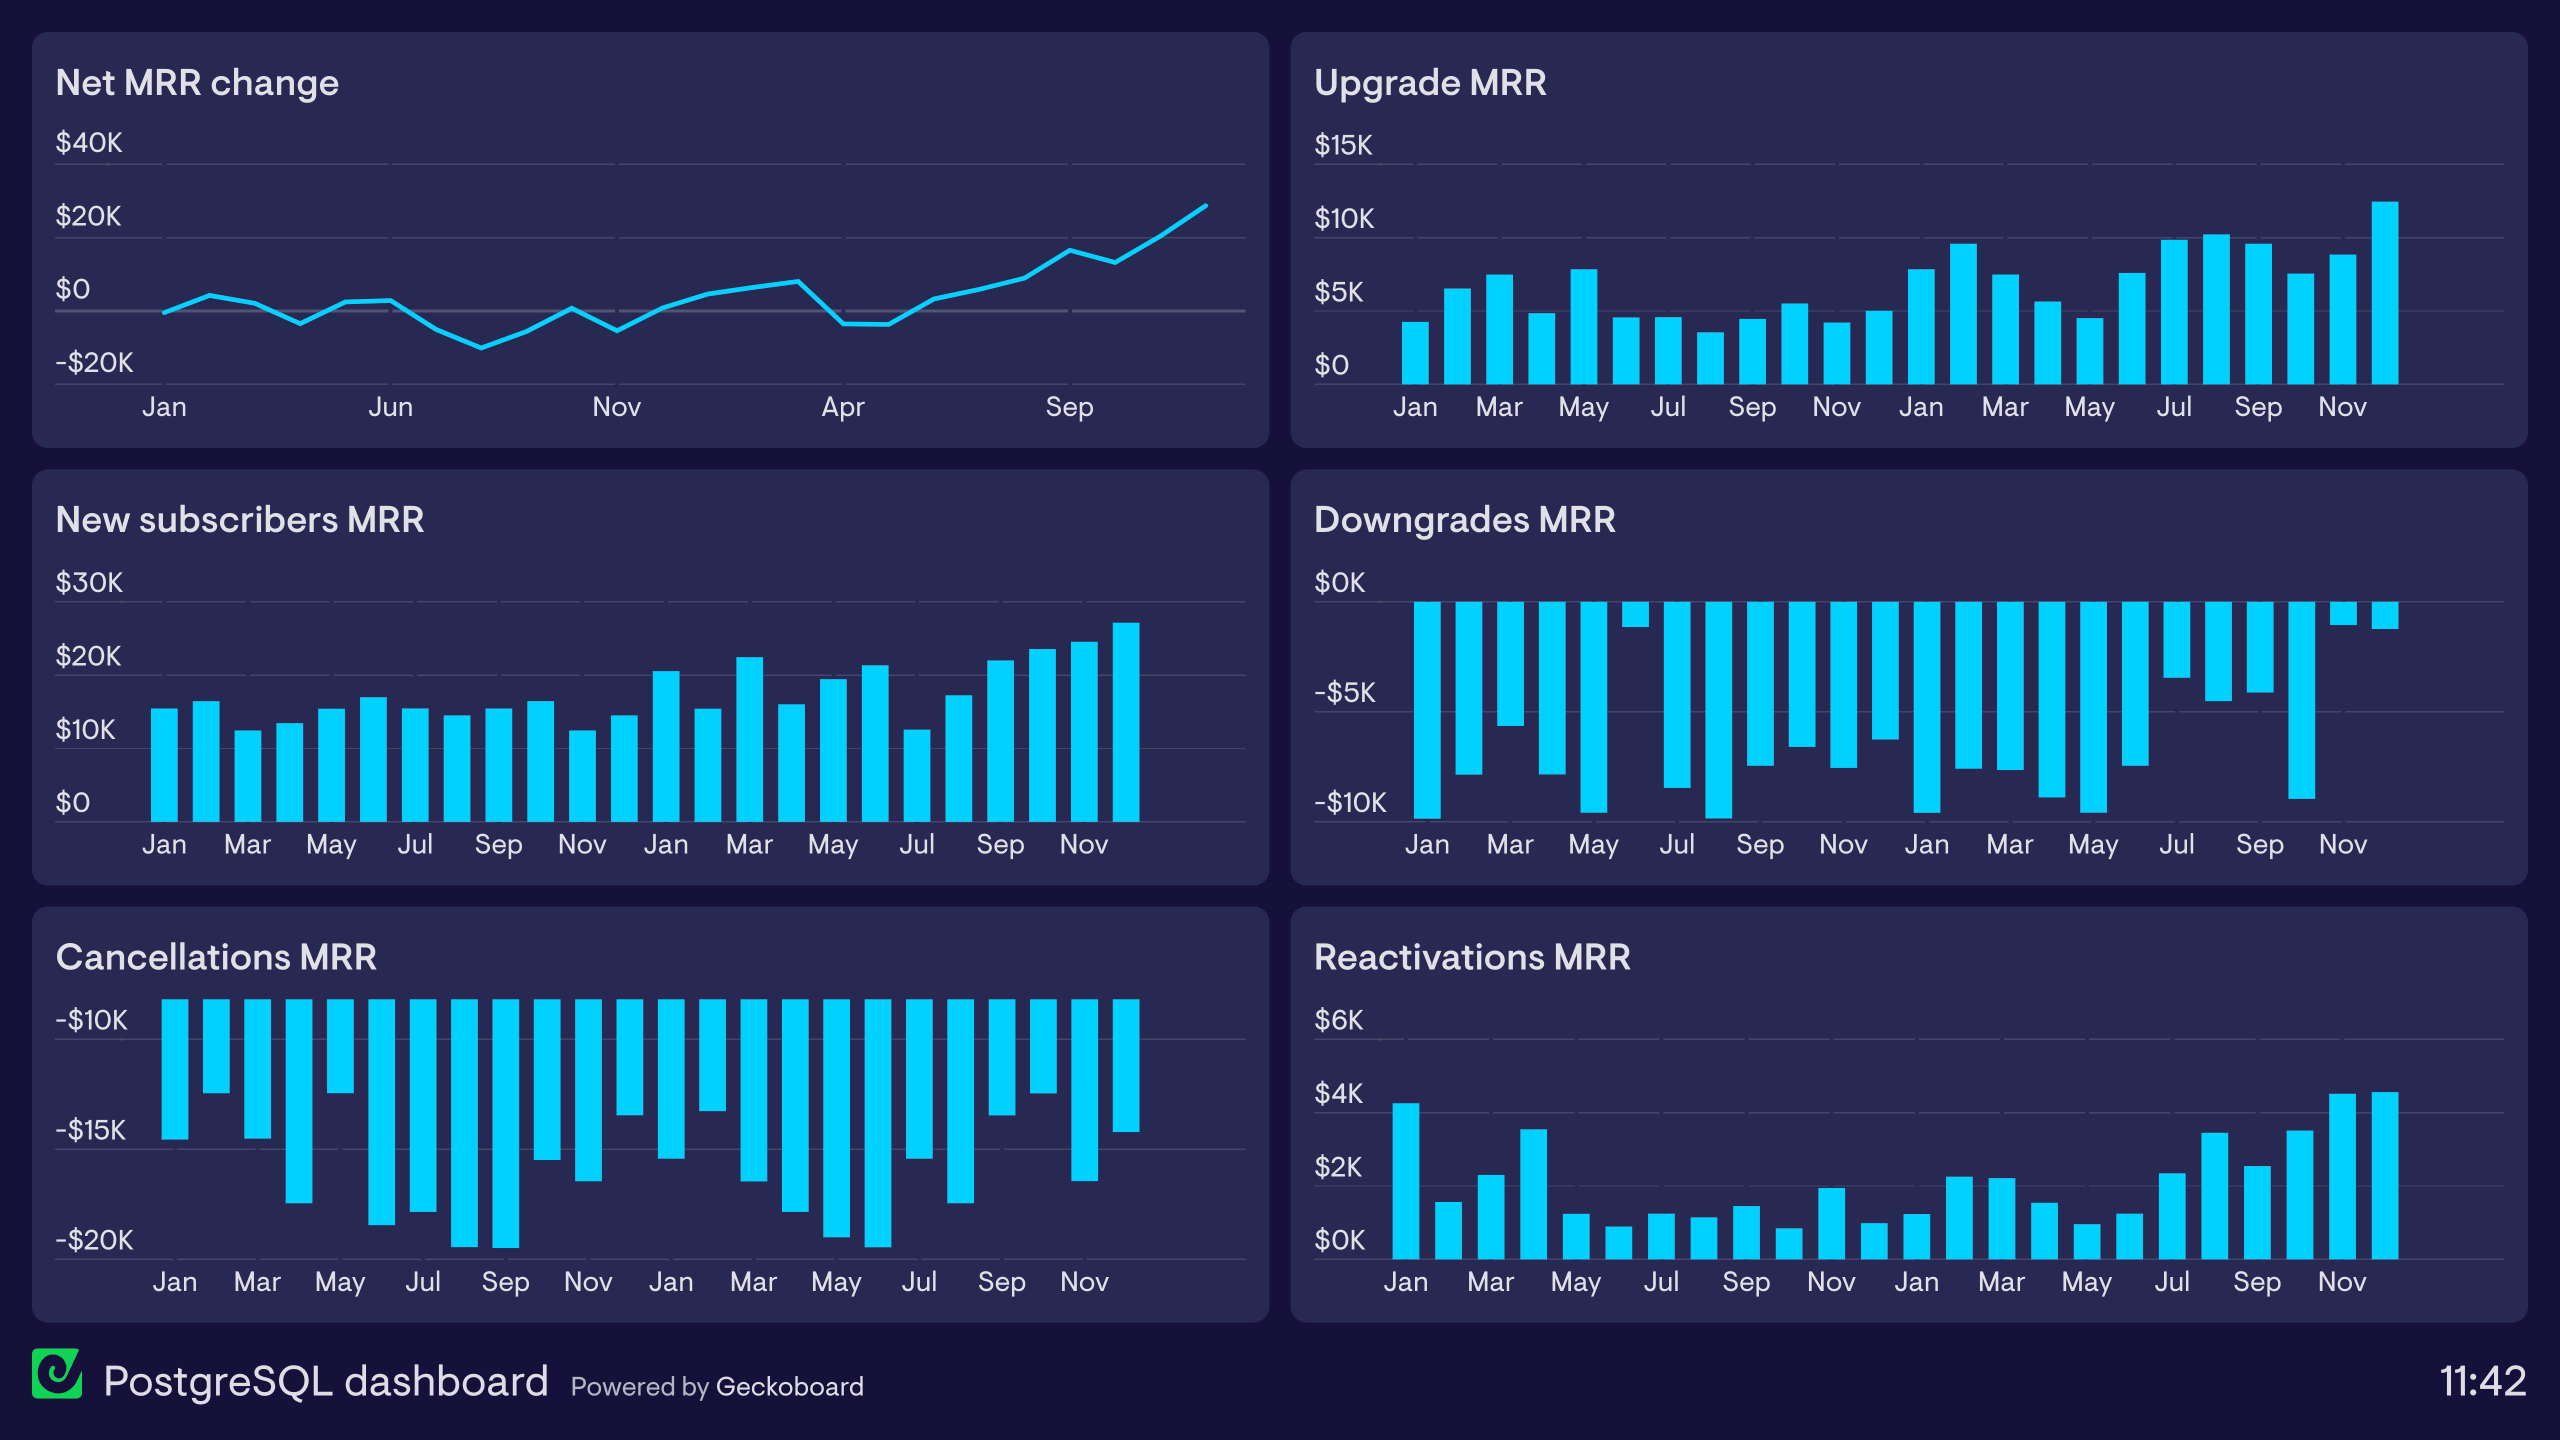
This dashboard has been built with financial data from PostgreSQL, however, it could easily be built in the same way with data from other databases such as Amazon Redshift, Snowflake and MariaDB.
The dashboard is designed to provide this SaaS company with a long term view of their financial performance.
Primarily, the dashboard tracks the net MRR change each month, ultimately showing if the value of the subscription base is growing or shrinking.
However, the dashboard also breaks down this figure into its constituent parts – MRR gained from new subscribers, upgrades and reactivations, as well as MRR lost from cancellations (churn) and downgrades.
Microsoft SQL Server dashboard
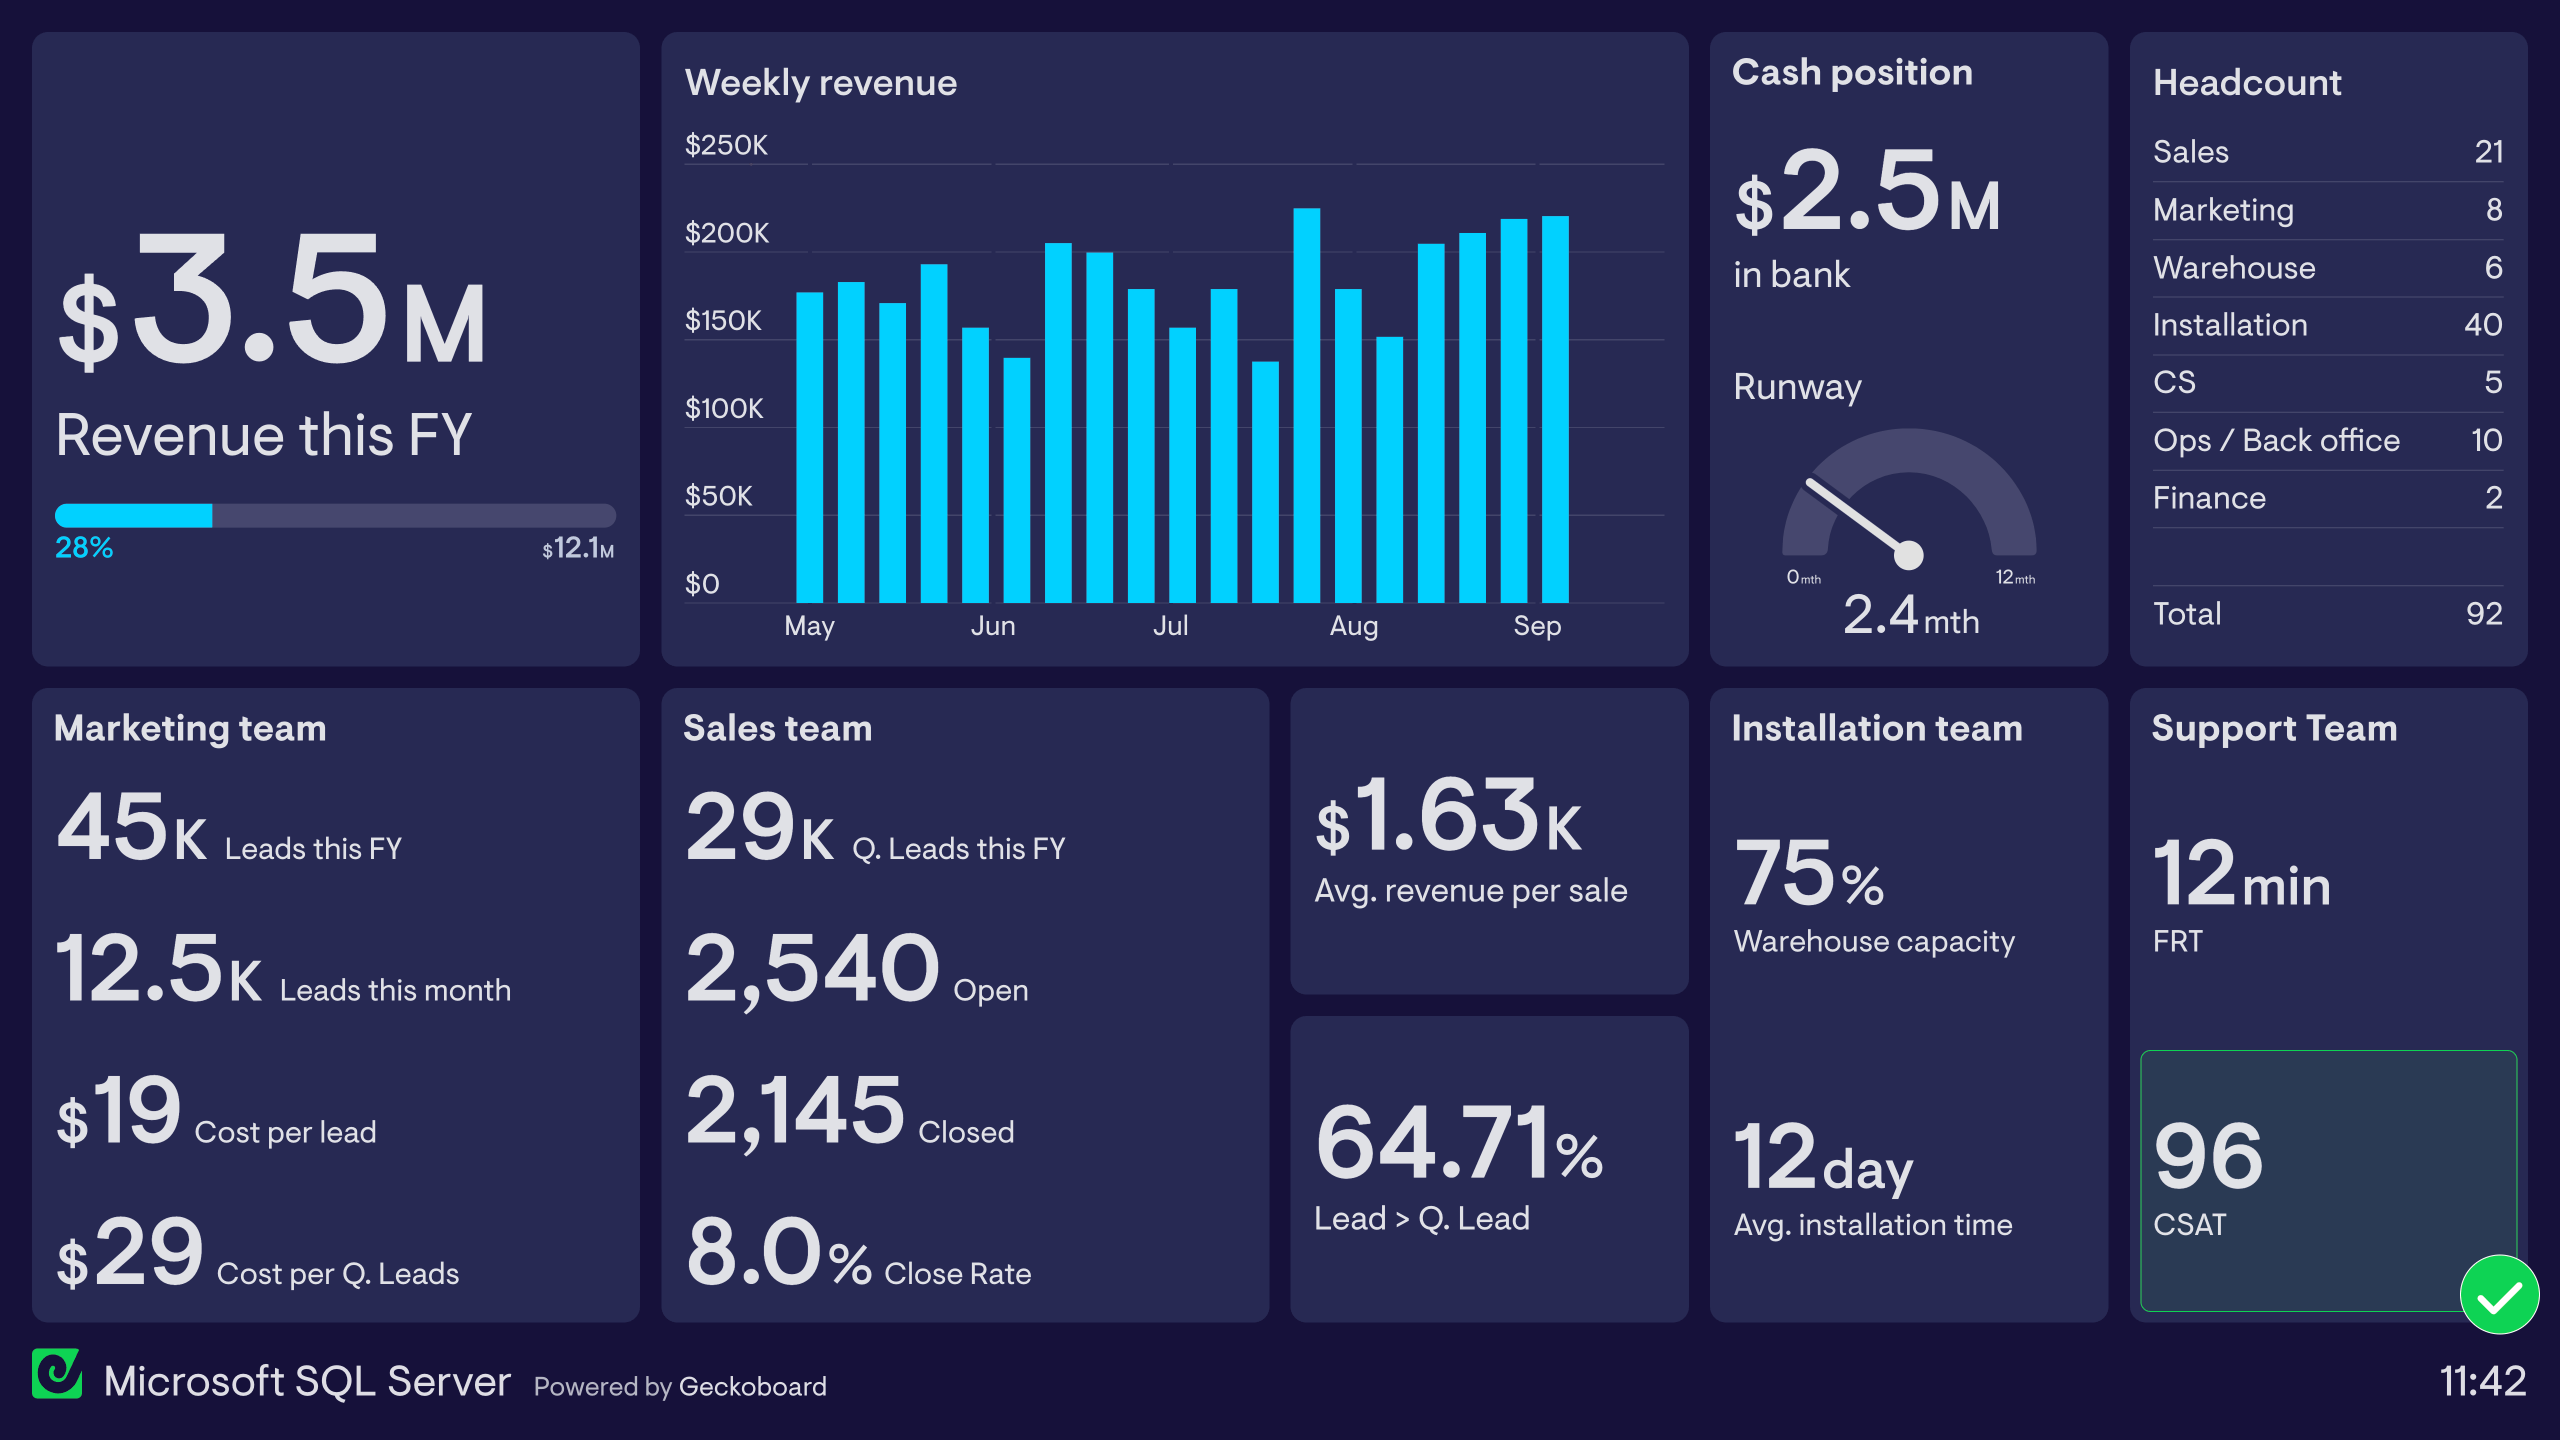
This dashboard is built with live data from Microsoft SQL Server. It also incorporates data directly from Salesforce, and Microsoft Excel.
The dashboard is designed to provide a view of the entire organizational performance, including key metrics from the Marketing team, Sales team, Installation team and Customer Support team.
This helps not only the CEO understand how her organization is performing overall, but also helps individual team members understand how their performance contributes toward the bigger picture.
Company dashboards like these can be a source of day-to-day motivation and common purpose, as the company aims to achieve their goals.
Browse other popular examples

A SQL dashboard connects directly to your database — MySQL, PostgreSQL, or Microsoft SQL Server — and displays the results of your queries as live, auto-refreshing visualisations. It's used by data-driven teams who want to build dashboards from custom data without being limited to what third-party tool integrations can surface.
Geckoboard is a live dashboard tool that lets you connect directly to SQL databases and display query results as live metrics on a shared screen. It's used by teams who need to surface custom data from internal systems alongside metrics from other tools — combining database queries with CRM, analytics, or support data.
Anything you can query from your database: custom KPIs, business-specific metrics, operational data, financial figures, and any combination of the above. SQL dashboards are popular for teams with unique data models that don't fit neatly into standard SaaS tool reports.
Building a custom SQL dashboard is straightforward with Geckoboard's dashboard builder. Connect SQL databases and custom data sources directly, and supplement with Salesforce, Google Sheets, or spreadsheets for additional data, then pick your metrics and build the view you need. Share with your team as a TV dashboard, shared link, or scheduled snapshot. Start a free trial or learn more about how Geckoboard works.
Use it to bring data together from your own database and third-party tools into one live view — without being constrained by what standard integrations can pull. It also helps deliver executive visibility into custom business metrics that matter to your organisation but aren't available in off-the-shelf reporting tools.