Warehouse dashboard examples
A warehouse dashboard shows live order and fulfillment data on screens around the warehouse floor — so the team can see what's coming, where demand is building, and whether they're on track to hit their targets. For people who are on their feet all day, a visible screen is the only practical way to stay in the loop.
Warehouse dashboard
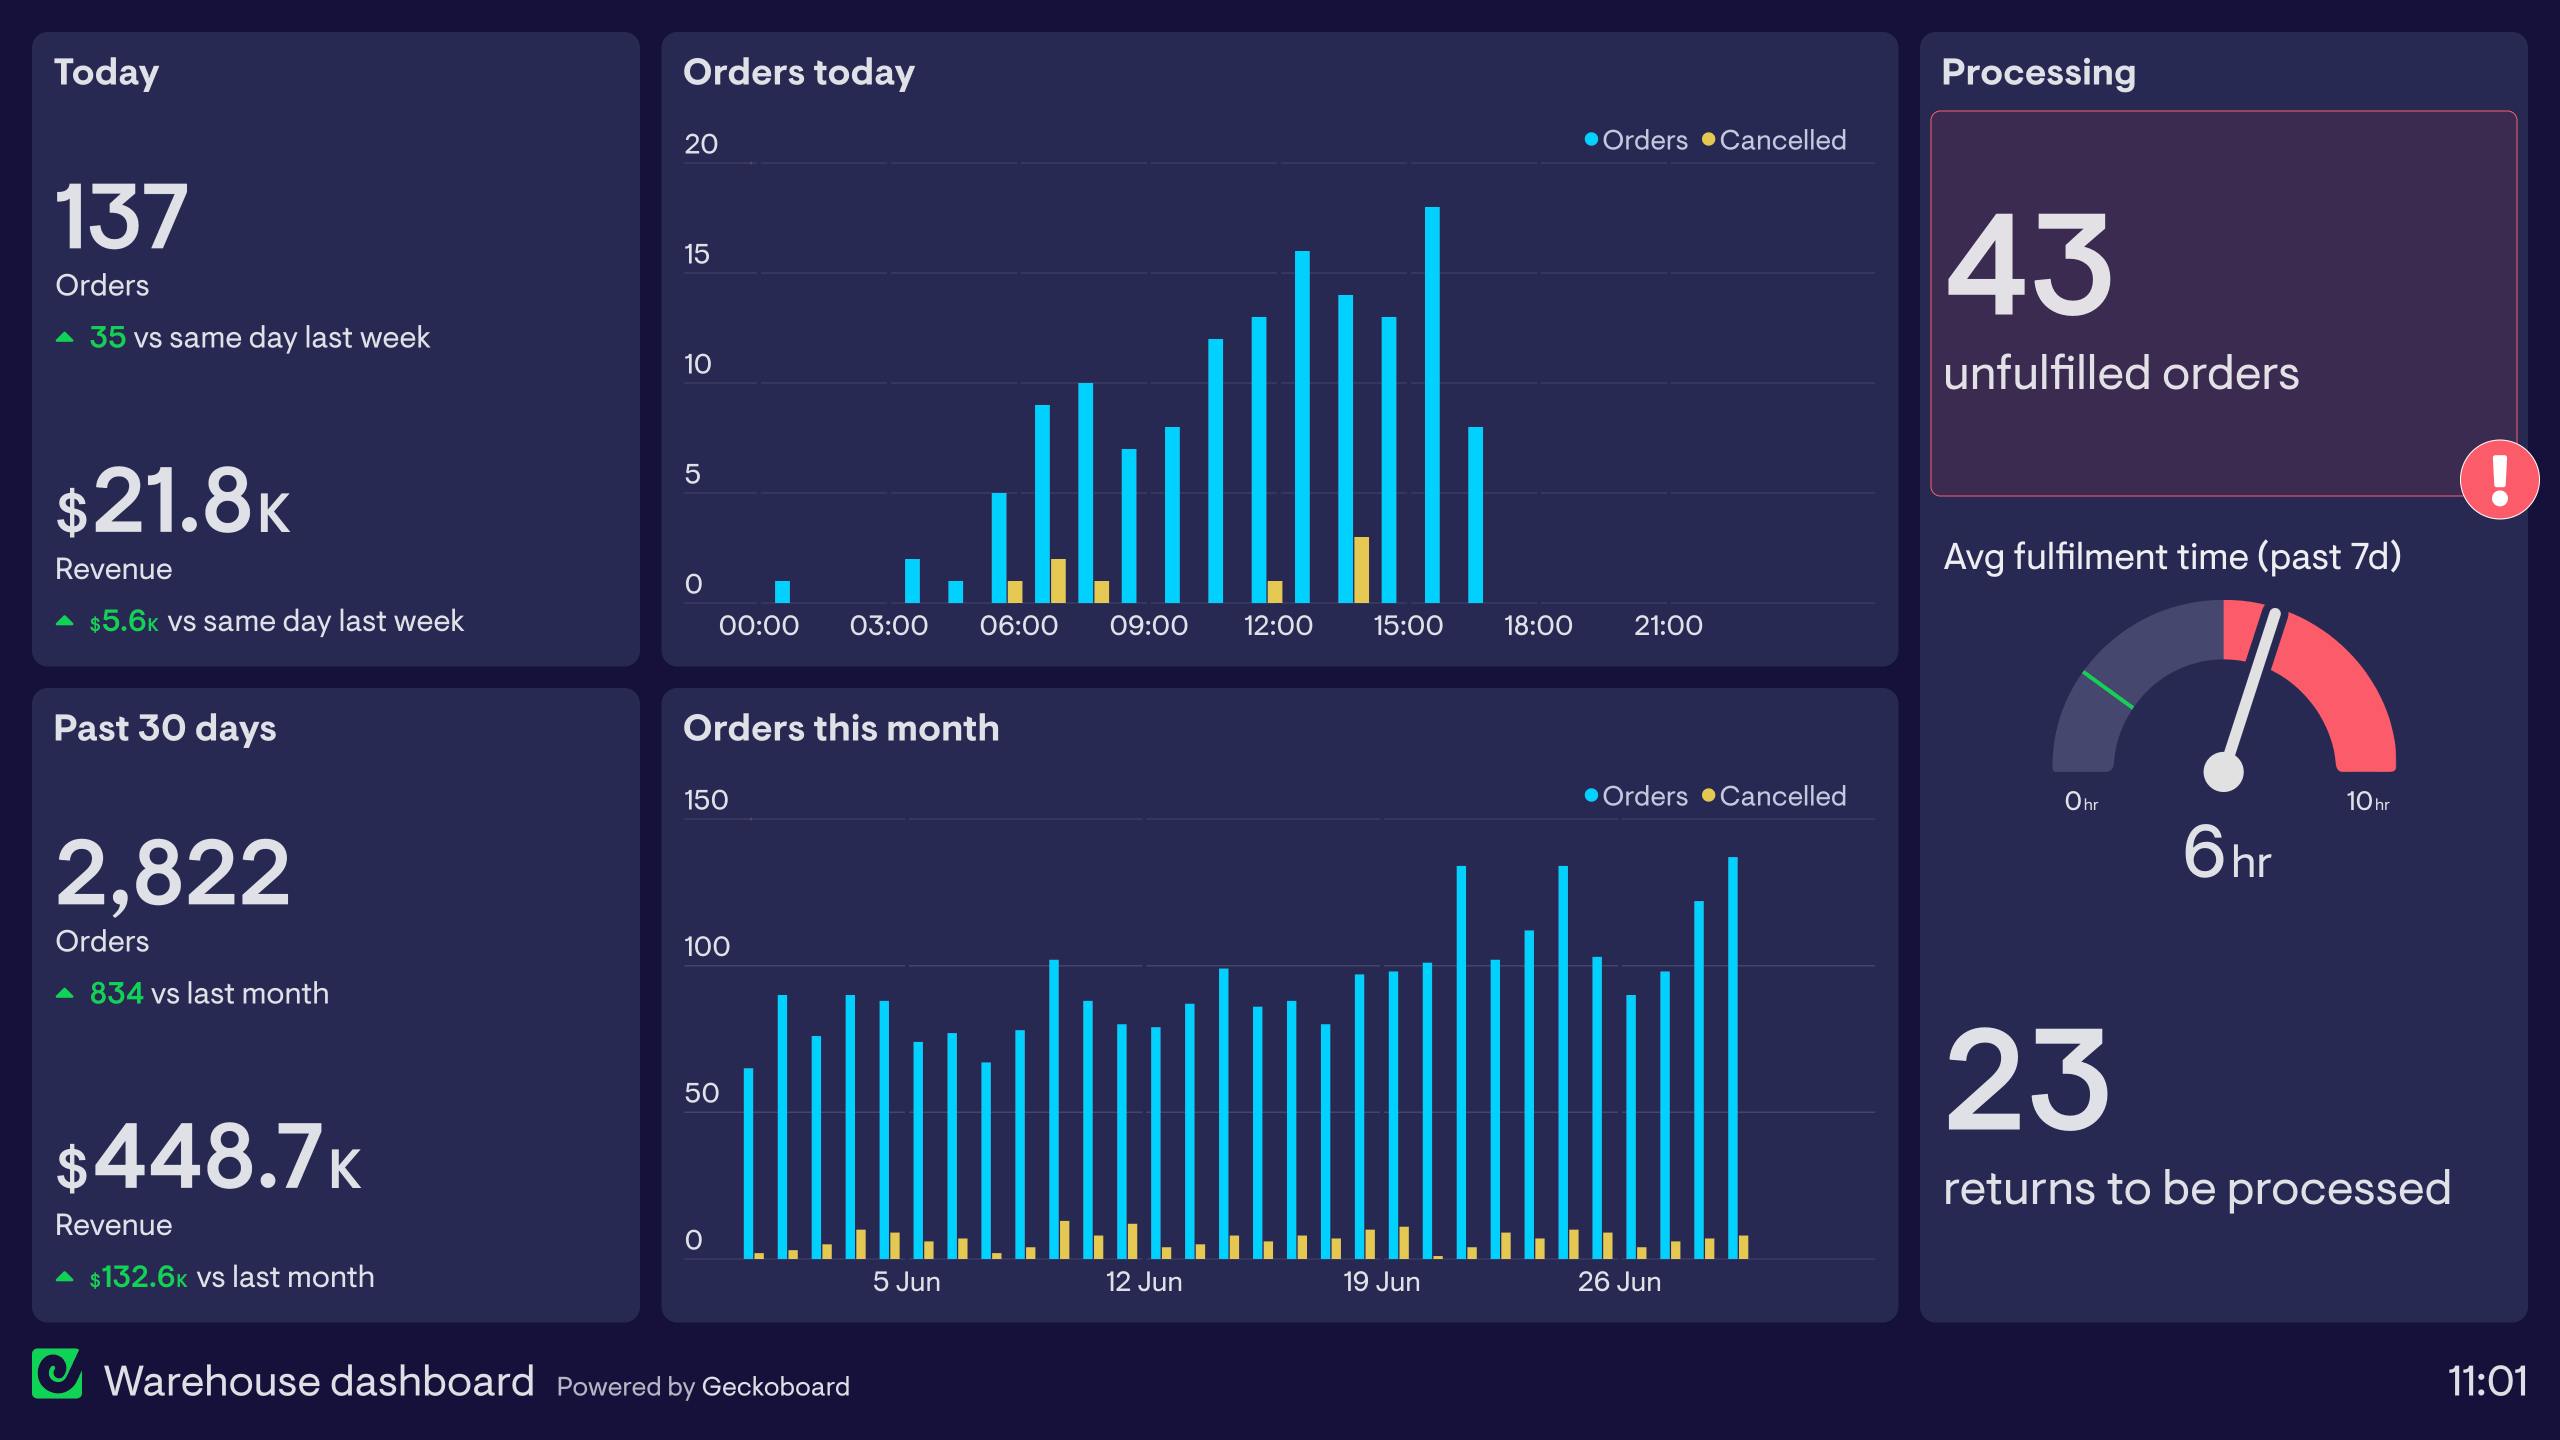
This warehouse dashboard example is taken from an ecommerce company. It displays live data from Shopify, their ecommerce platform. The dashboard helps fulfillment teams keep track of particularly busy periods, changing their approach to meet demand.
As they use the dashboard over time, the team builds up a familiarity with the metrics; they start to intuitively understand when busy periods are likely to be, or even when metrics are out of the ordinary.
The dashboard visualizes revenue generated. Some would argue that this is not necessary information, as the fulfillment team is primarily concerned with orders. However, using dashboards to communicate high-level metrics like these can have a motivating effect, because the teams using them begin to feel shared ownership for the company’s overall success.
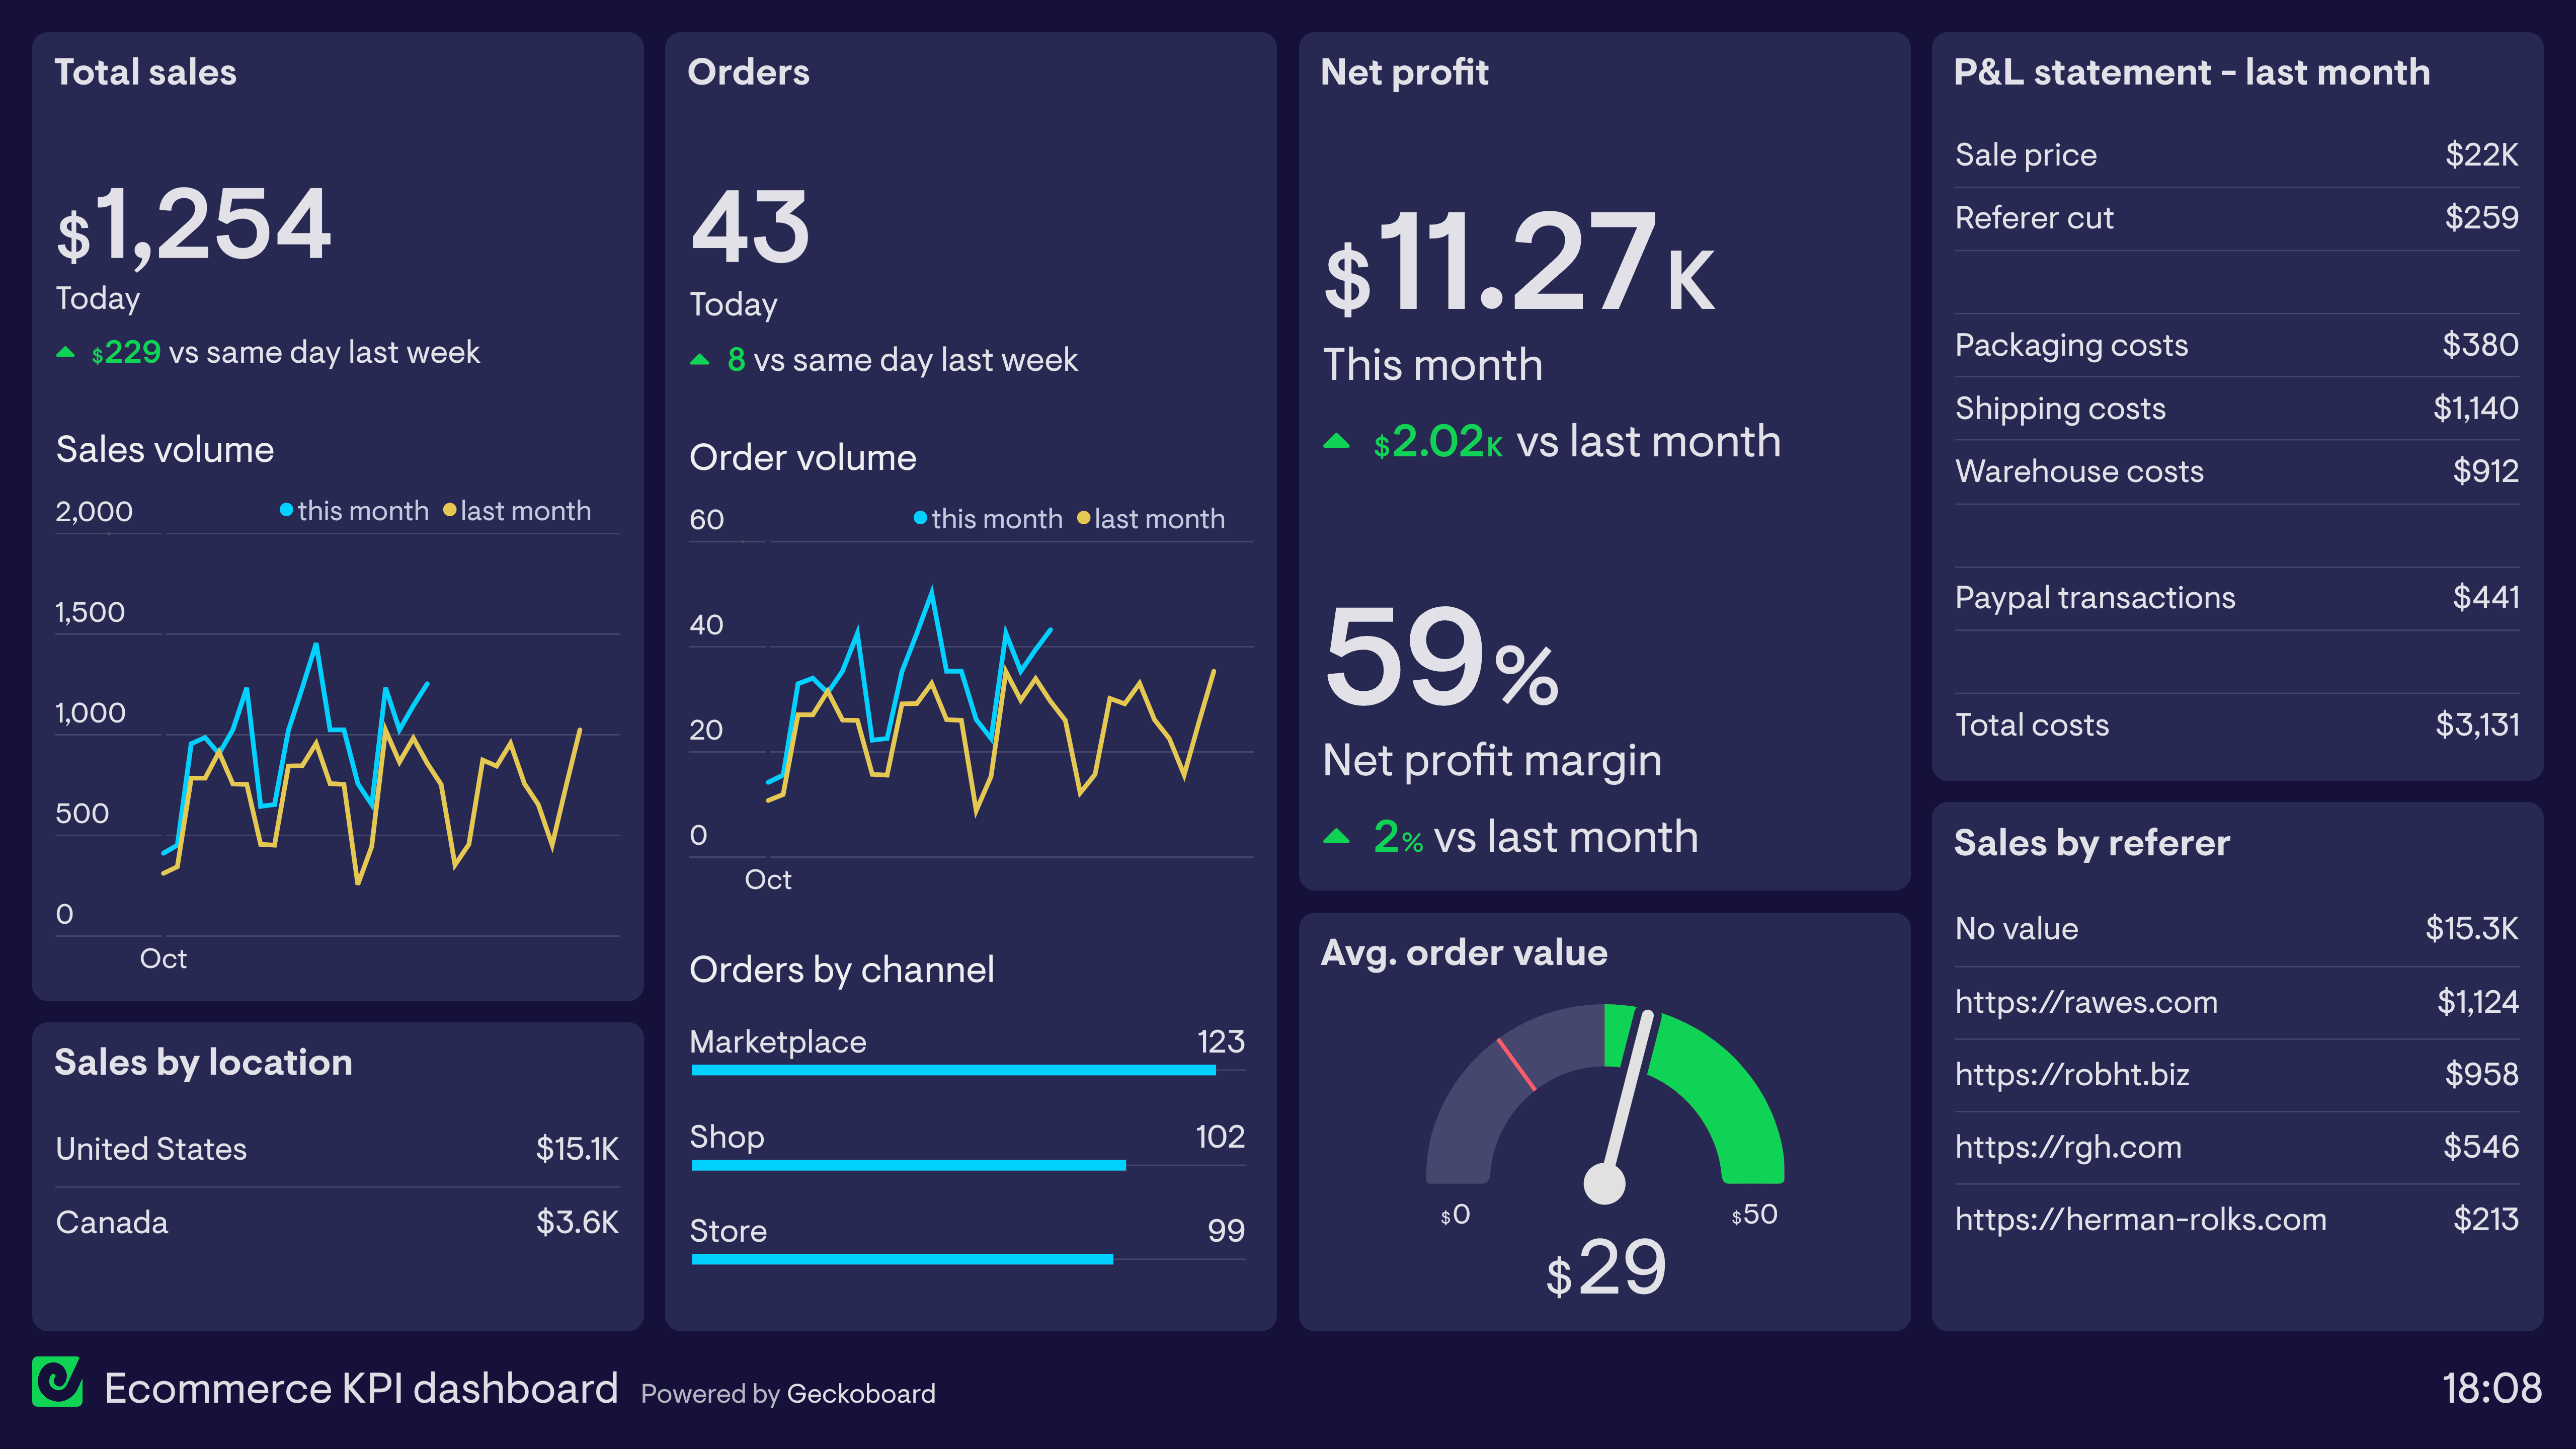
Browse other popular examples
A warehouse dashboard gives operations and logistics teams a real-time view of throughput, order fulfilment, and inventory levels across the warehouse floor. It helps managers track picking efficiency, identify bottlenecks, and ensure orders are shipped on time without relying on manual status checks.
Geckoboard is a live dashboard tool that connects to Shopify, spreadsheets, and order management systems and displays fulfilment metrics on screens around the warehouse floor. It's built for environments where the team is on their feet — making live operational data visible without needing to sit at a computer.
Common metrics include orders picked per hour, orders shipped today, fulfilment rate, stock levels, backorders, returns processed, and on-time dispatch rate. Teams managing multiple shifts often track these per shift or per team.
Building a custom warehouse dashboard is straightforward with Geckoboard's dashboard builder. Connect Shopify, Google Sheets, or spreadsheets to pull order and inventory data from your warehouse management or ecommerce system, then pick your metrics and build the view you need. Share with your team as a TV dashboard, shared link, or scheduled snapshot. Start a free trial or learn more about how Geckoboard works.
Use it to monitor performance in real time so warehouse managers can act on a fulfilment slowdown or stock discrepancy as it happens — not at the end of the shift. It also helps make team performance visible by displaying throughput and order completion rates on a floor screen that keeps pickers and packers motivated and accountable.