Sales opportunities dashboard examples
A sales opportunities dashboard gives a fast view of the prospects closest to closing — how many you have, where they sit in the pipeline, and what they're worth. It's most useful in high-touch sales roles where understanding the quality and momentum of each opportunity matters as much as the volume.
Sales Opportunities dashboard
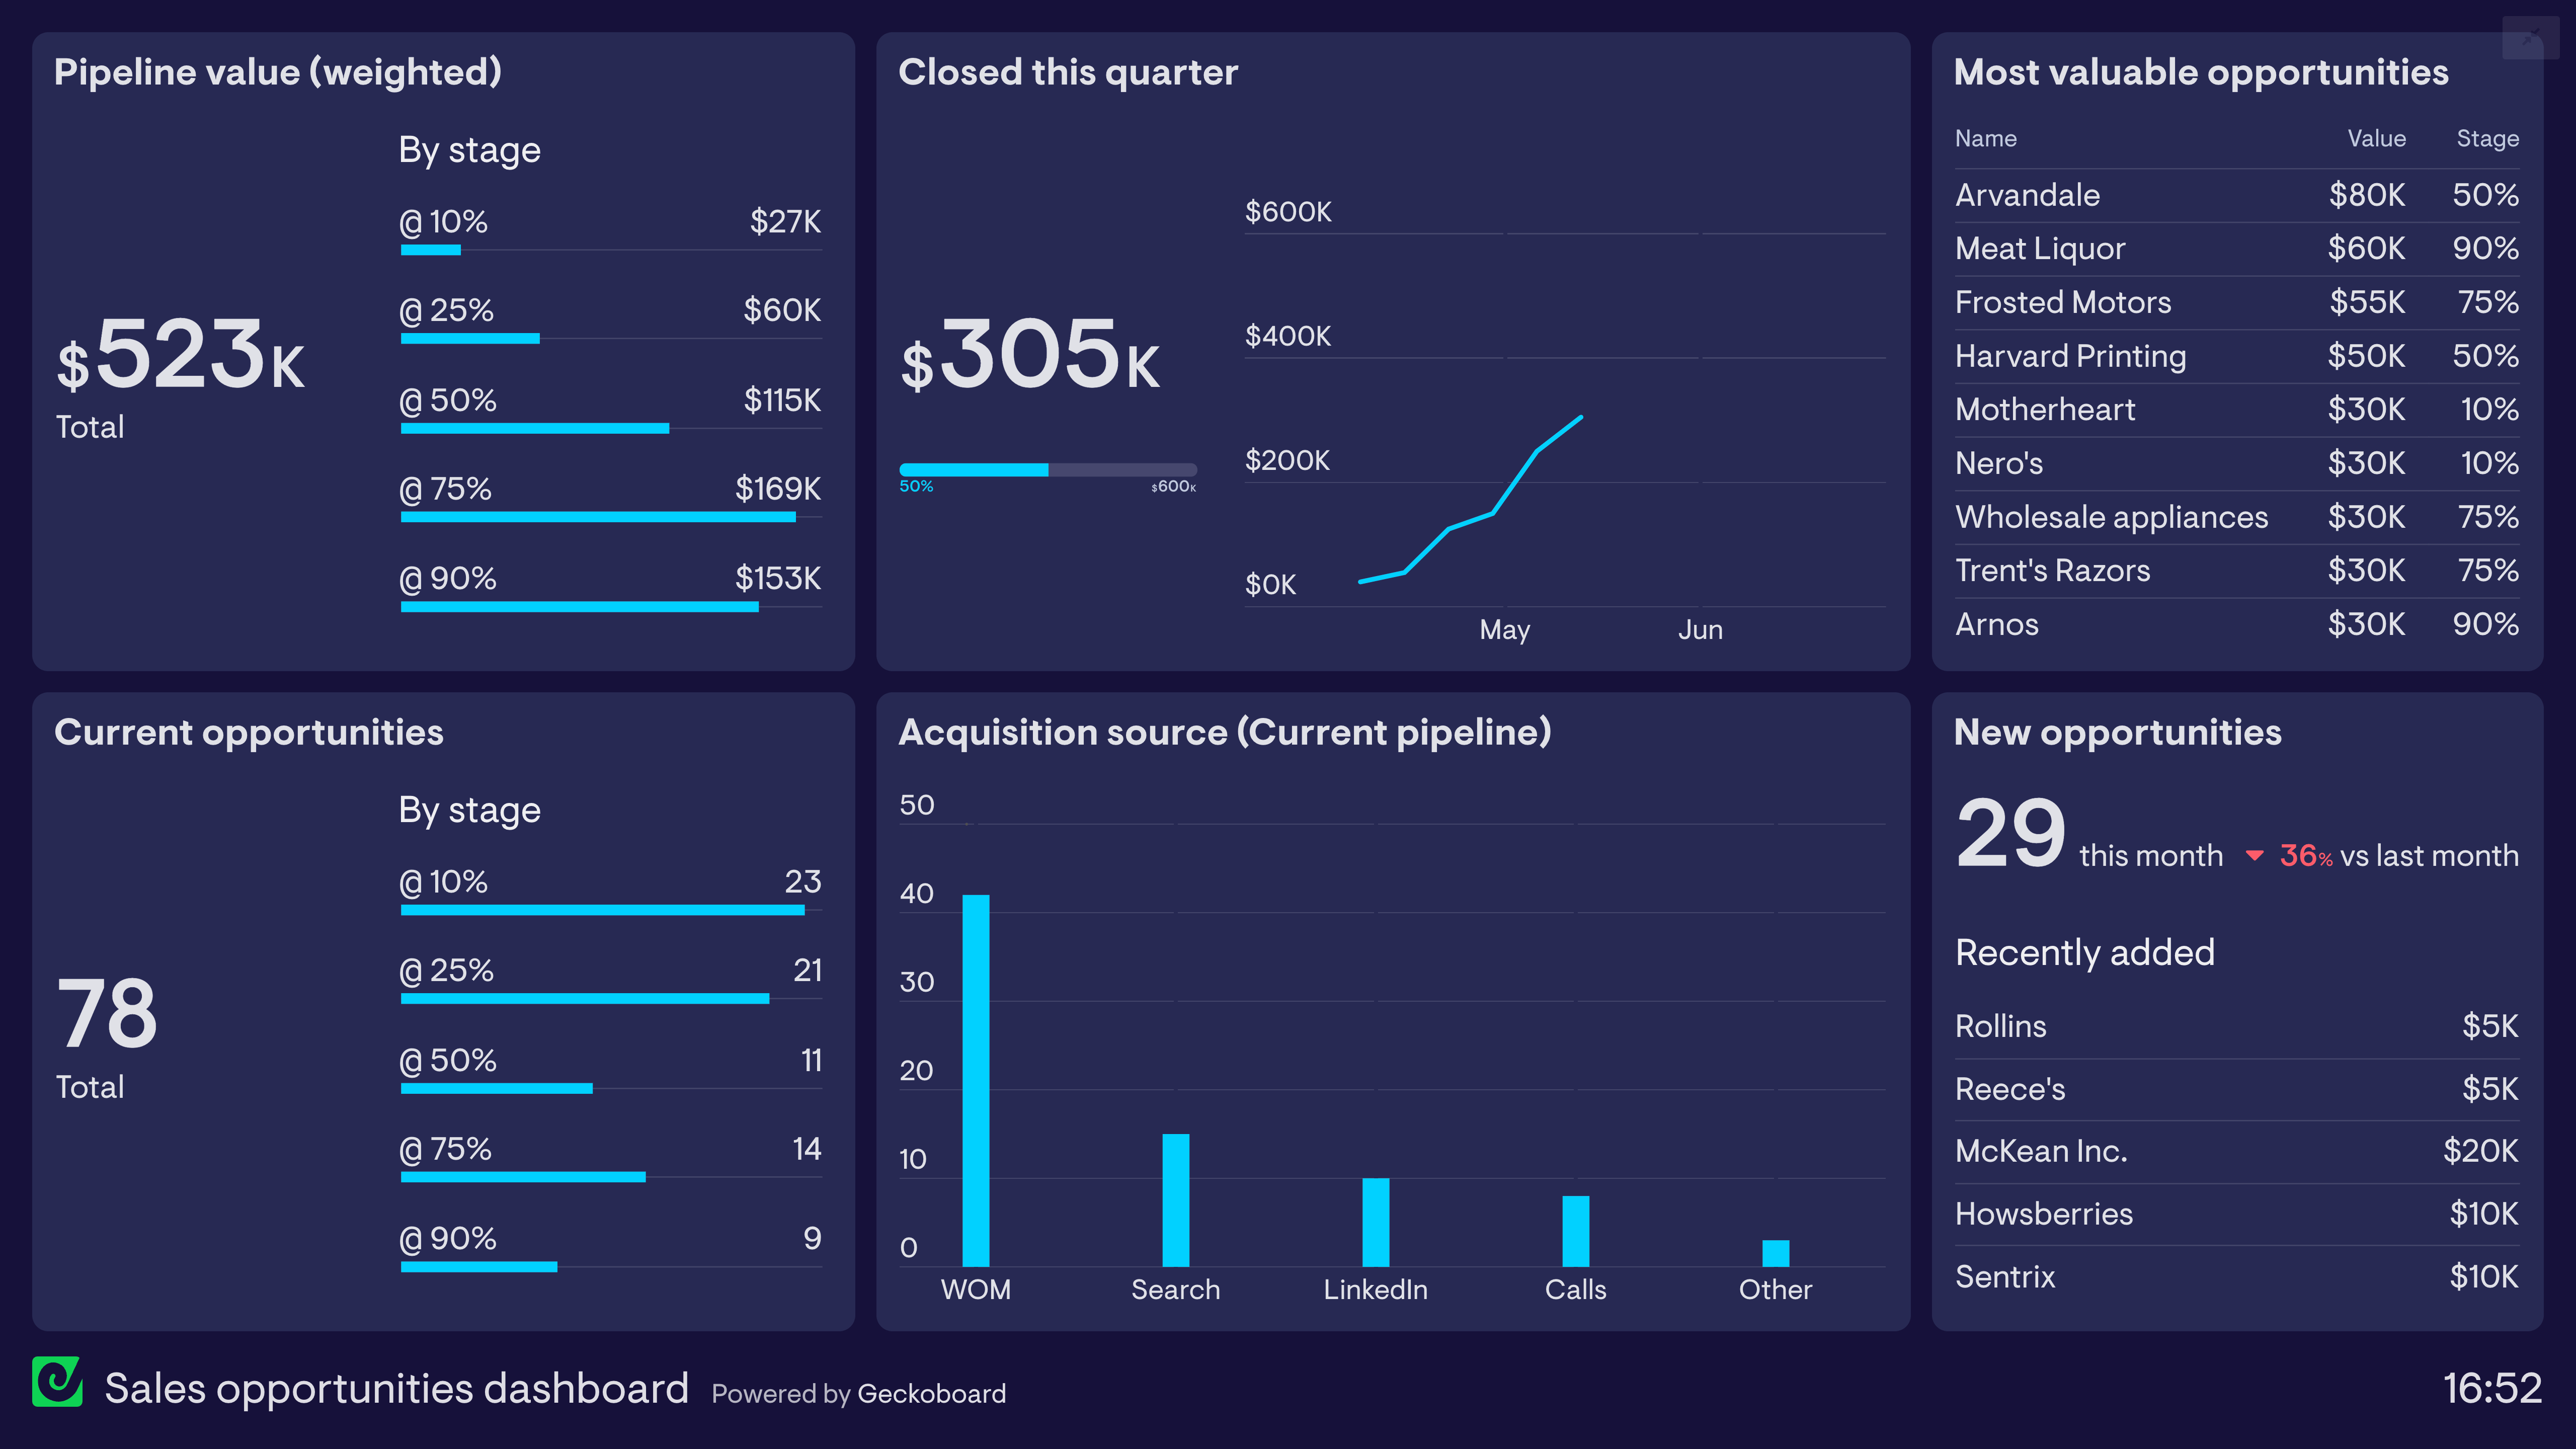
This dashboard focuses on the movement of sales opportunities through the pipeline. The members of the sales team will no doubt use a CRM system to record and keep track of their own opportunities. But they also use this live dashboard to make sure the entire team is regularly up to date on the full picture.
This dashboard uses pipeline weighting to give a more accurate picture of how much revenue the team can expect to convert. For example, $230k worth of opportunities at the 50% stage will be weighted at $115k, because there is a 50% chance they will convert.
In this example, it’s looking likely they will hit their quarterly target based on the value of late-stage opportunities in the pipeline (at 75% and 90%). But the lack of opportunities at the beginning of the pipeline will be more concerning. At least they’ll now be aware they need to prioritize this area, so they don’t run into trouble in the next quarter.
Browse other popular examples
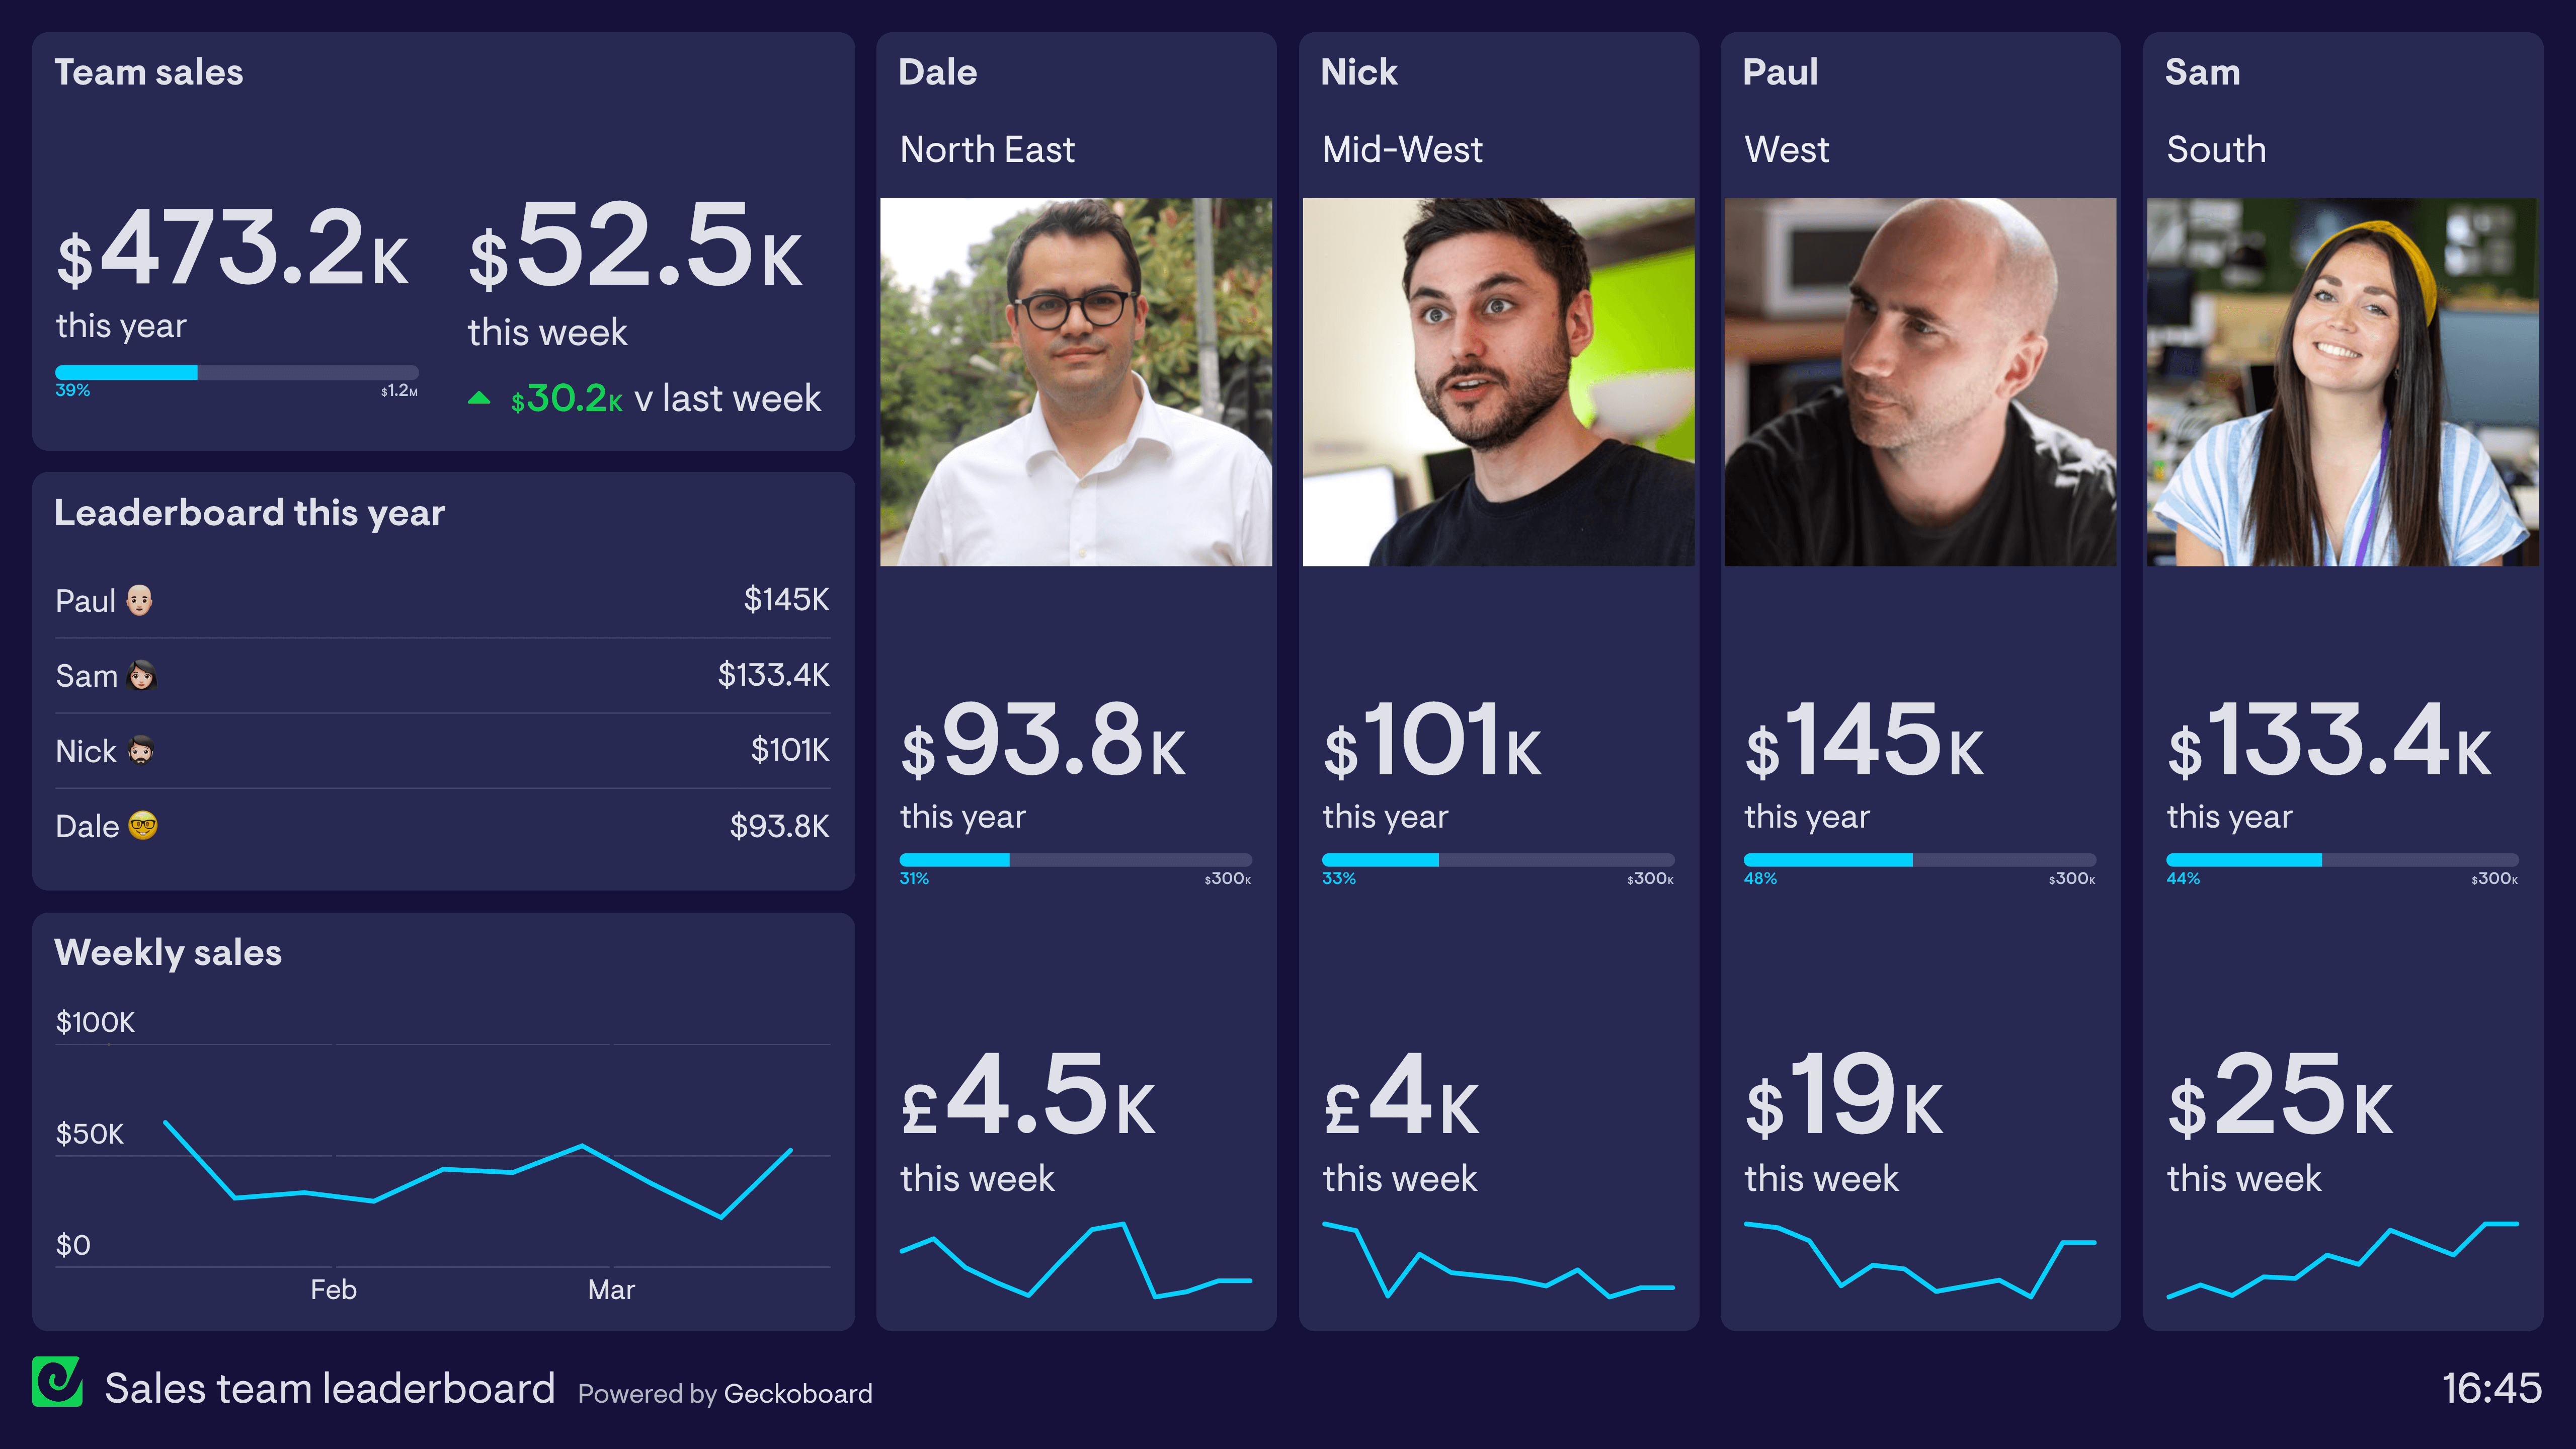
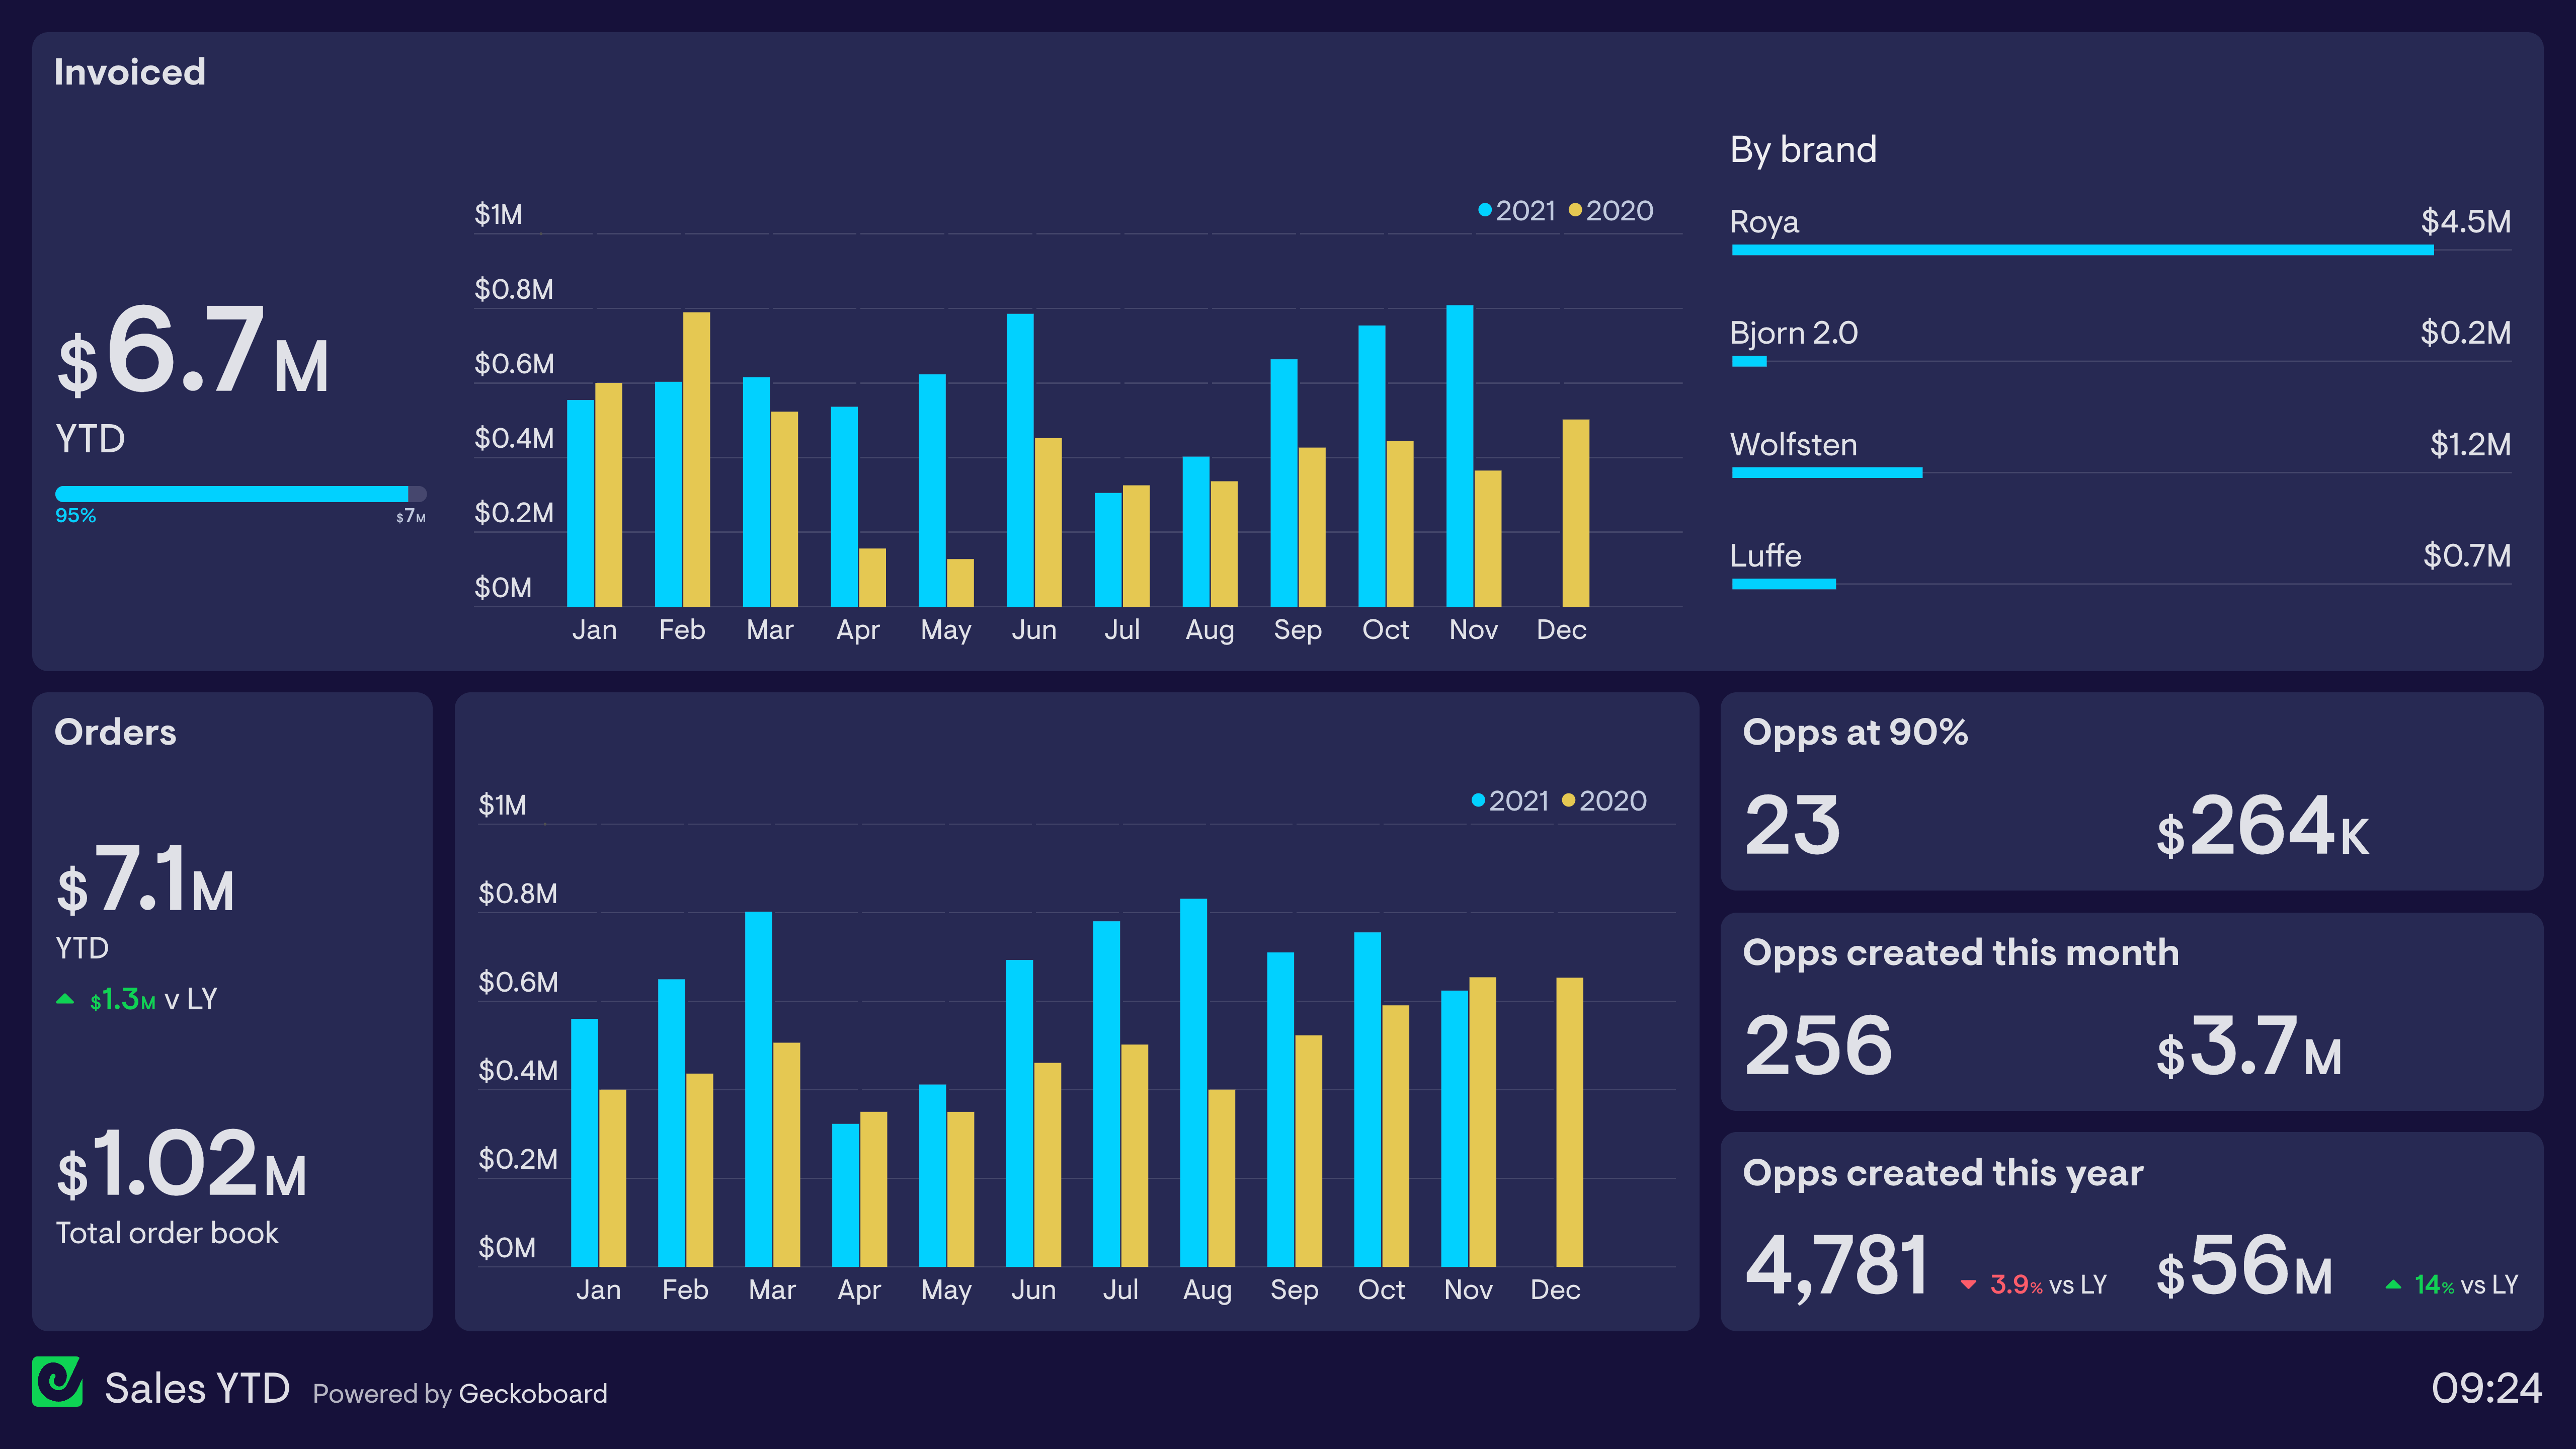
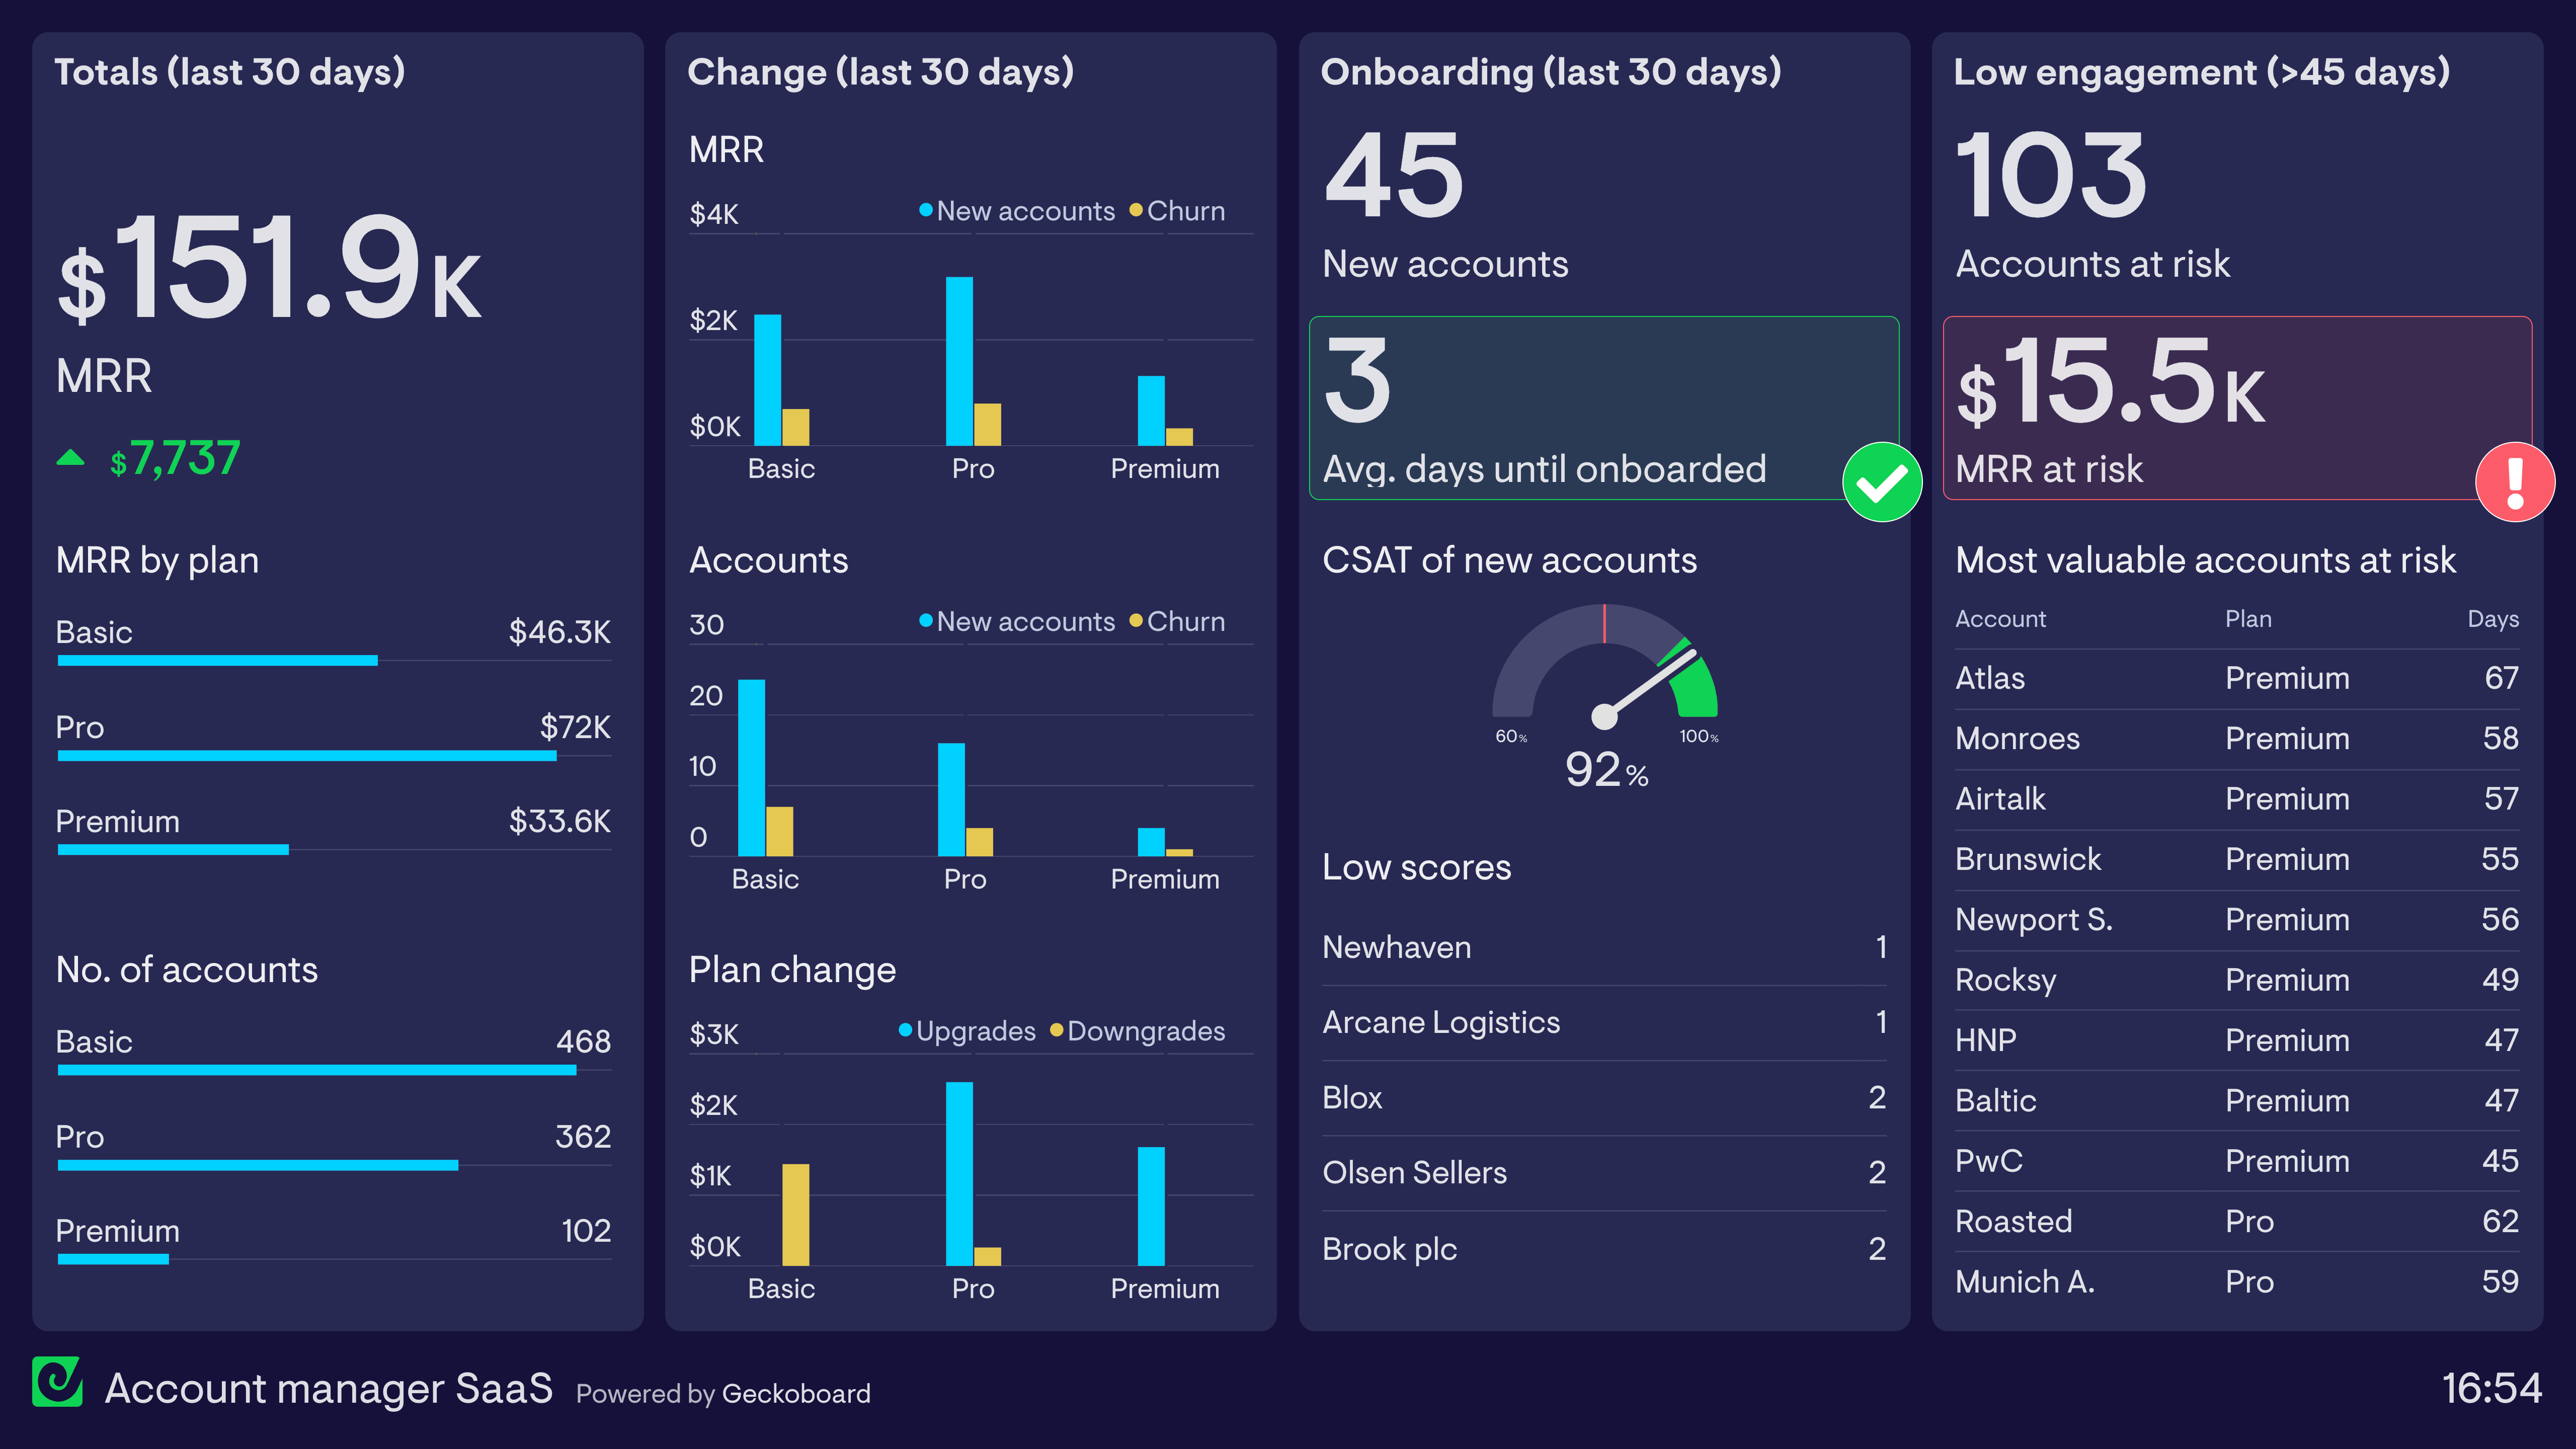
A sales opportunities dashboard gives sales managers a live view of open deals in the pipeline — showing value, stage, age, and close probability for every active opportunity. It helps managers prioritise where to focus coaching time and ensures high-value deals get the attention they need.
Geckoboard is a live dashboard tool that connects to Salesforce and other CRM tools to give sales teams a real-time view of the opportunities in their pipeline. Dashboards update as deals move and can be displayed on a team screen or shared with leadership via automated snapshot.
Common metrics include pipeline value by stage, number of opportunities, weighted pipeline, deal age, close date proximity, and deals at risk of going stale. Teams often track opportunities by rep, region, or product line.
Building a custom sales opportunities dashboard is straightforward with Geckoboard's dashboard builder. Connect Salesforce or SQL databases and custom data sources to pull live opportunity data from your CRM, then pick your metrics and build the view you need. Share with your team as a TV dashboard, shared link, or scheduled snapshot. Start a free trial or learn more about how Geckoboard works.
Use it to monitor sales performance in real time, seeing pipeline value shift as deals progress, stall, or close so managers can act the moment things change. It also helps give leadership a current read on pipeline coverage and forecasted revenue without requesting a CRM export.