Sales product performance dashboard examples
A sales product performance dashboard shows how individual products contribute to revenue — which are performing, which are struggling, and which follow seasonal patterns. It helps salespeople prioritise what to push and gives operations teams the visibility they need to manage supply alongside demand.
Product Performance dashboard
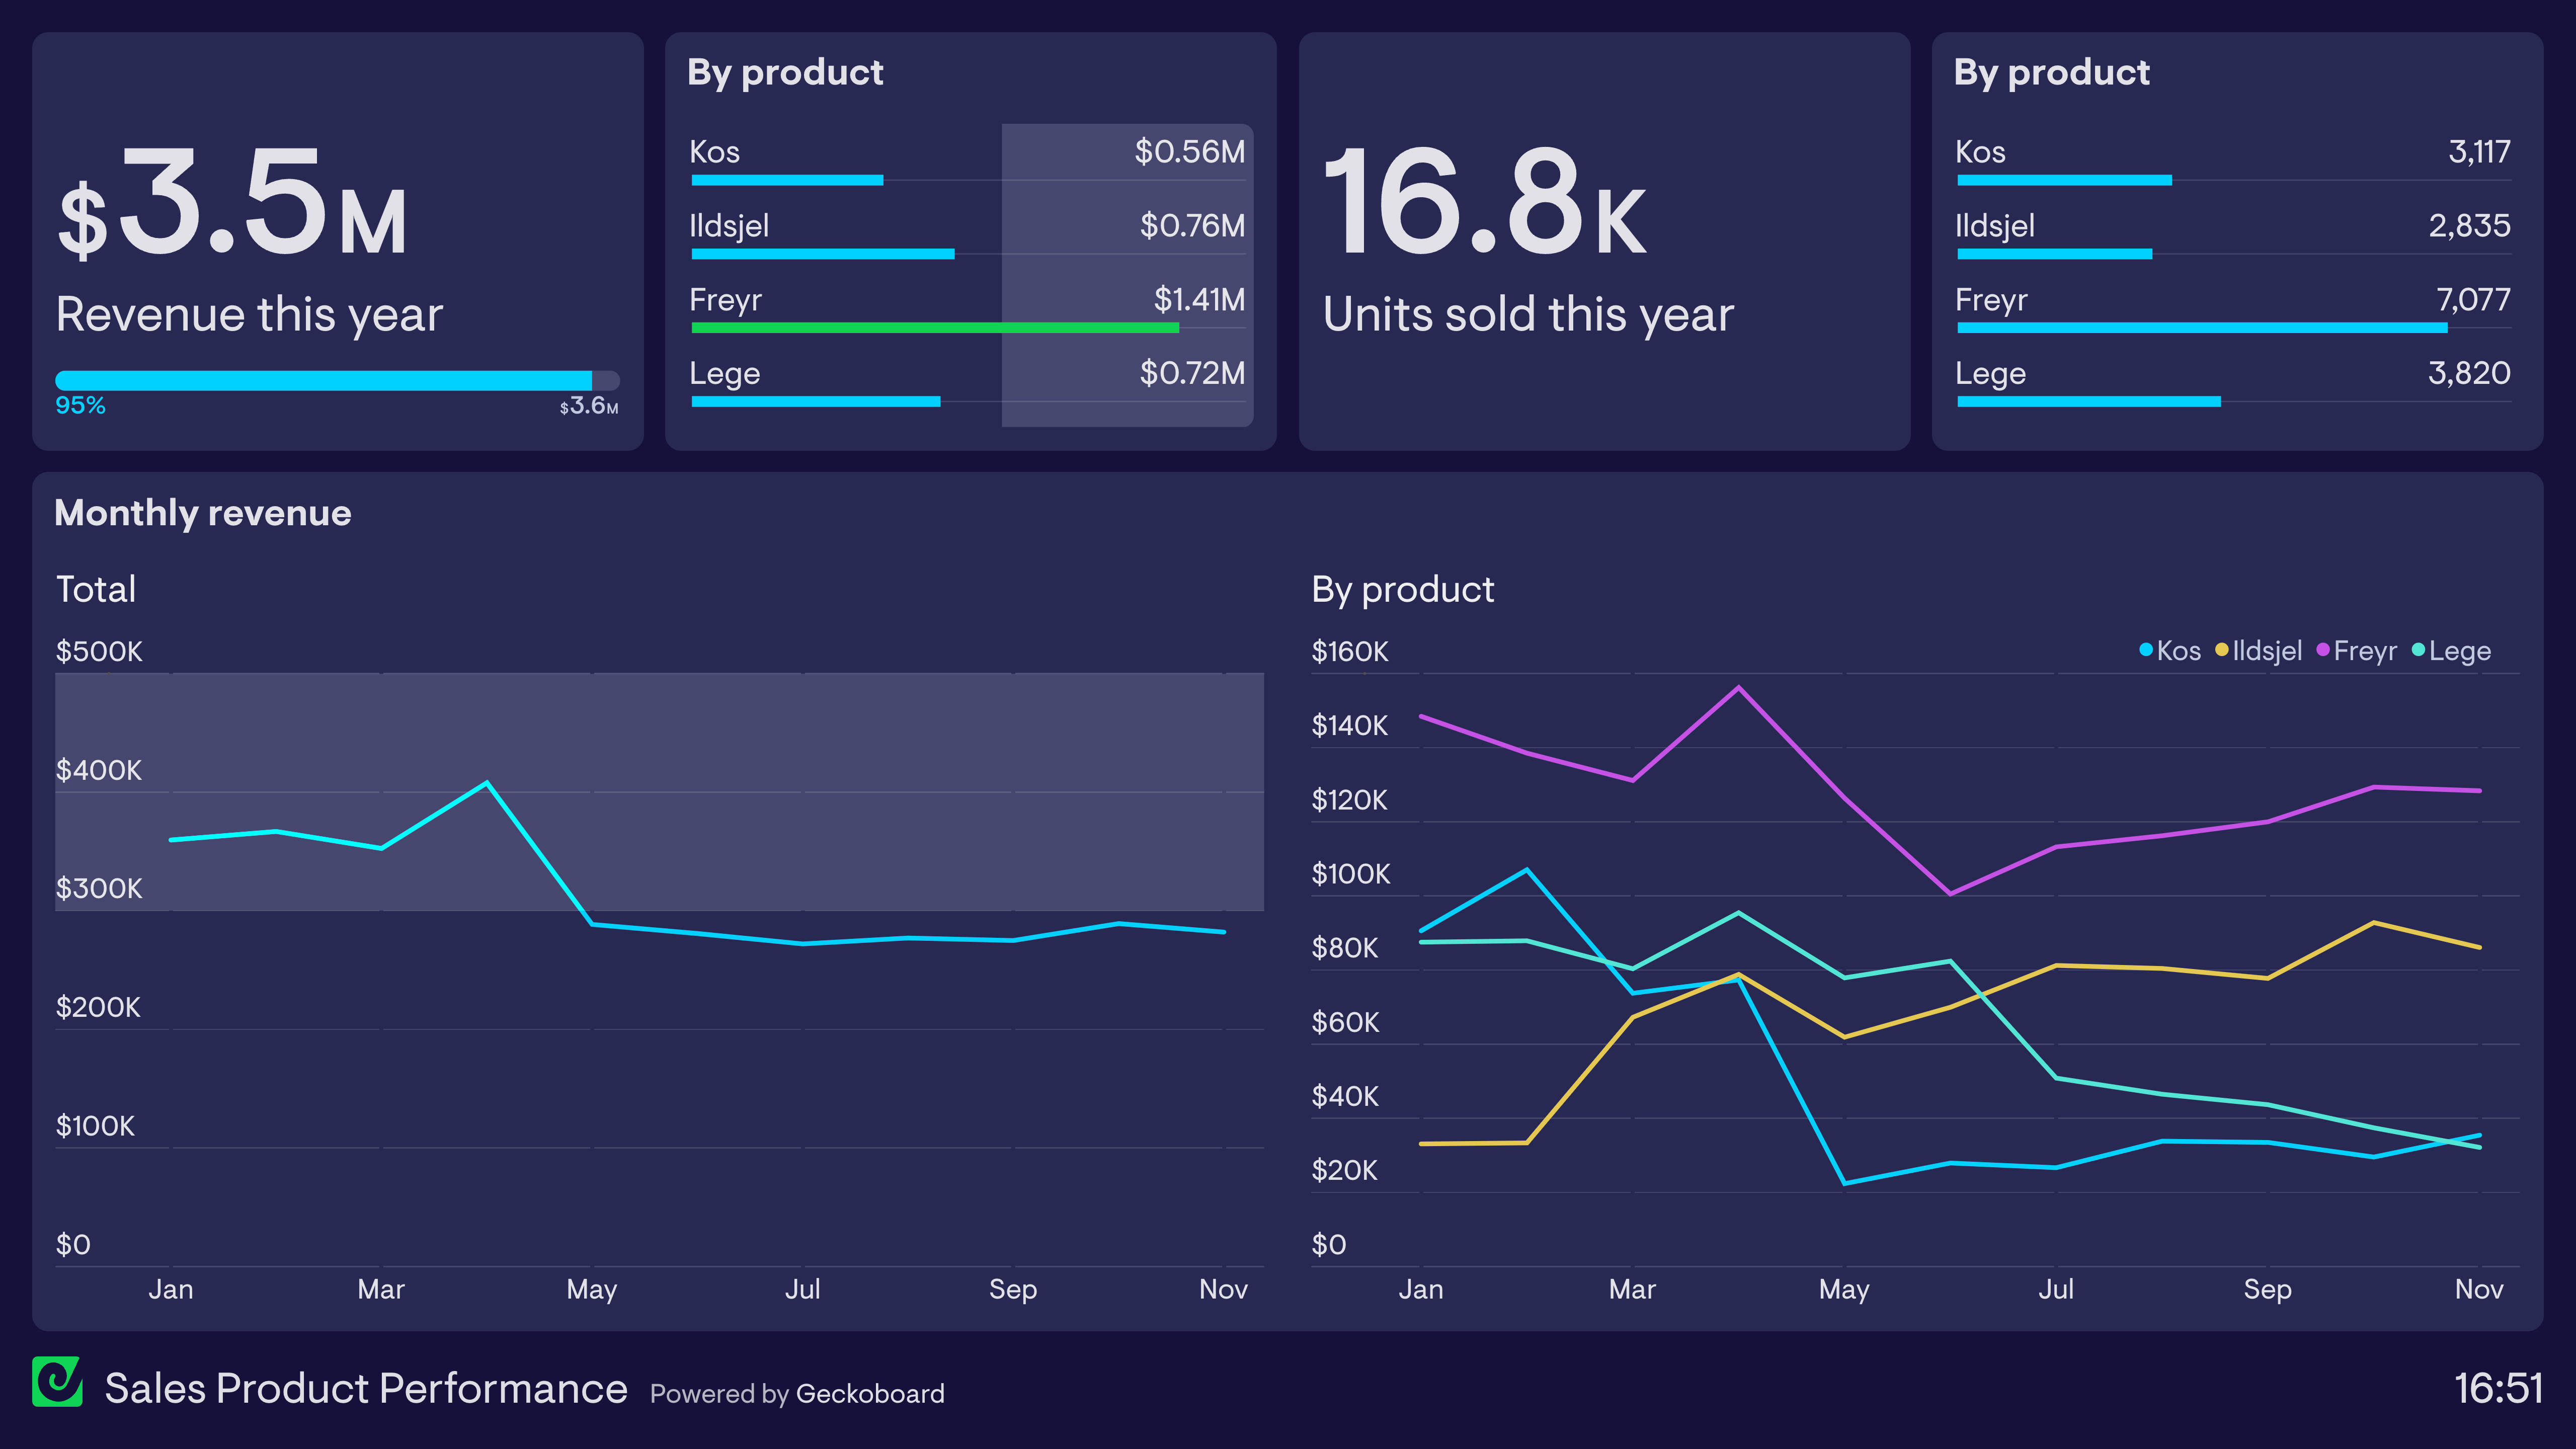
Here we have a classic example of a Product Performance dashboard from a boutique home appliances company. Like most sales dashboards, this still tracks total revenue, in this case, against an annual target of $3.6 million. However, this dashboard also breaks down how the performance of each product is contributing to that revenue figure. As we can see, the Freyr product has been outperforming all other products this year. And in what would otherwise look like a relatively stable year for revenue, we can see there has actually been a huge decline in sales of two of the products (Lege and Kos) with an emerging product (Ildsjel) making up the shortfall.
Browse other popular examples
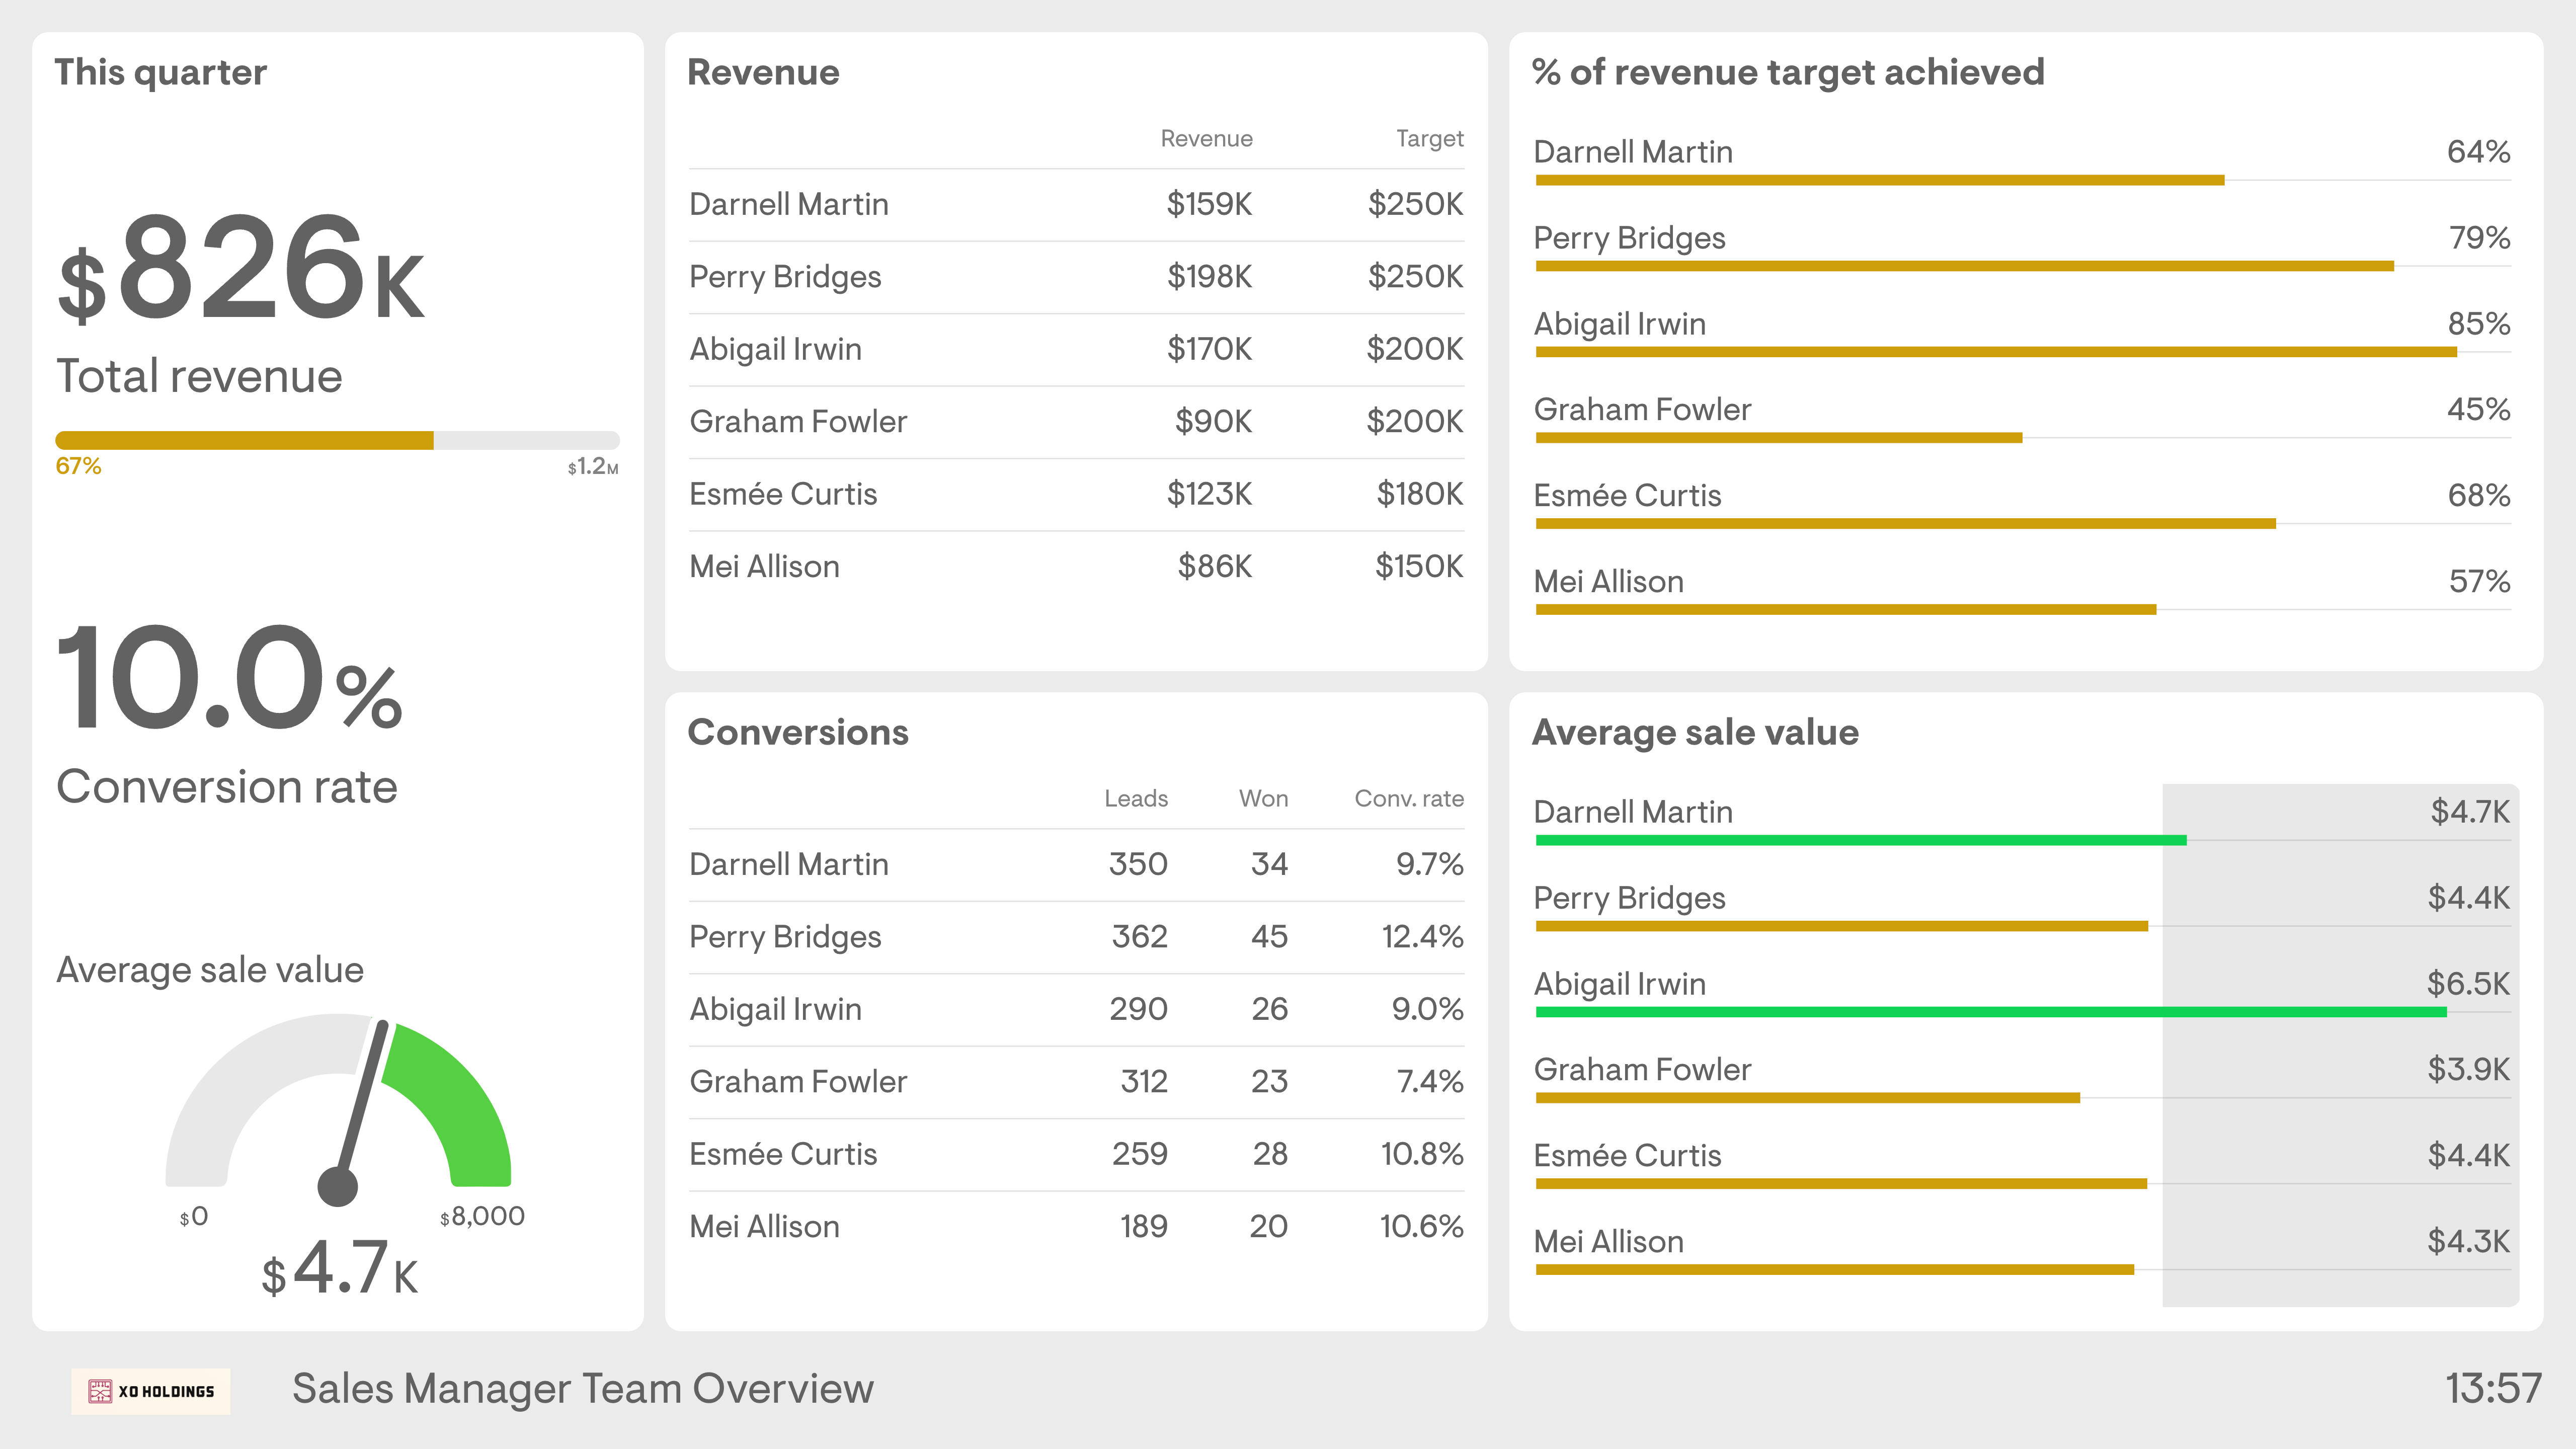
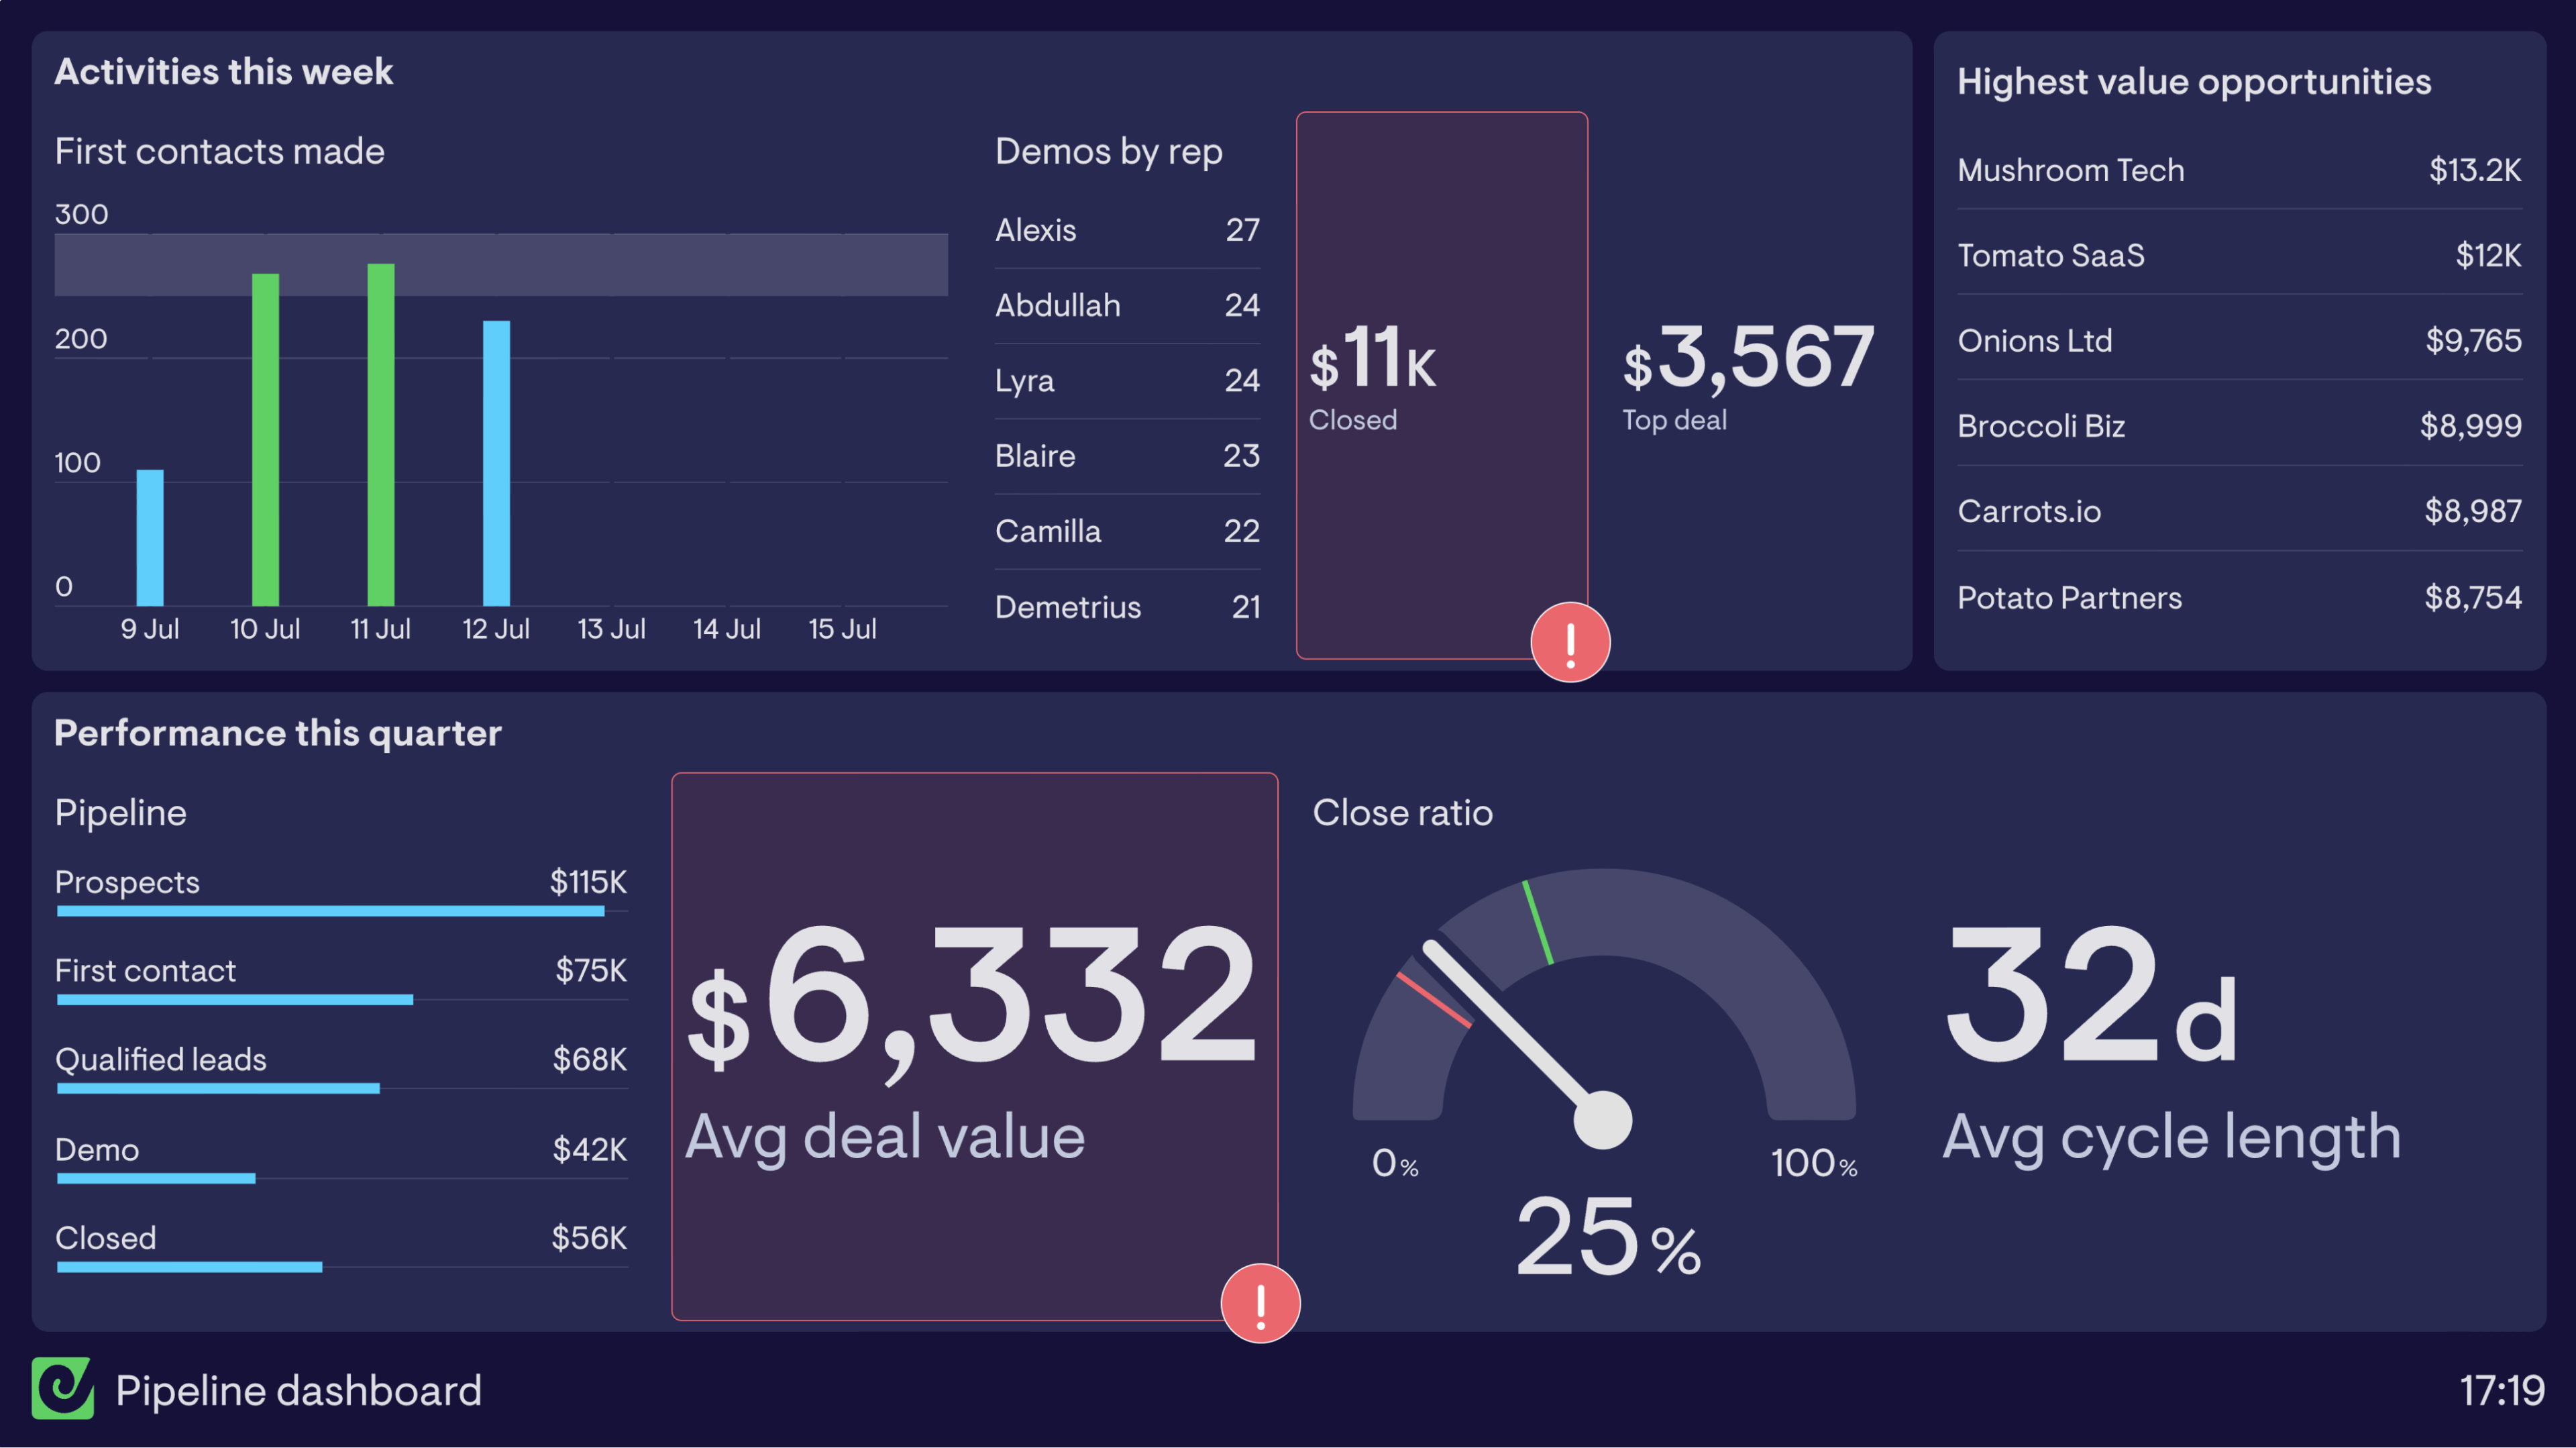
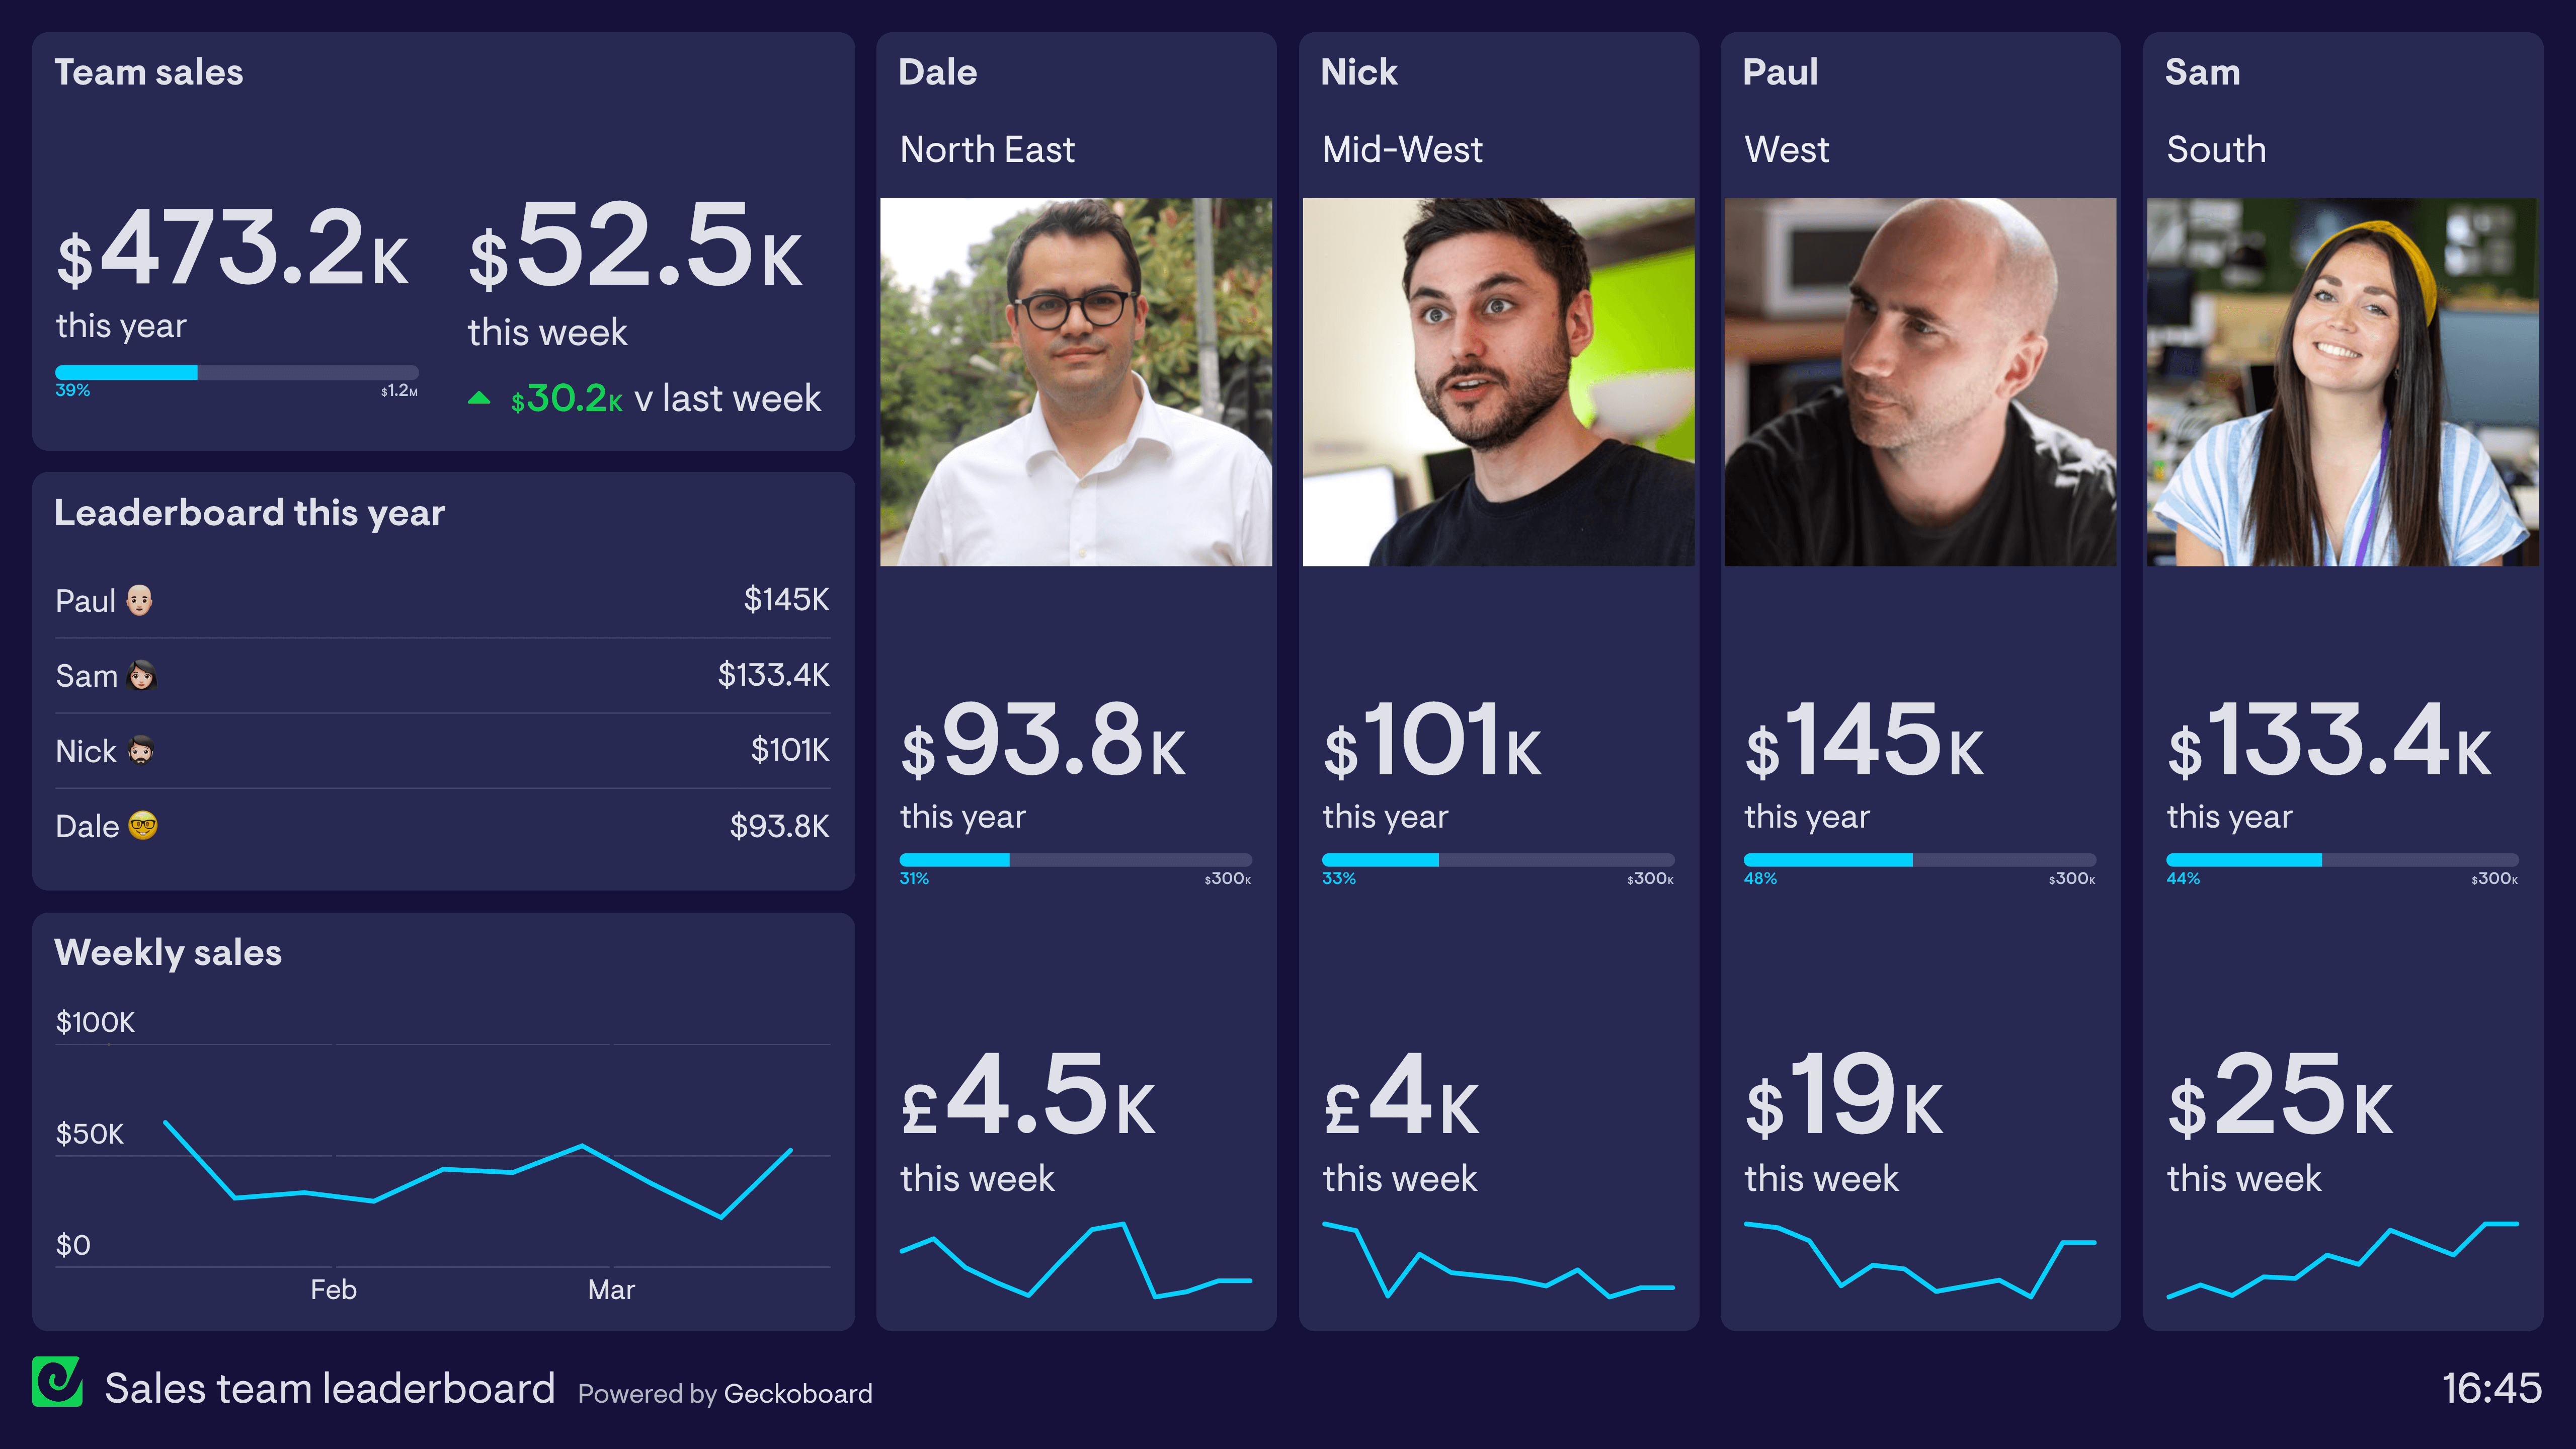
A sales product performance dashboard tracks how individual products or services are selling — showing revenue, volume, and performance trends by product line. It helps sales managers and product teams understand which offerings are driving growth and where there might be an opportunity to push harder or adjust strategy.
Geckoboard is a live dashboard tool that connects to Salesforce and databases to give sales teams a real-time breakdown of product performance against revenue targets. It keeps the metrics that show which products are performing — and which need attention — visible to the team and to operations.
Typical metrics include revenue by product, units sold, deal count per product, product win rate, average deal size by product, and growth rate month-over-month. Teams compare these across products to spot which are under or overperforming.
Building a custom sales product performance dashboard is straightforward with Geckoboard's dashboard builder. Connect Salesforce or SQL databases and custom data sources to pull product-level deal and revenue data, then pick your metrics and build the view you need. Share with your team as a TV dashboard, shared link, or scheduled snapshot. Start a free trial or learn more about how Geckoboard works.
Use it to monitor sales performance in real time so sales and product teams can see which lines are gaining or losing momentum and adjust focus quickly. It also helps give leadership a clear view of which products drive revenue without needing a custom report from the data team.