Sales Manager dashboard examples
A Sales Manager dashboard keeps pipeline health, team performance, and revenue progress in one view — so you can see where to focus before a problem gets worse.
Sales Manager: Monthly KPI Dashboard
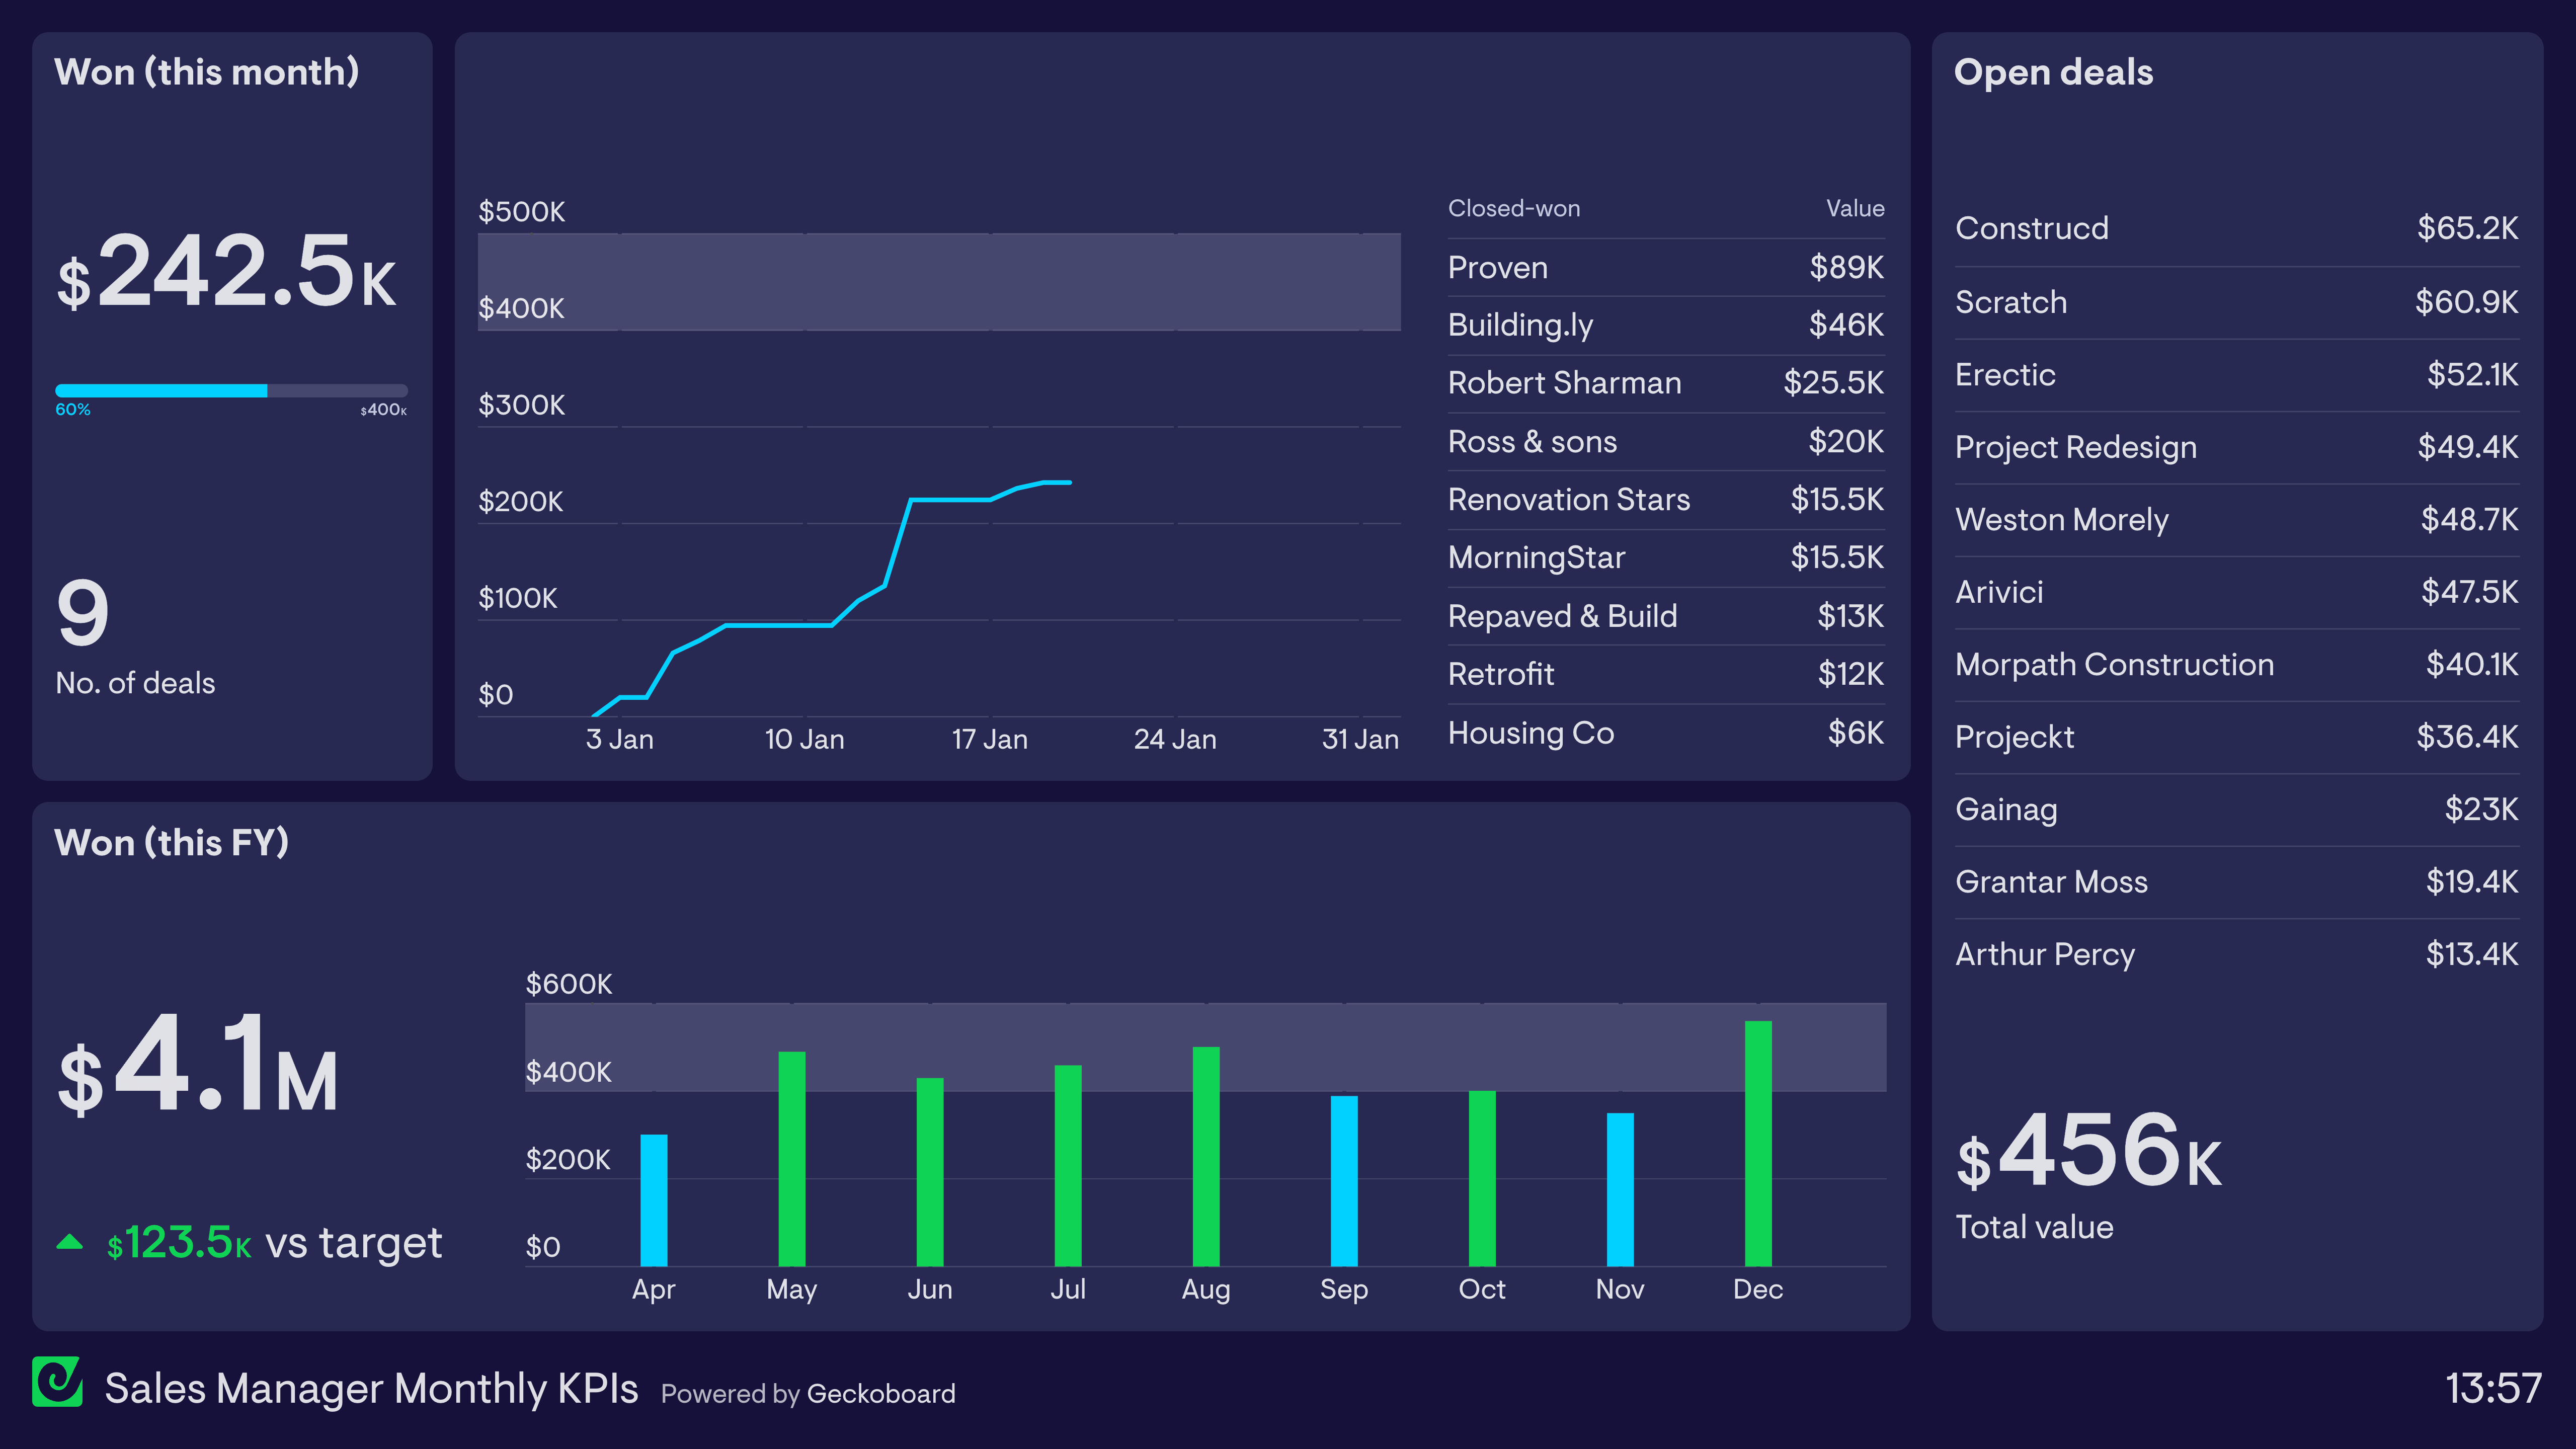
This dashboard focuses on the Sales Manager’s progress toward their monthly revenue targets. They can quickly track performance so far, including the deals that have been closed. The dashboard also shows the total value of the immediate pipeline, including the accounts that make up the pipeline. This helps them to calibrate how likely it is they will hit their monthly targets, or if they need to take a different course of action. For added context, the dashboard also includes revenue figures from previous months, including a green status indicator showing the months where the target has been achieved.
Tracking Orders vs Invoices dashboard
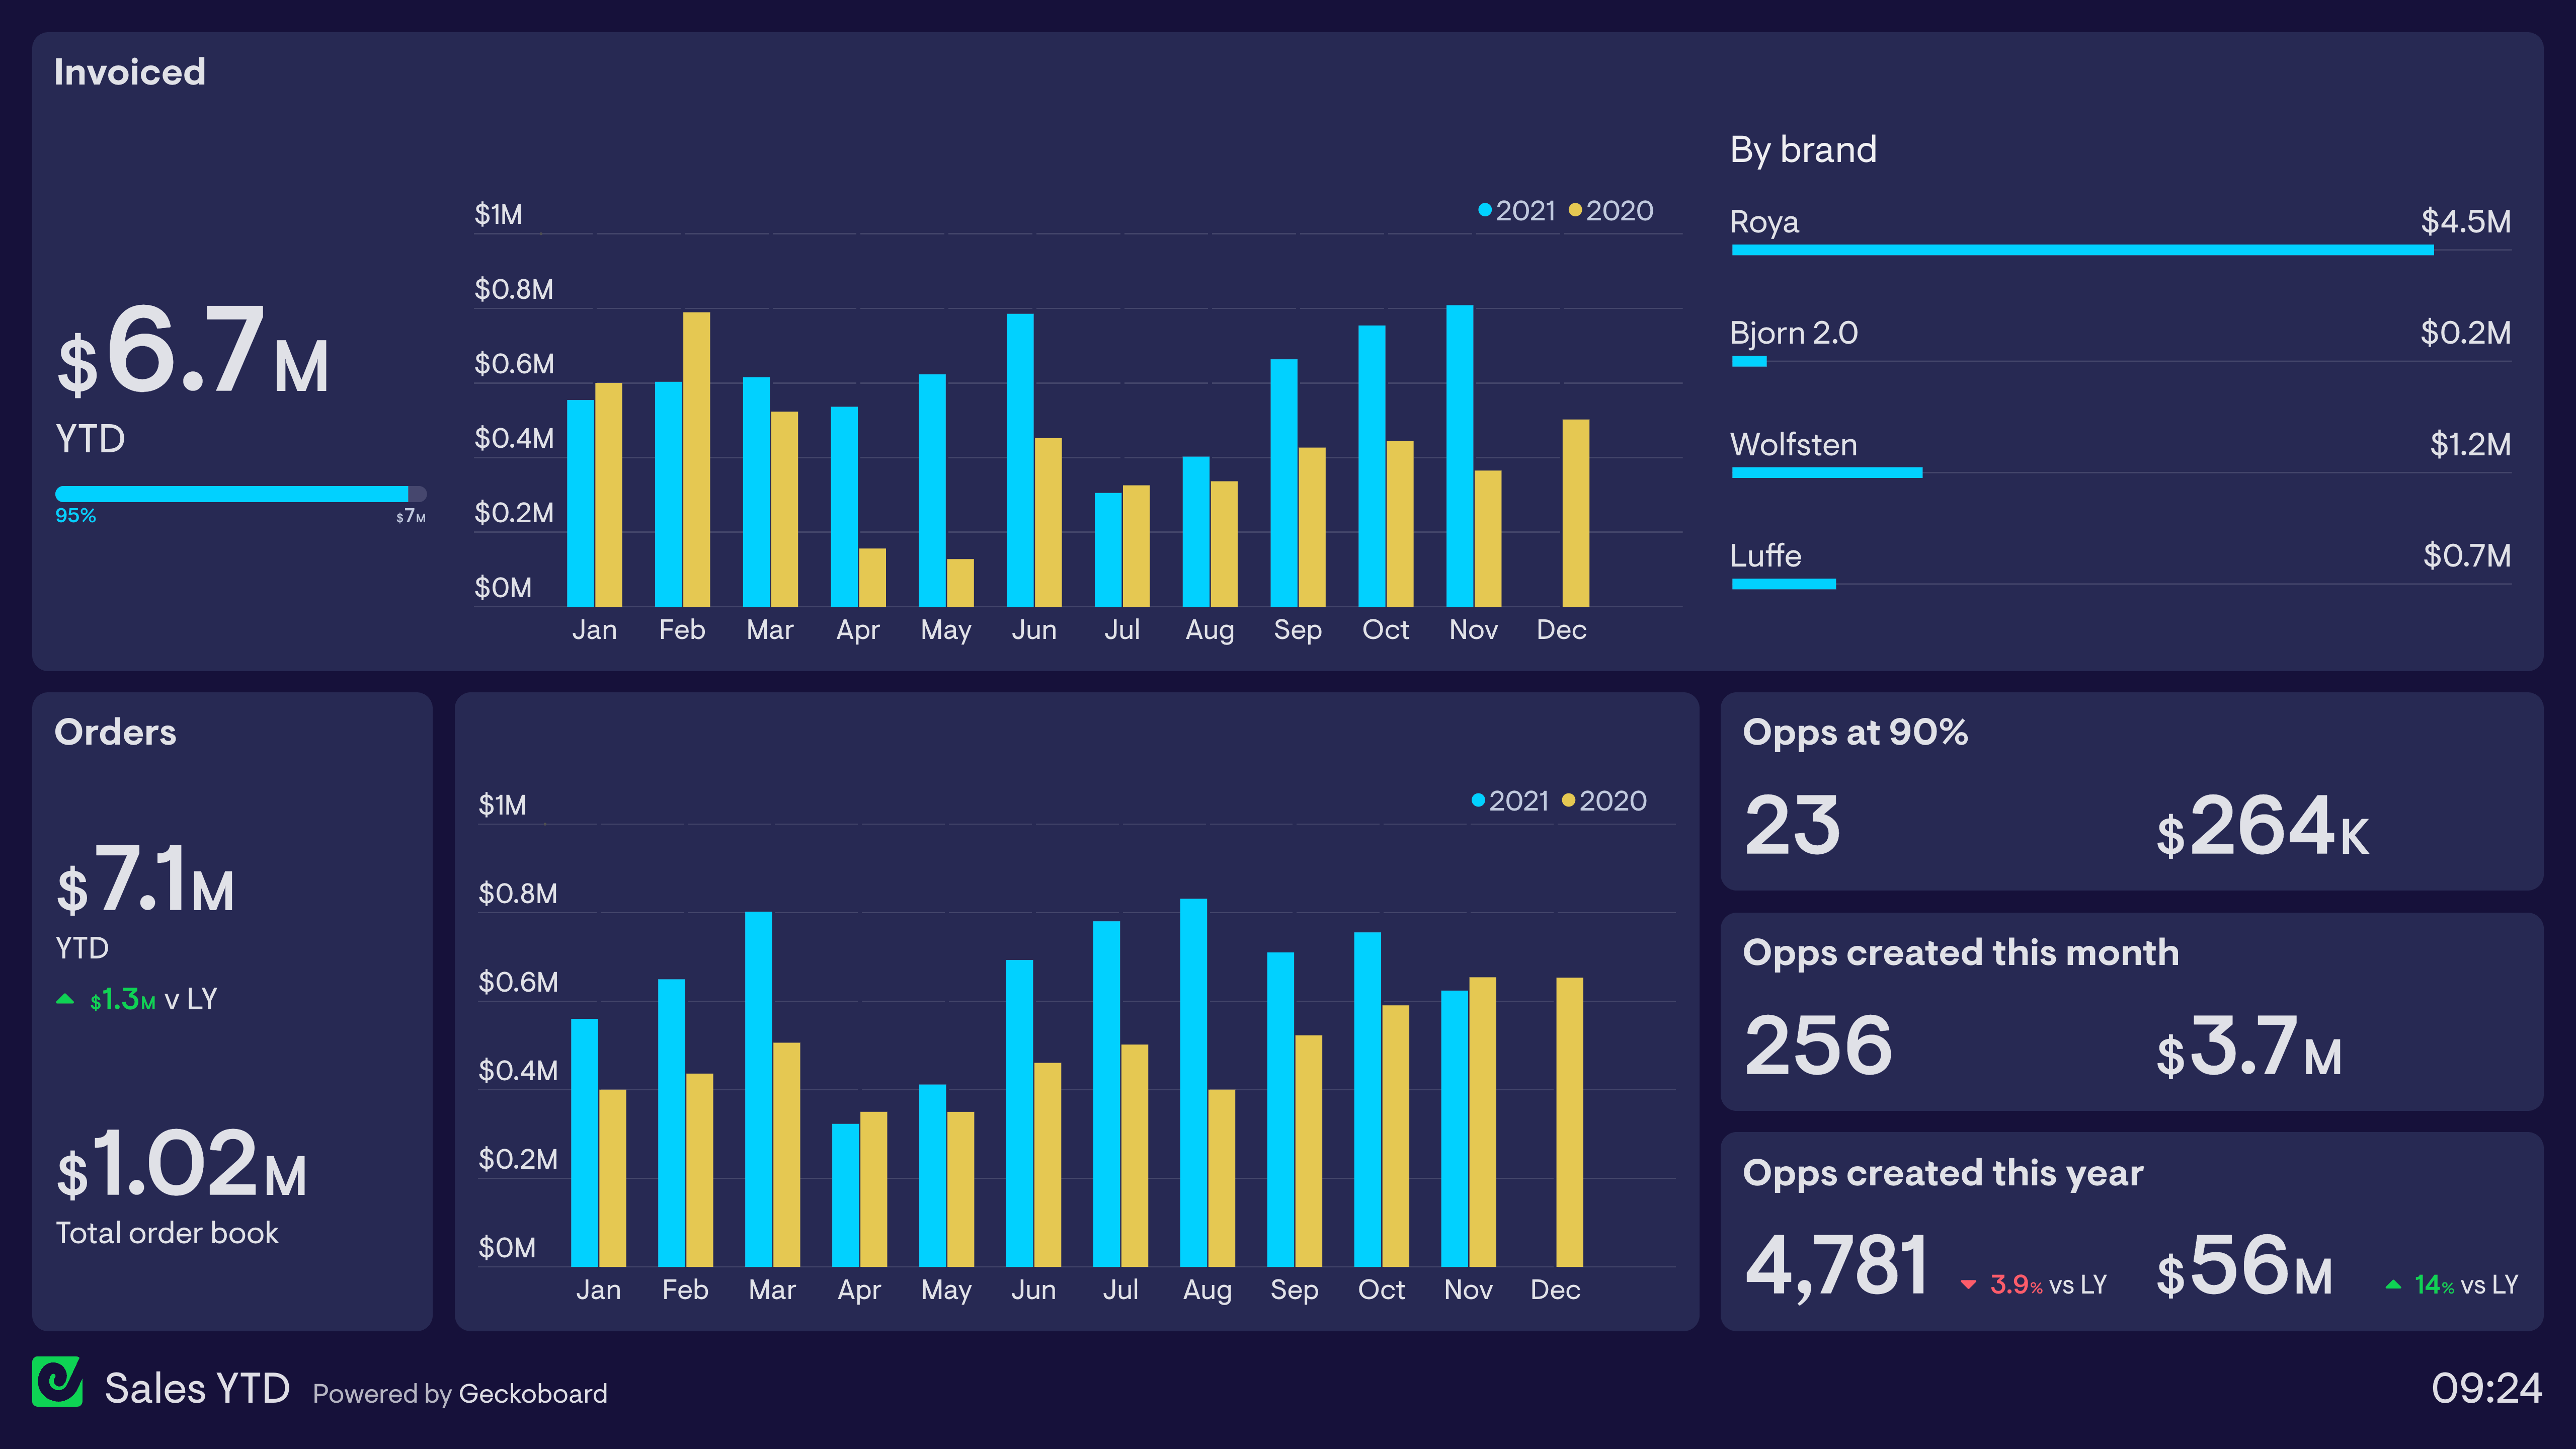
Many Sales Managers need to track metrics at multiple points of the sales process. The dashboard above is used by a company which supplies new offices and buildings with designer furniture. As a result, there is normally a 2-3 month gap between orders being placed and the actual installation of the product, at which point the invoice is issued. This means their dashboard needs to track both invoices issued and orders completed each month. The ‘total order book’ refers to orders which have been placed which have not yet been invoiced.
Sales Manager: Team Overview Dashboard
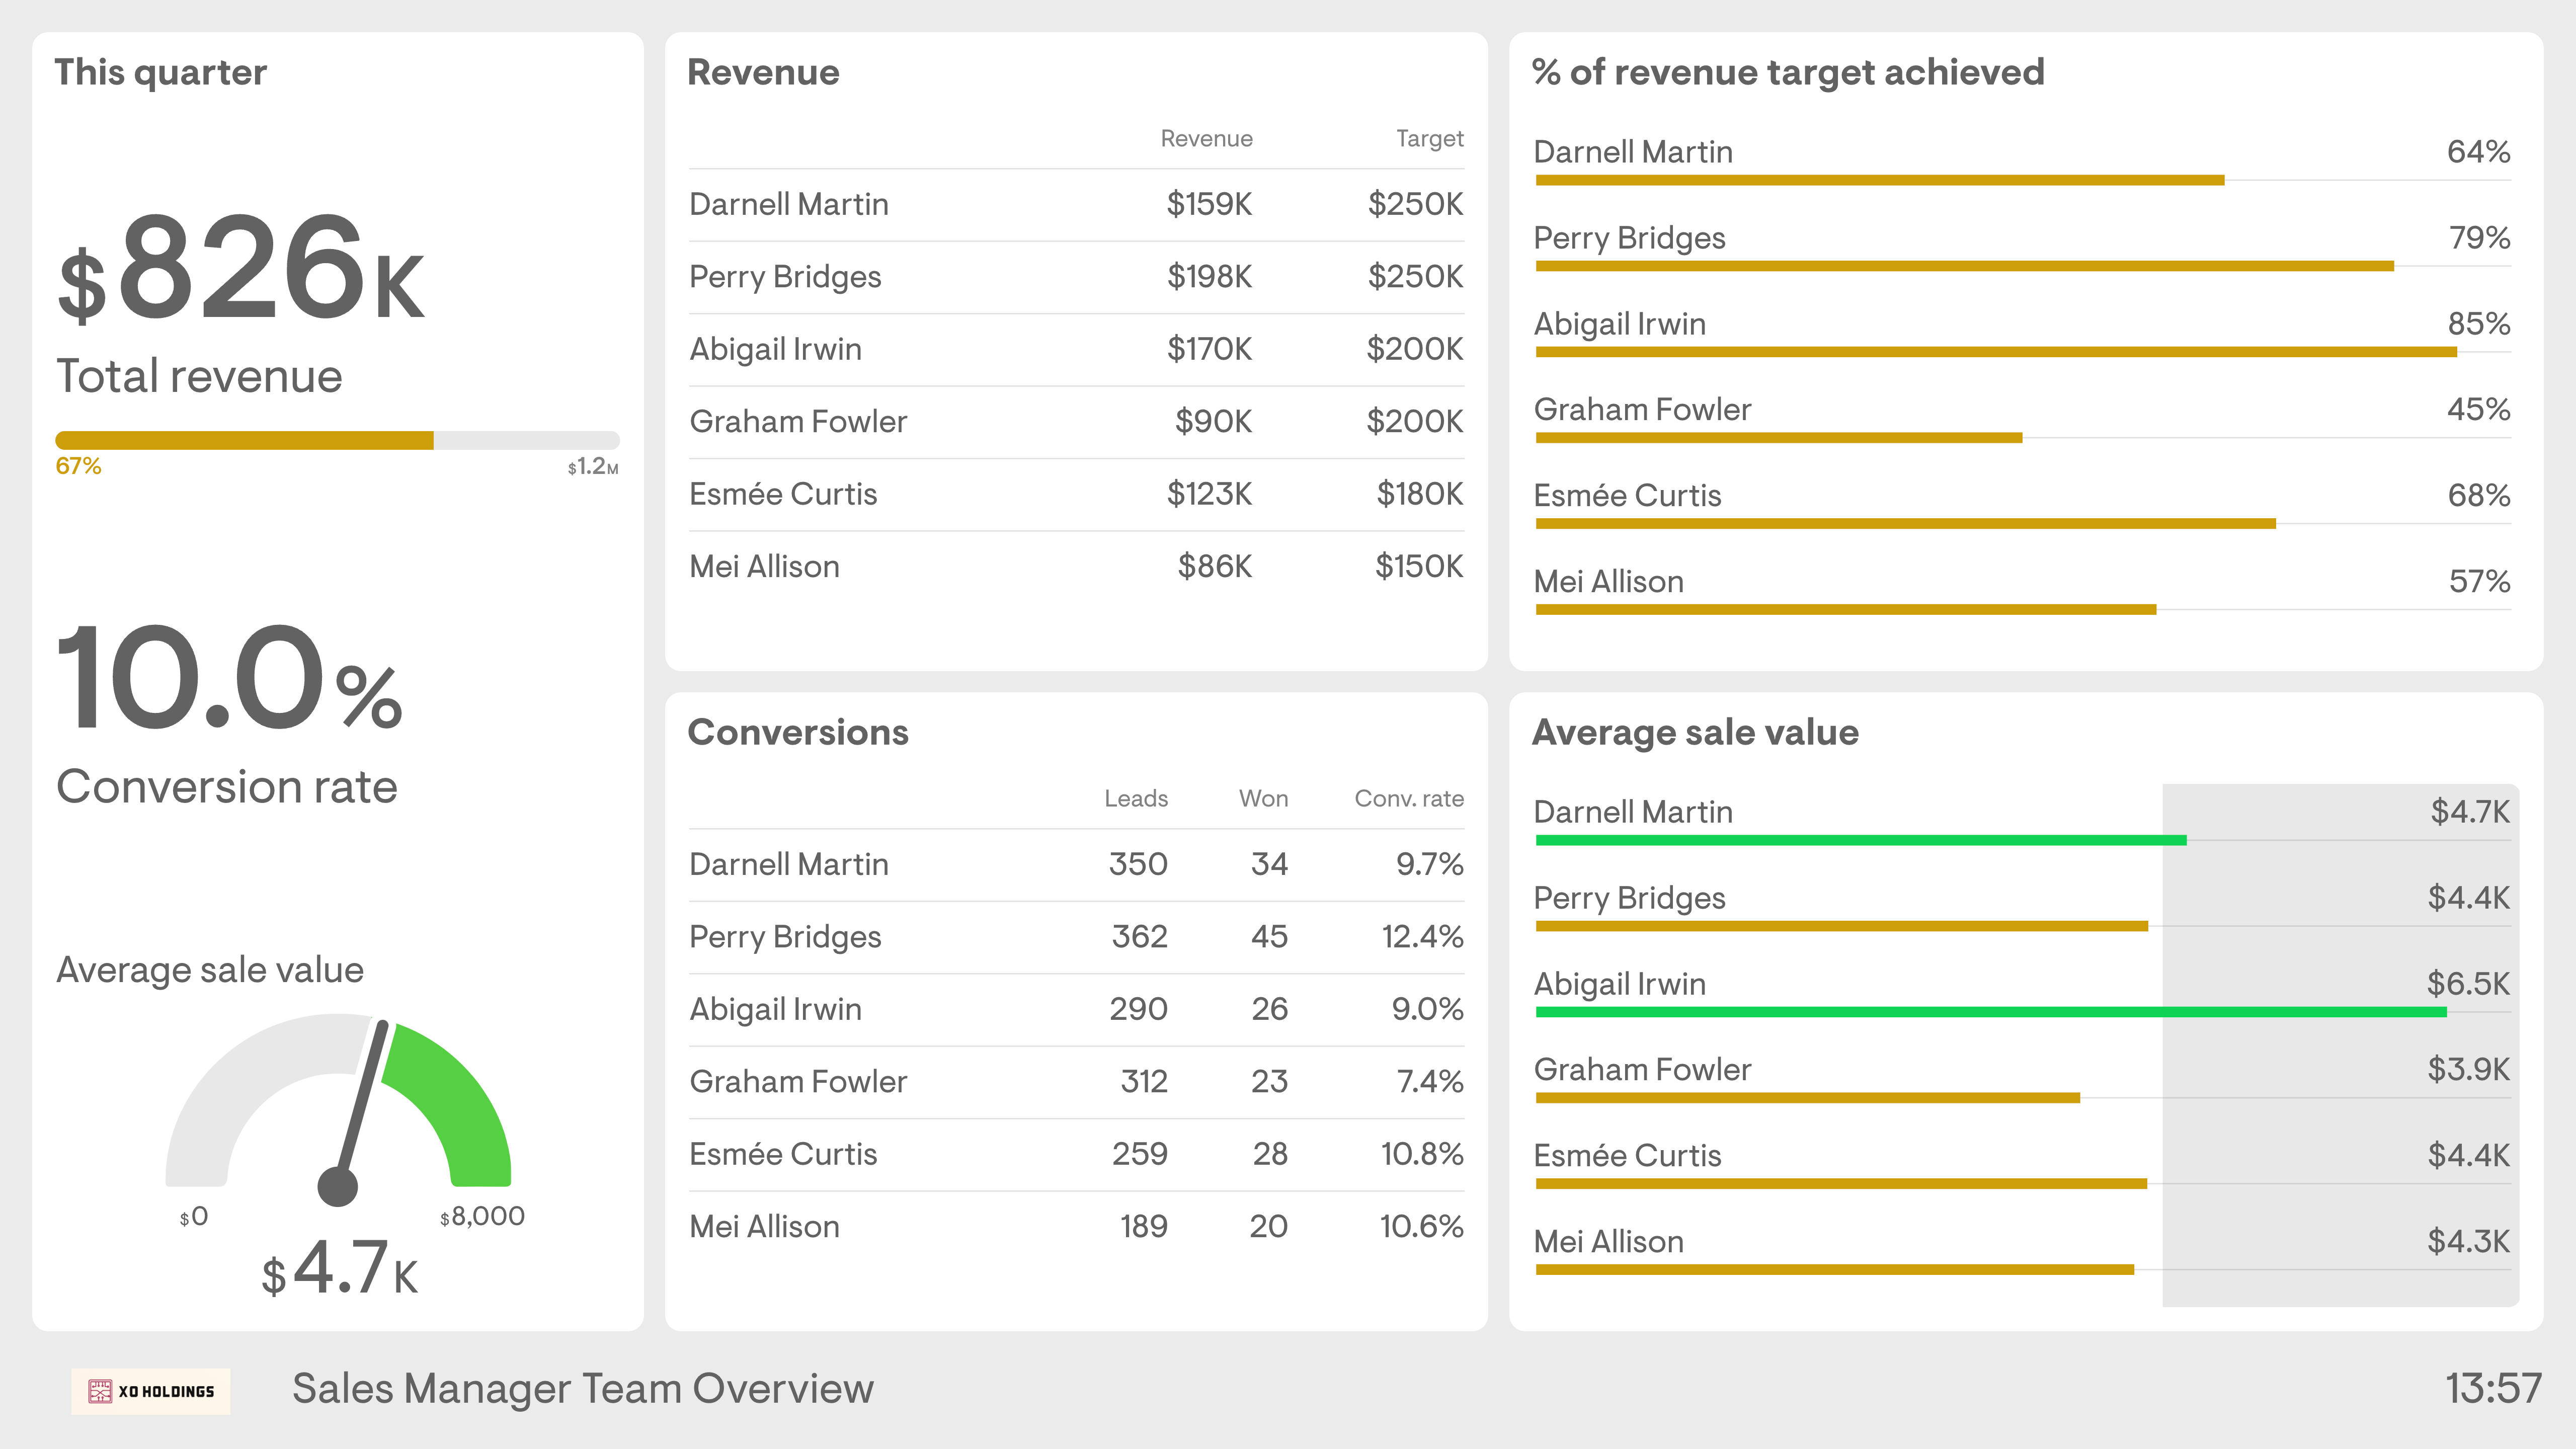
This dashboard focuses on the Sales Manager’s responsibility to manage and support their direct reports. It gives a clear overview of how individuals are progressing towards their targets, meaning the Sales Manager can quickly identify issues and provide extra support when needed. In addition to overall revenue targets, this dashboard shows secondary metrics such as conversion rate and average order value. This Sales Manager has decided to create a benchmark for what they consider to be a good Average Sale Value ($4.5k), perhaps to focus the team’s attention on upselling and/or high-value customers.
Sales Manager: Live Monitoring Dashboard
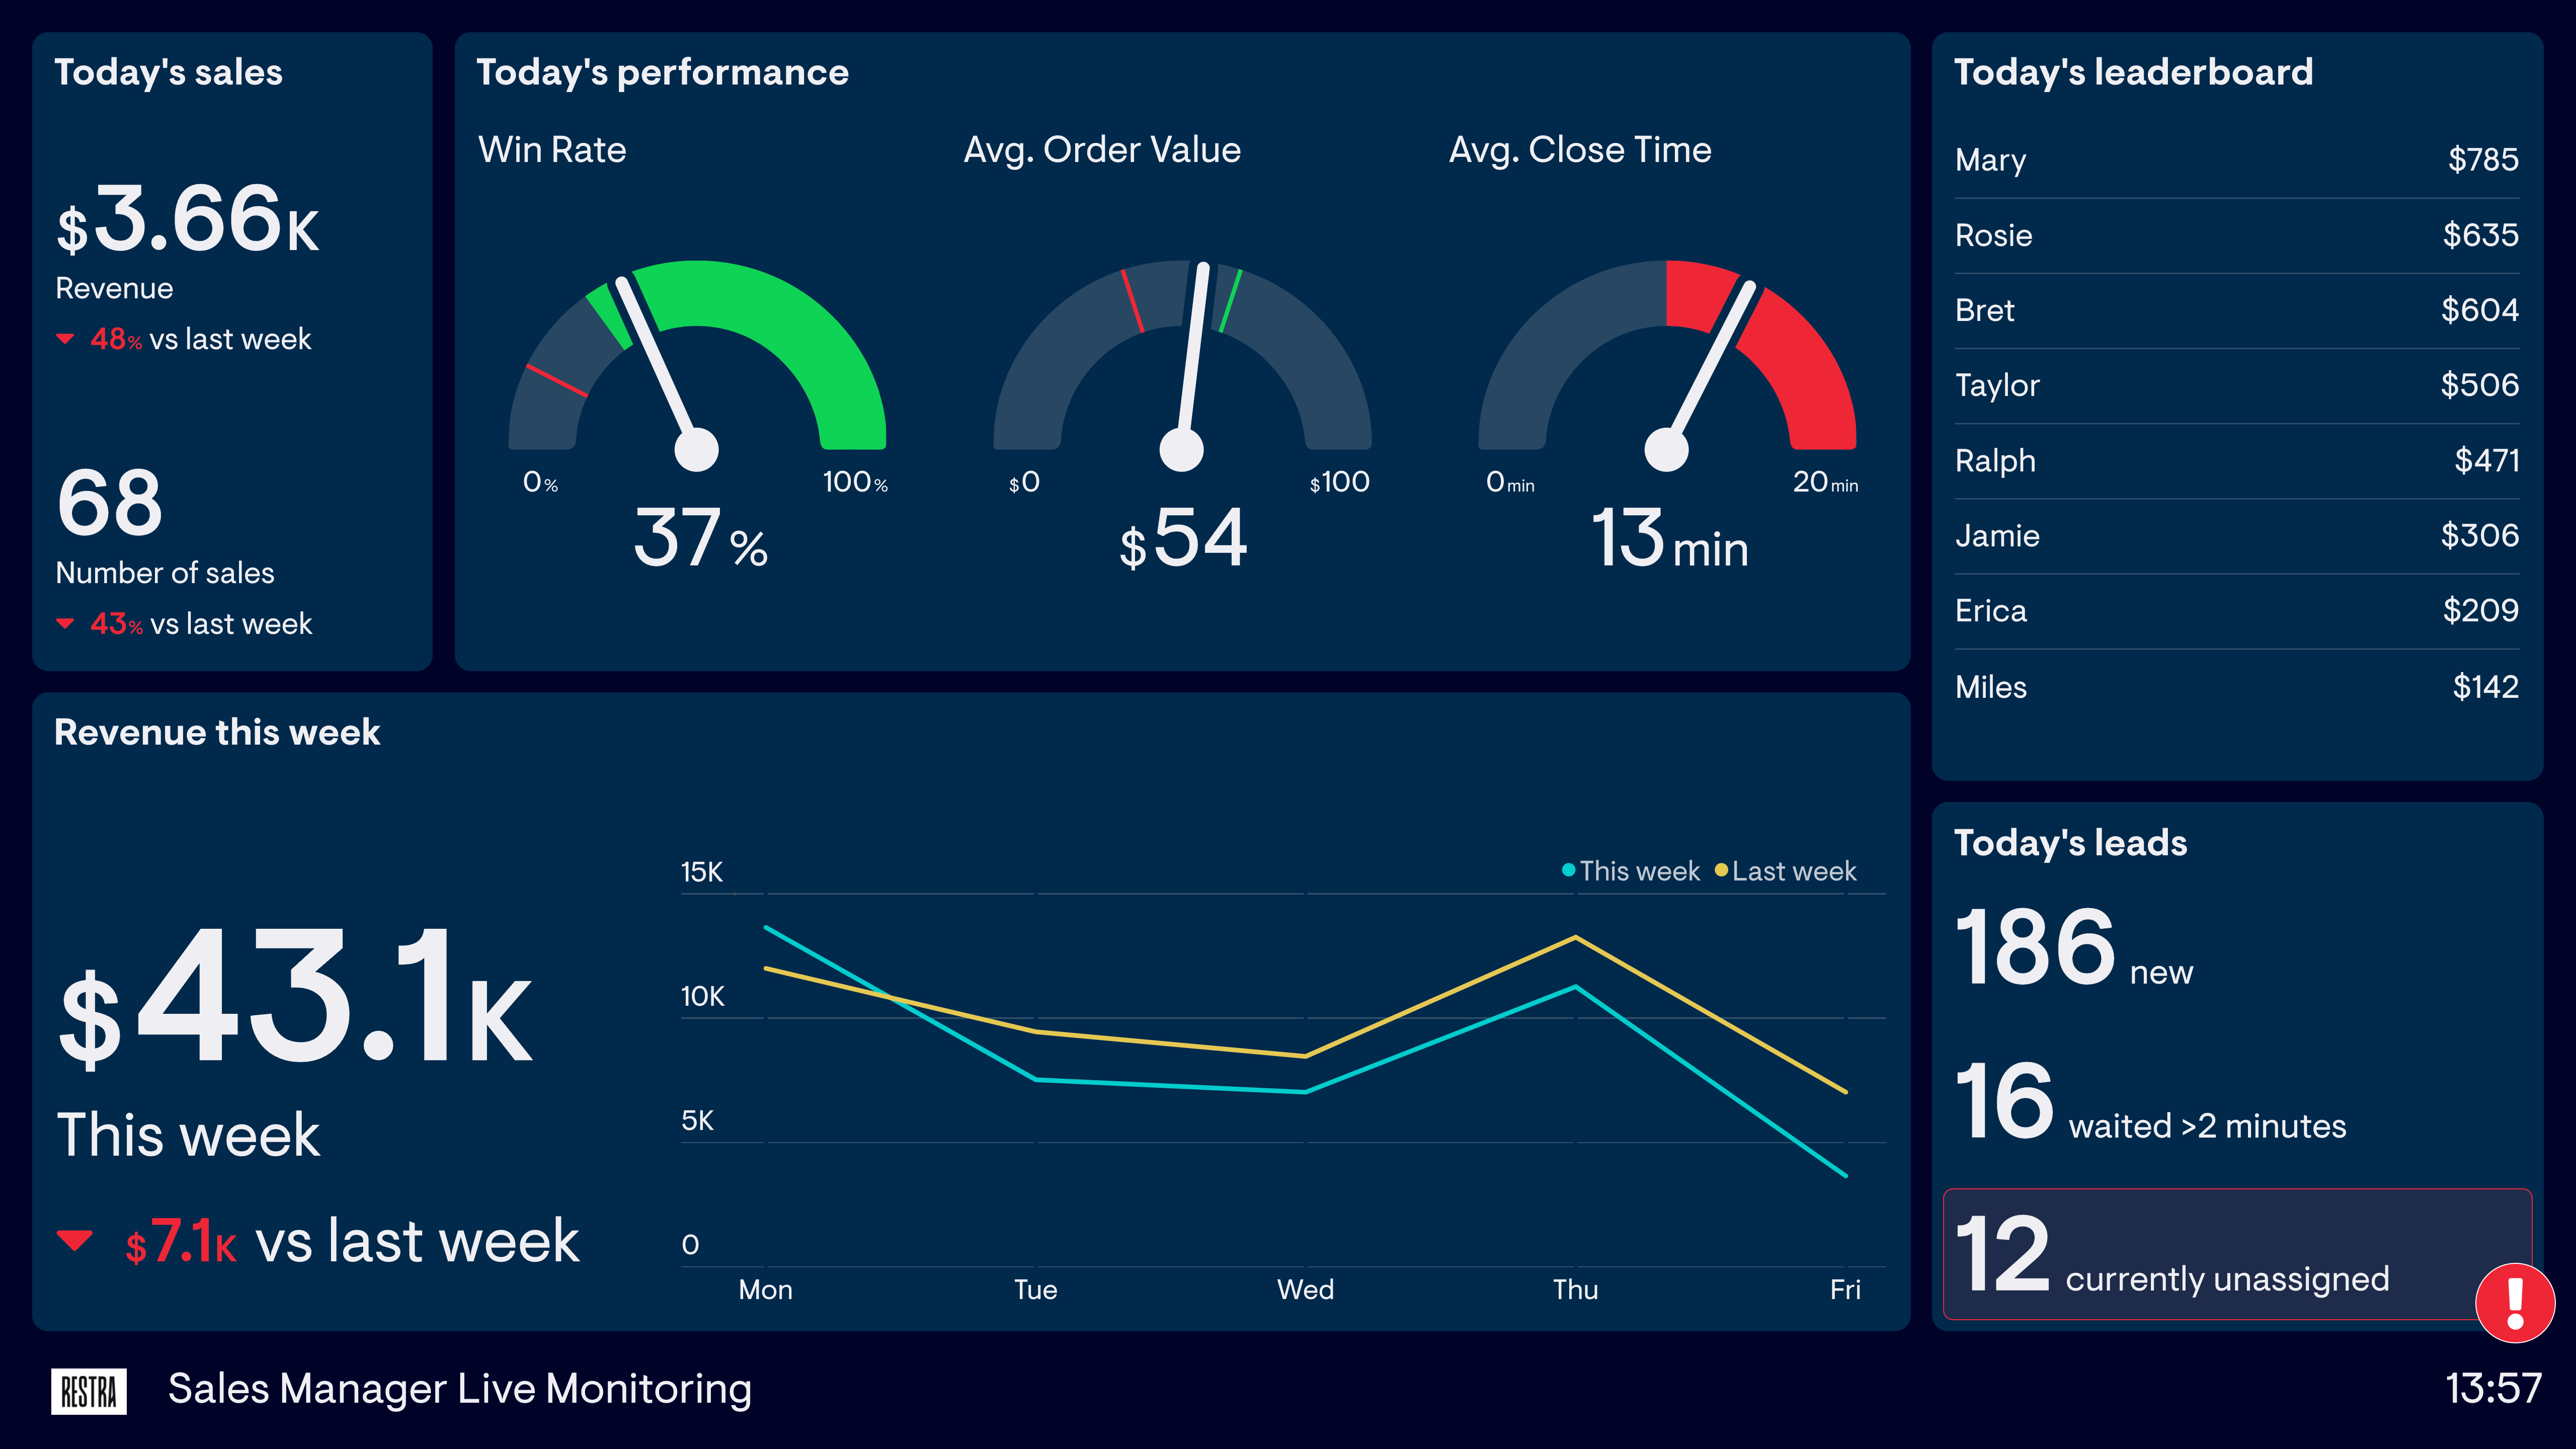
This dashboard is used by a Sales Manager who manages a sales team, which is set up to process a high volume of inbound leads. In a fast-moving environment, there’s a much greater need to monitor the status of current performance and respond to issues as they arise. As a result, this dashboard focuses on important real-time metrics such as Avg. Close Time and Currently Unassigned Leads.
Browse other popular examples
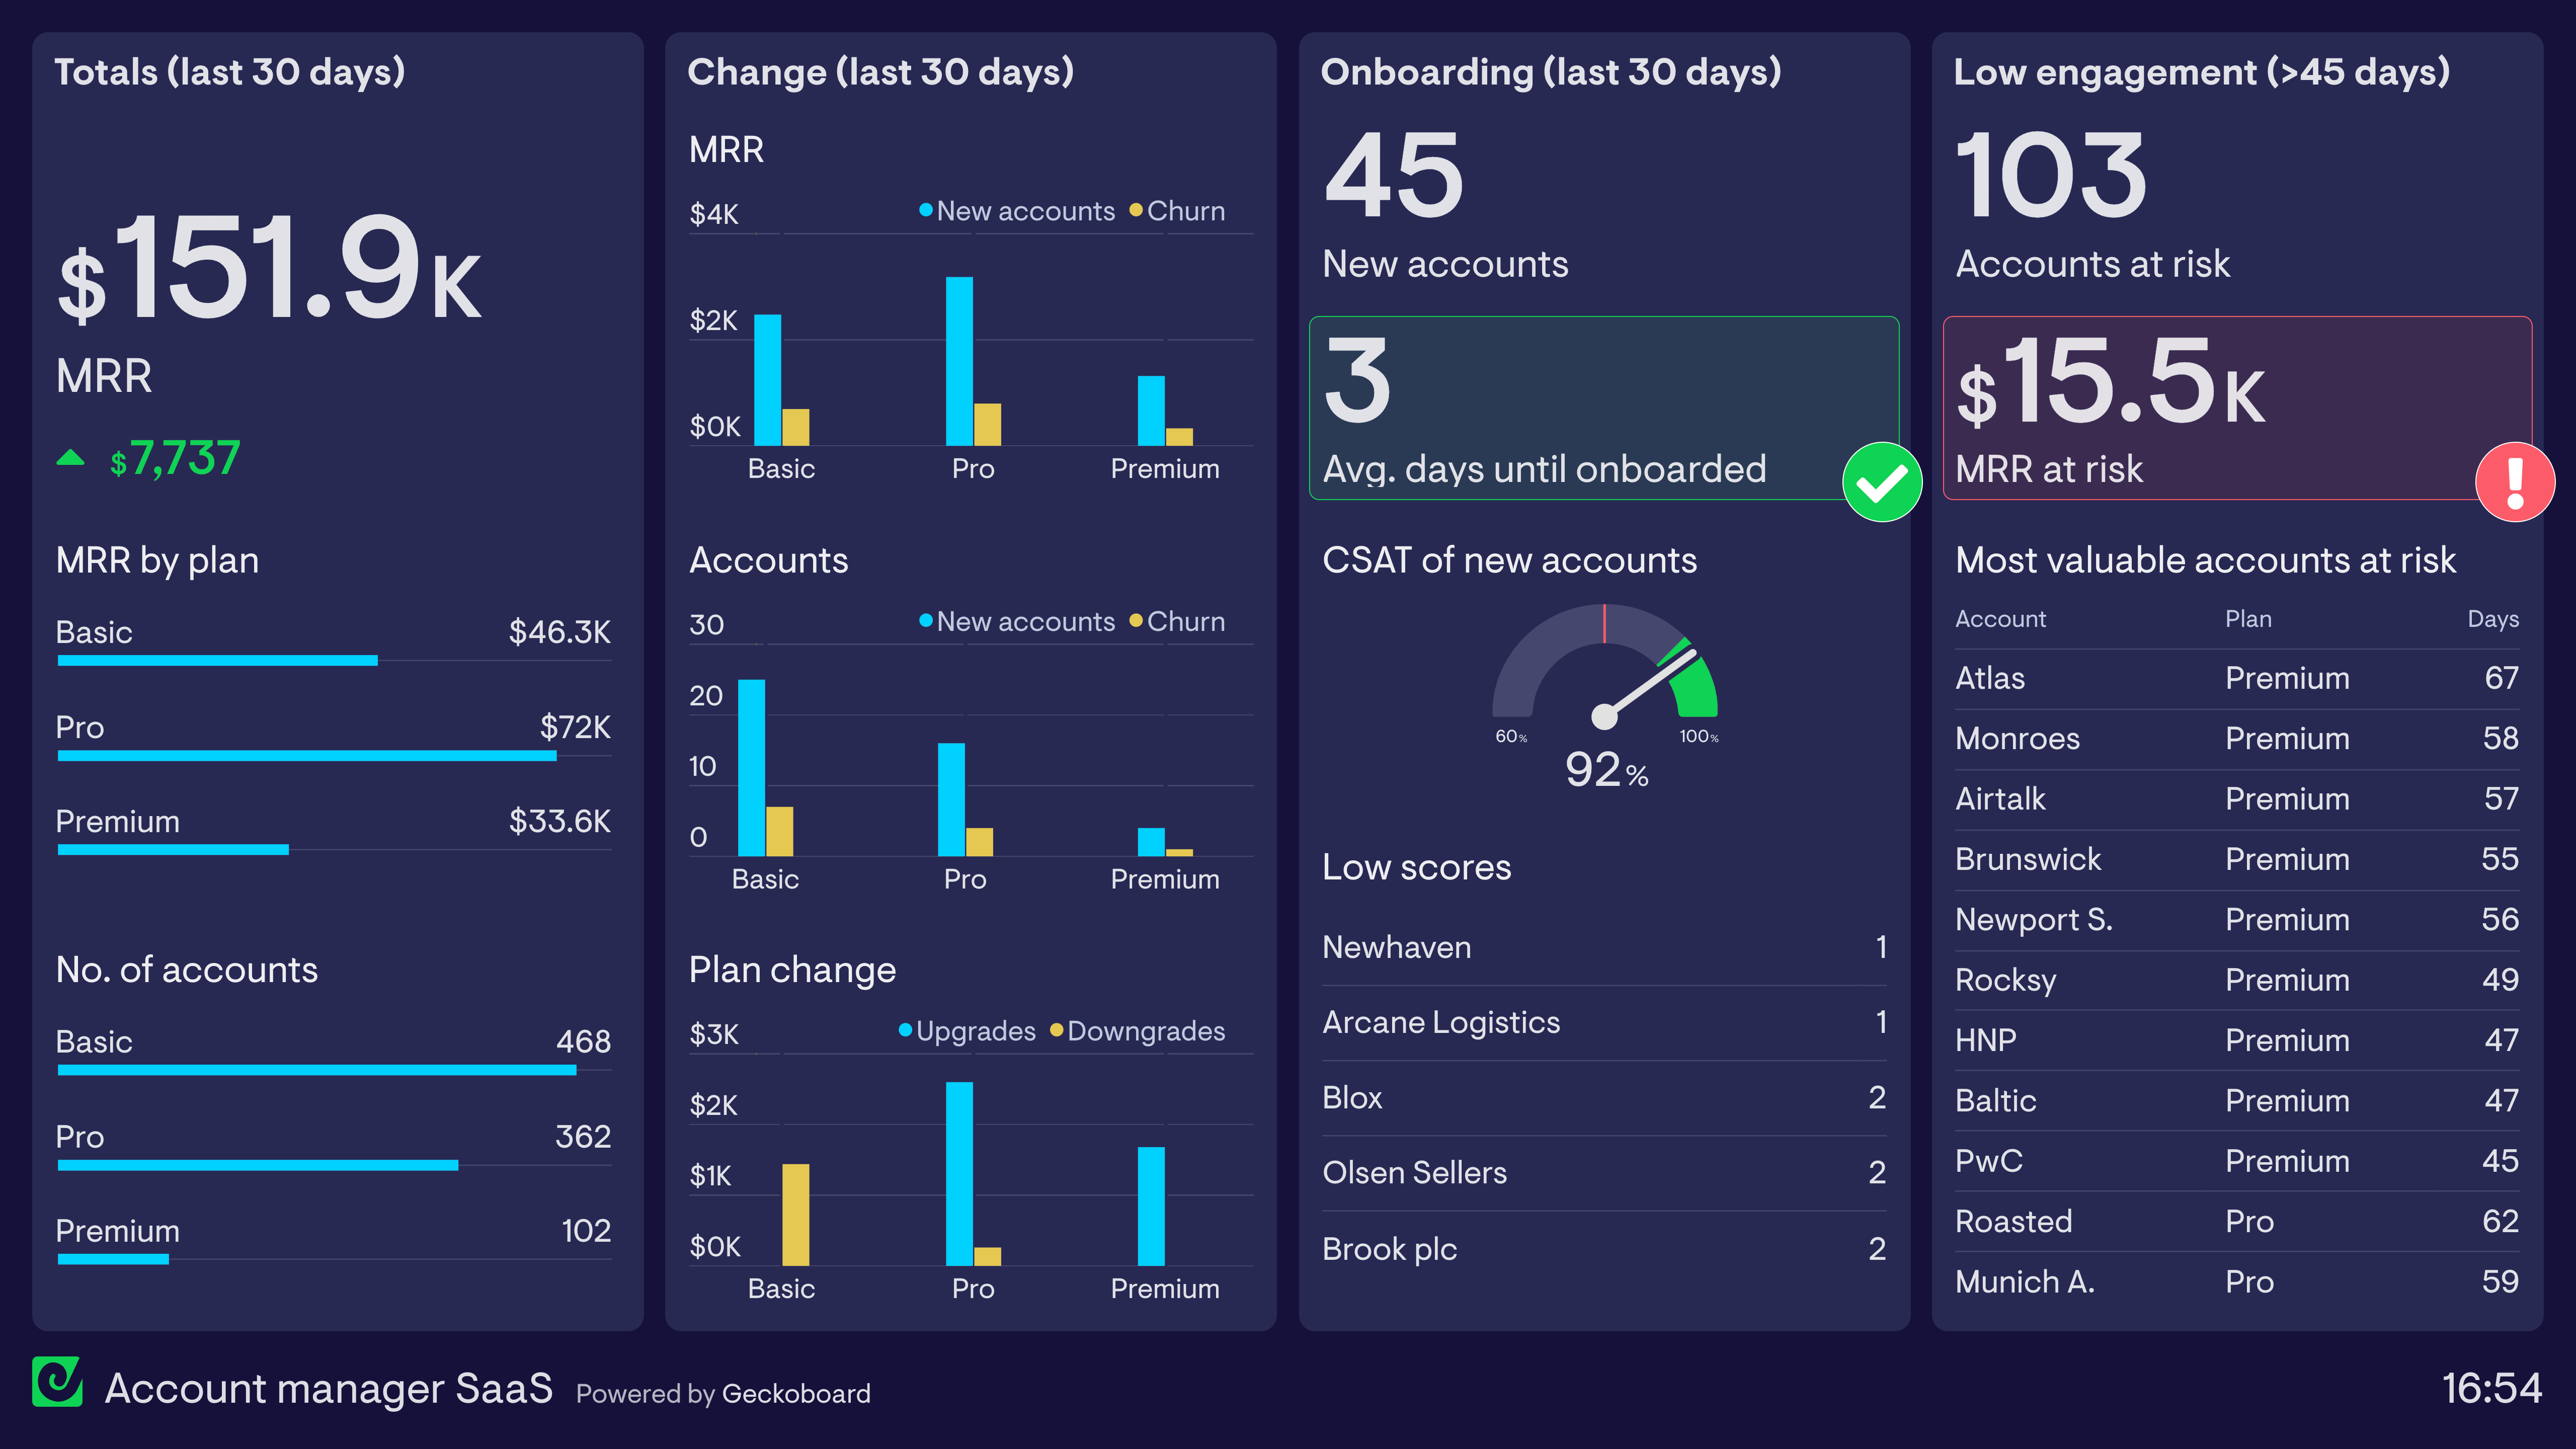
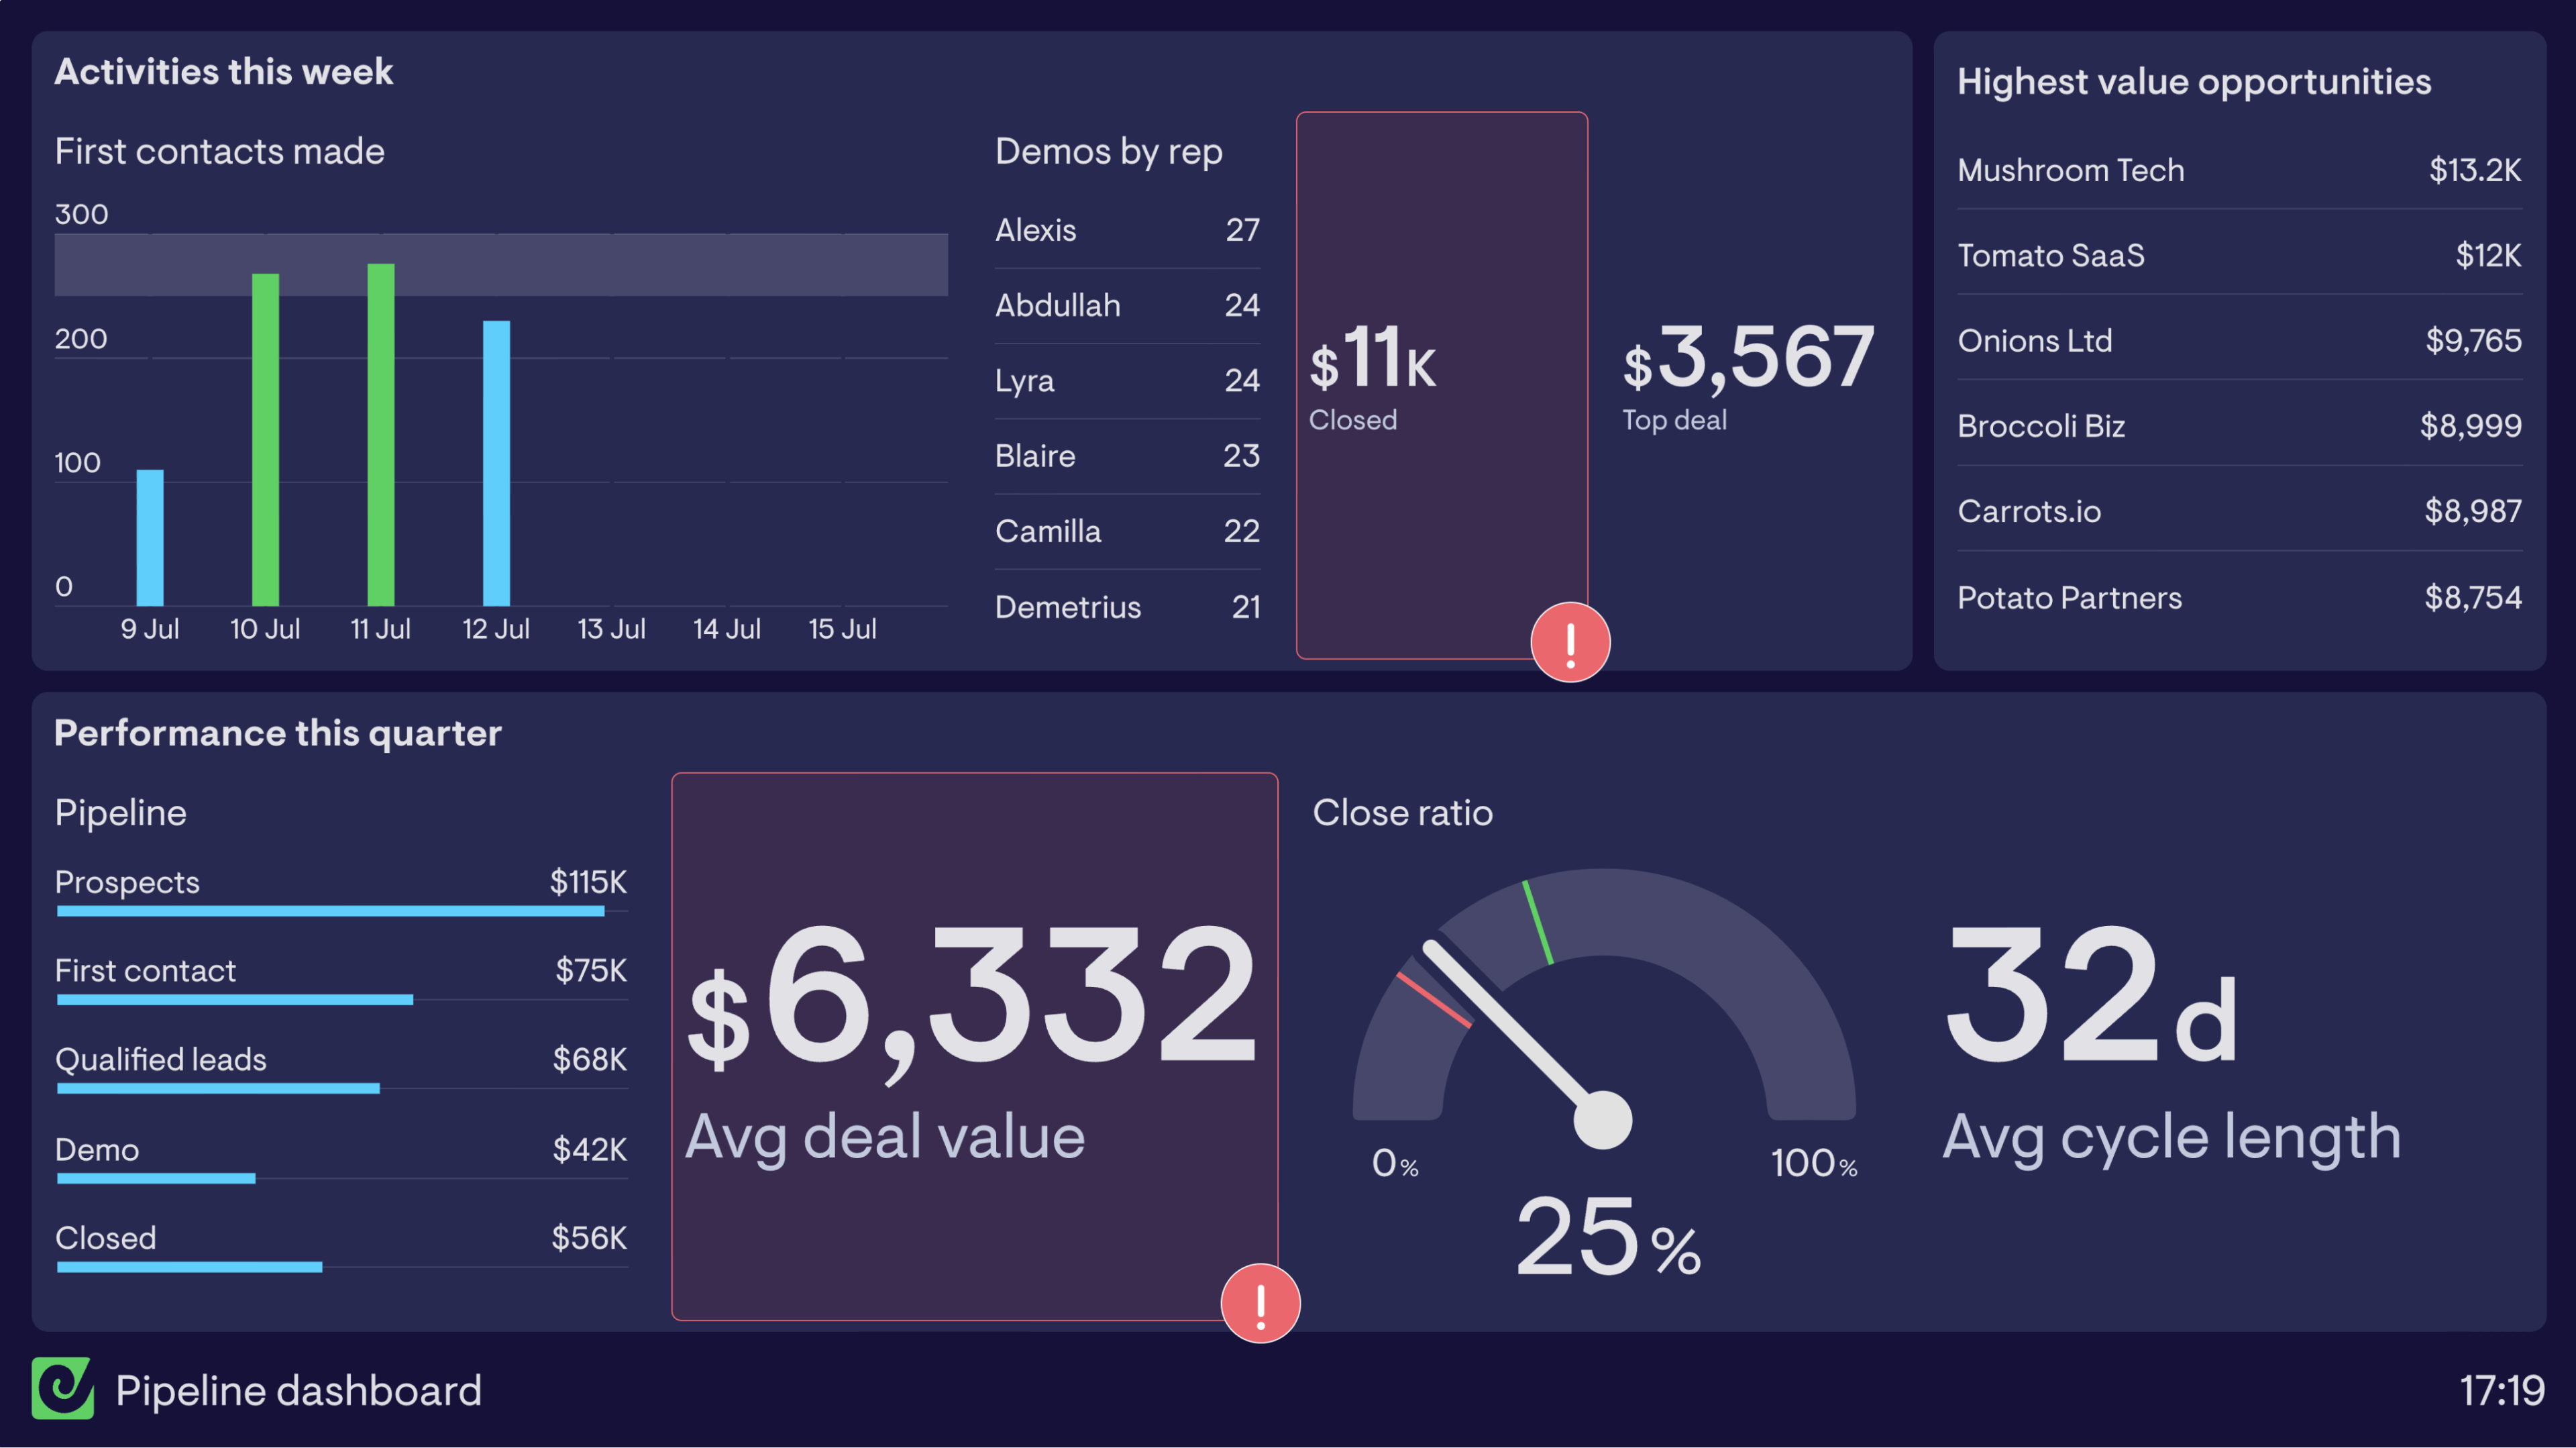
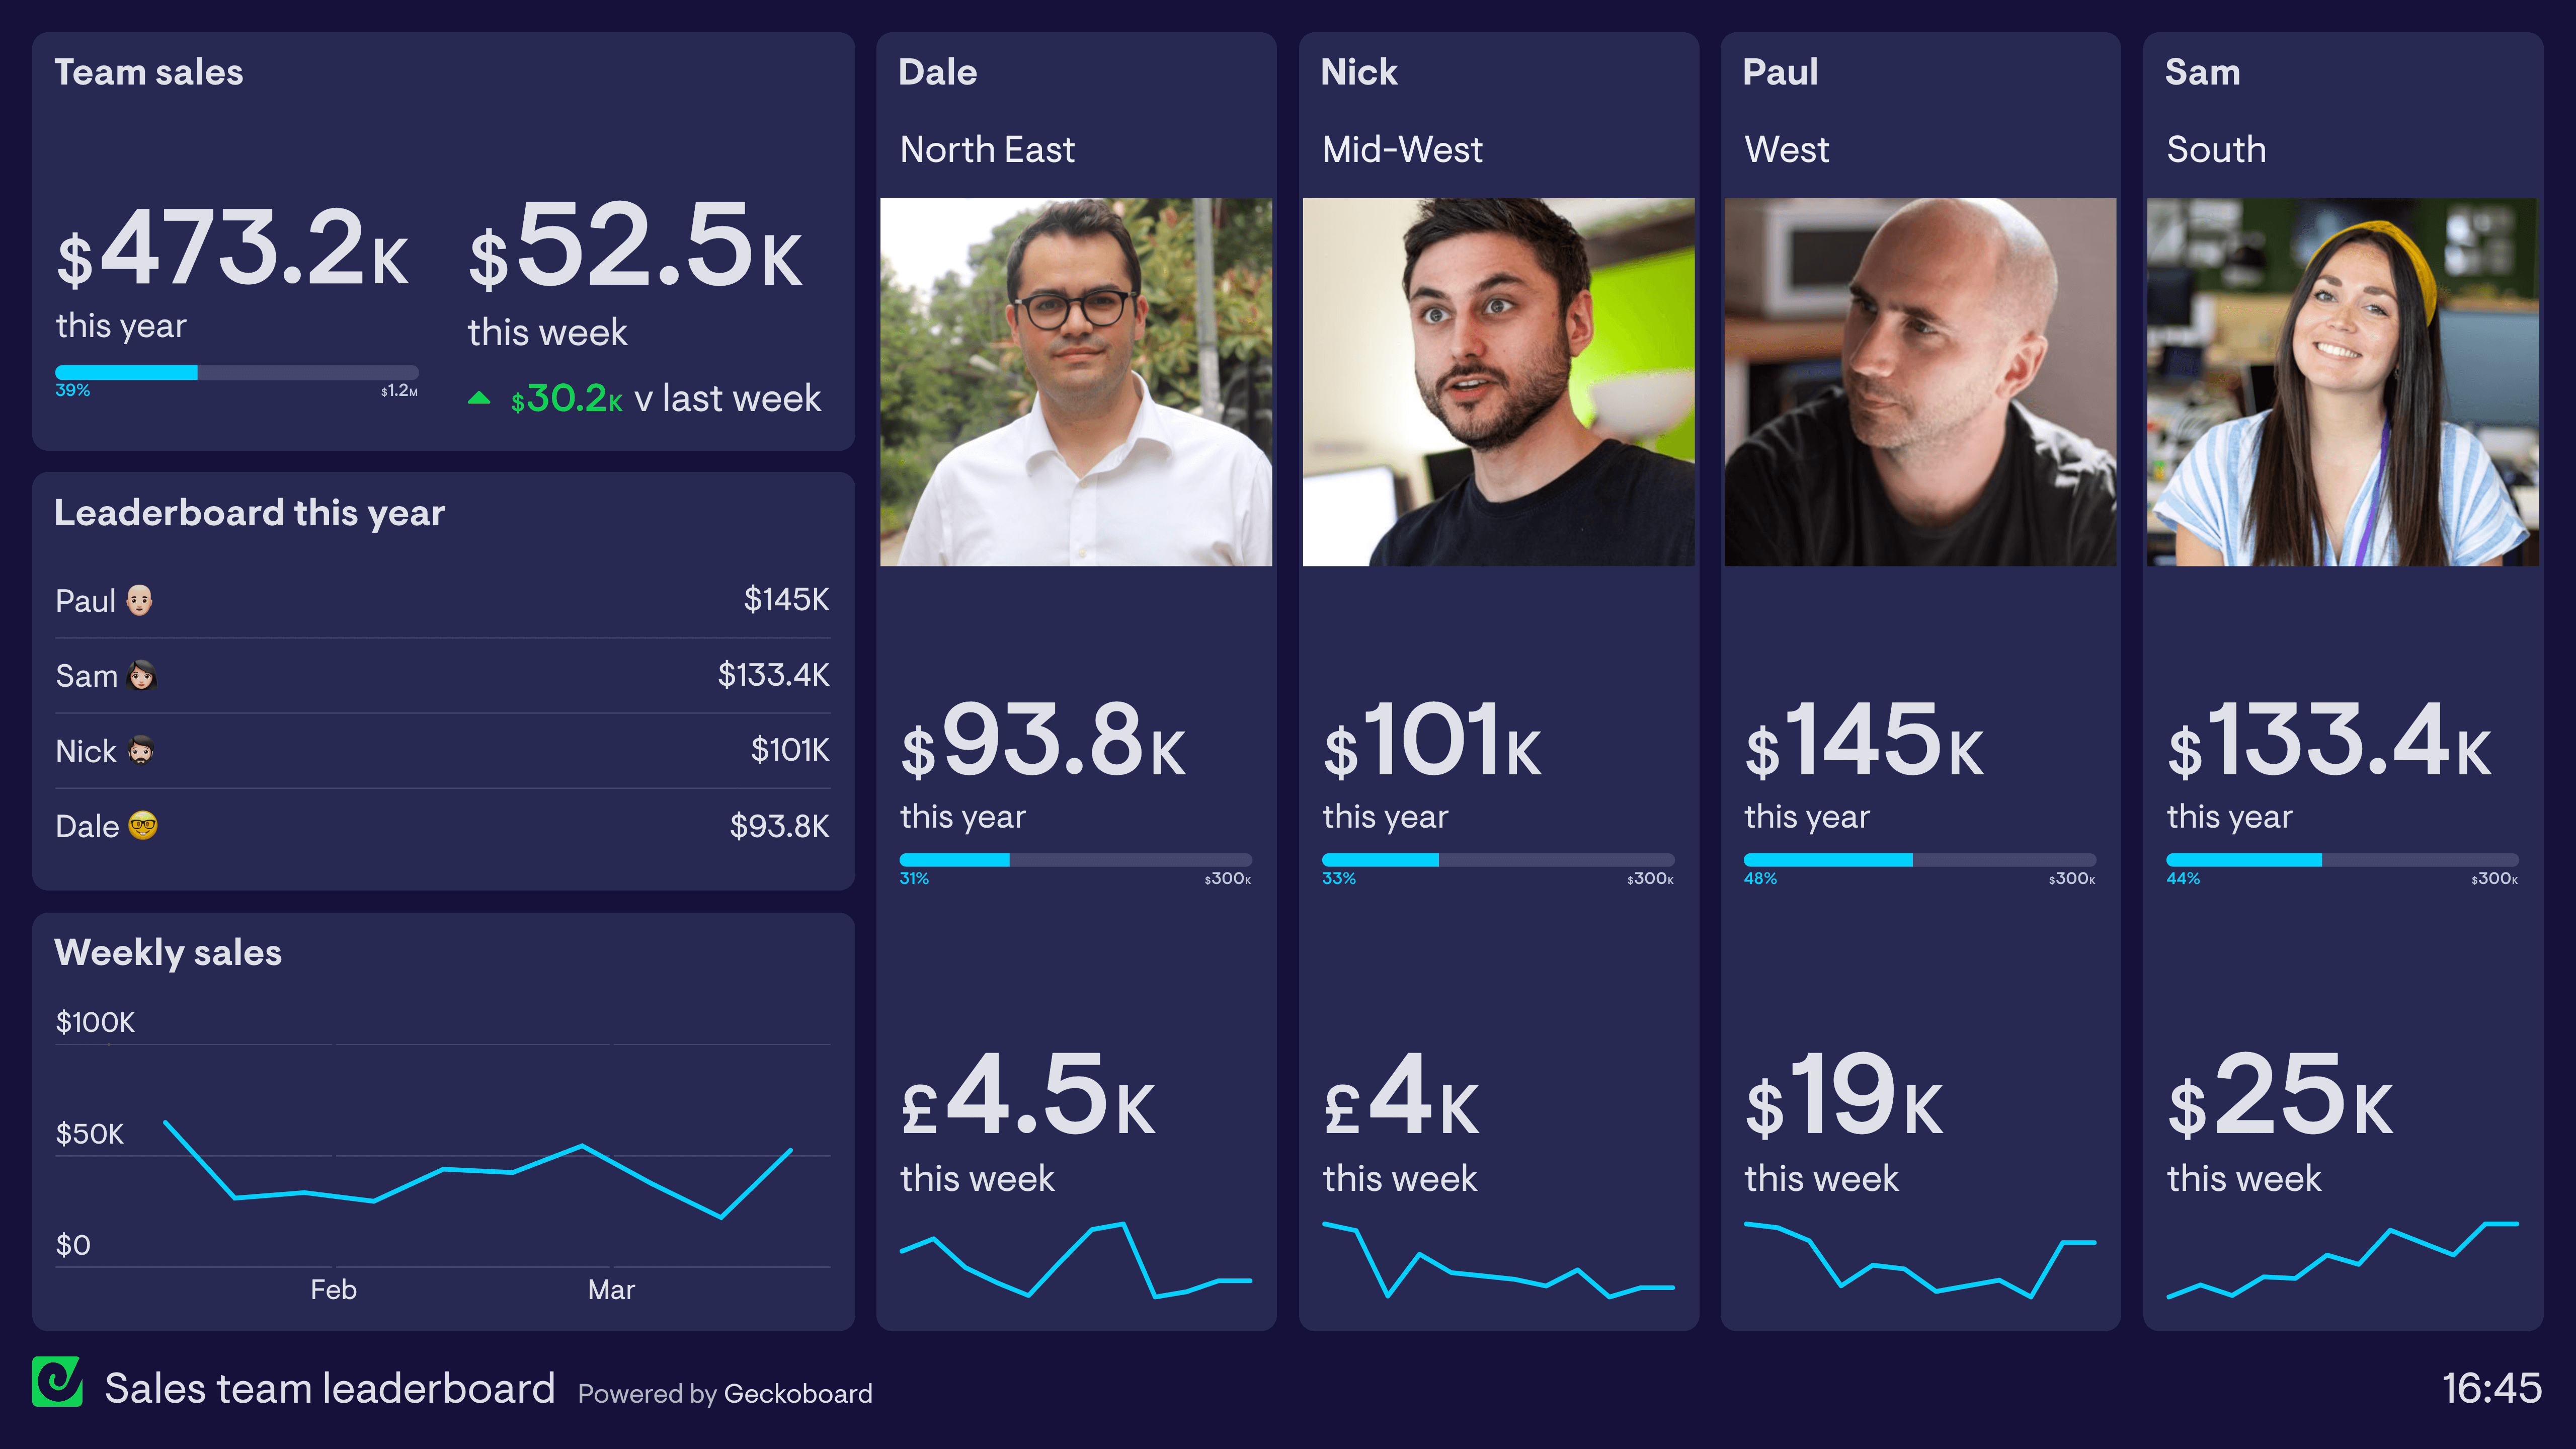
A Sales Manager dashboard gives sales managers a real-time view of team performance, pipeline health, and progress against monthly or quarterly targets. It replaces the need to pull reports from a CRM or ask reps for updates — giving managers the data they need to coach effectively and forecast accurately.
Geckoboard is a live dashboard tool that connects to Salesforce, HubSpot, Stripe and more to give Sales Managers a real-time view of pipeline and team performance. Dashboards update automatically and can be displayed on a screen, shared as a link, or delivered as a daily snapshot to leadership.
Key metrics include revenue vs. target, deals won and lost, pipeline value by stage, new deals created, conversion rate, and individual rep performance. Teams tracking orders and invoices use it to monitor cash flow alongside sales activity.
Building a custom Sales Manager dashboard is straightforward with Geckoboard's dashboard builder. Connect Salesforce, HubSpot, Google Sheets, or Stripe to bring CRM and billing data together, then pick your metrics and build the view you need. Share with your team as a TV dashboard, shared link, or scheduled snapshot. Start a free trial or learn more about how Geckoboard works.
Use it to monitor sales performance in real time so you always know where the team stands against target, not just at the end of the month. It also helps display live rep performance on a shared screen, which creates accountability and encourages healthy competition.