SQL Database dashboards
Geckoboard is the easiest way to create live SQL dashboards
Connect Geckoboard to your database, then use our effortlessly-easy dashboard builder to create powerful data visualizations in a matter of moments.
Why do people use Geckoboard to create SQL dashboards?
Just because you know how to write SQL (Structured Query Language), doesn’t mean you have endless hours in the day to build and design KPI dashboards. Geckoboard takes the hassle out of dashboard design, and makes it easy to communicate your most important metrics to your team.

Easy to set up, easy to build
Enter an SQL query then select the type of visualization you want. You can move, group and resize your visualizations to produce the perfect dashboard

Live KPIs that get seen
Display your dashboard on a TV screen. Share it online via a URL. Or schedule regular snapshots for email and Slack. Geckoboard is made for sharing.

Multiple data sources
Need to create a dashboard from different data sources? No problem. Geckoboard integrates with over 90 data sources including Salesforce, Google Analytics, and Zendesk.
SQL Databases supported by Geckoboard
How does it work?
-

1 Connect your database
To get started, connect your database to Geckoboard. Choose “databases” from our data sources page, then choose your database type. Enter your security details, then create and name your connection. In order to connect to Geckoboard, your database must be publicly accessible via the internet.


-
2 Build a widget
Our dashboards are made up of a series of data visualizations called widgets.
To build a widget using live data from your database, just enter a SQL query, then choose the best visualization type. You can also add a goal to your widget to provide your team with further visual context.


-
3 Complete your dashboard
Continue adding and grouping your visualizations to create a dashboard that’s meaningful to your and your team. You can also add visualizations from other data sources such as Salesforce, Google Ads or Spreadsheets.


-
4 Share your dashboard
You can invite colleagues to view real-time data in Geckoboard, or you can share dashboard in other ways. Display live dashboards on a TV, access via mobile, create a sharing URL or schedule snapshots of your dashboard direct to email and Slack.


At a glance, everyone in our organization can instantly see how we’re doing. And it looks fantastic – large, easy to read, and intuitive!

Who uses SQL dashboards?
Geckoboard is used by everyone from Founders, to Finance Directors, Warehouse managers to Customer Support teams.
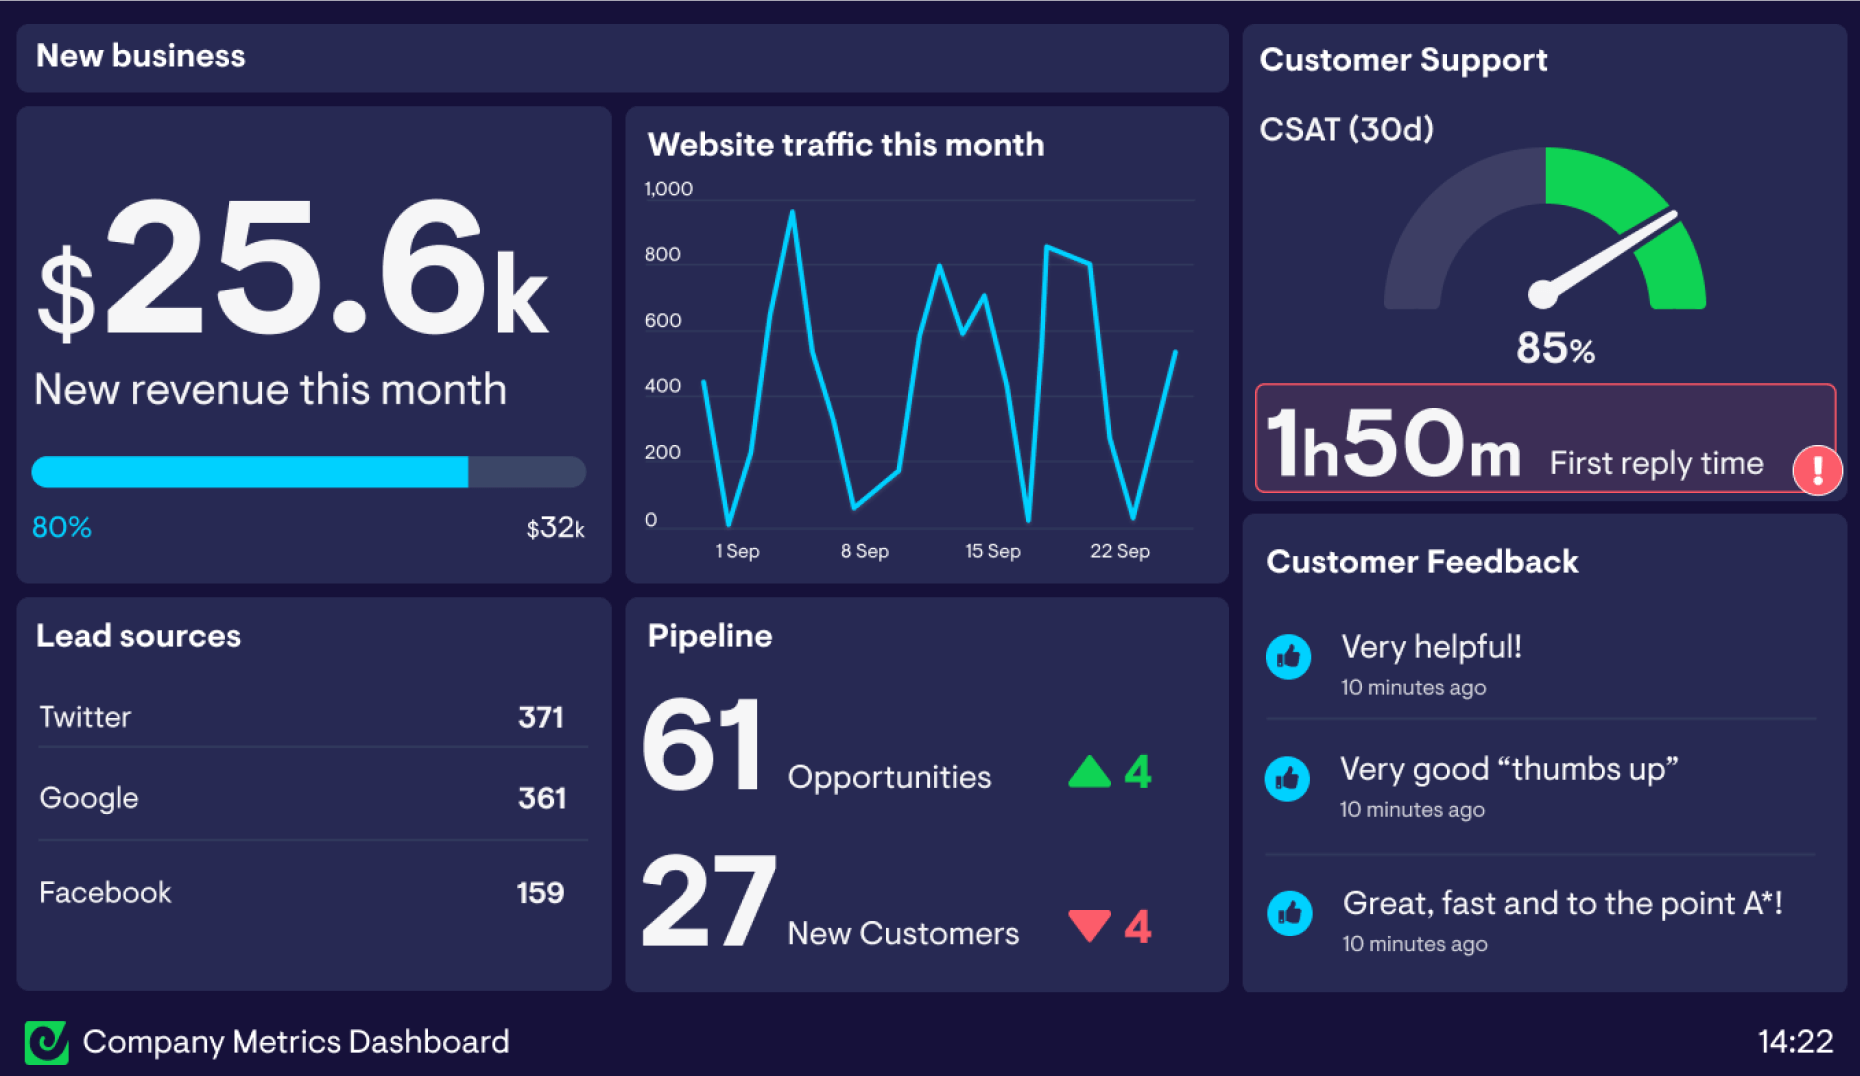
Company Overview
This dashboard has been built to keep the entire company aligned with crucial MI (Management Information) about the company’s growth and finance performance. It’s been created with data from a MySQL database.
However, it also includes data from Mixpanel and Google Sheets.
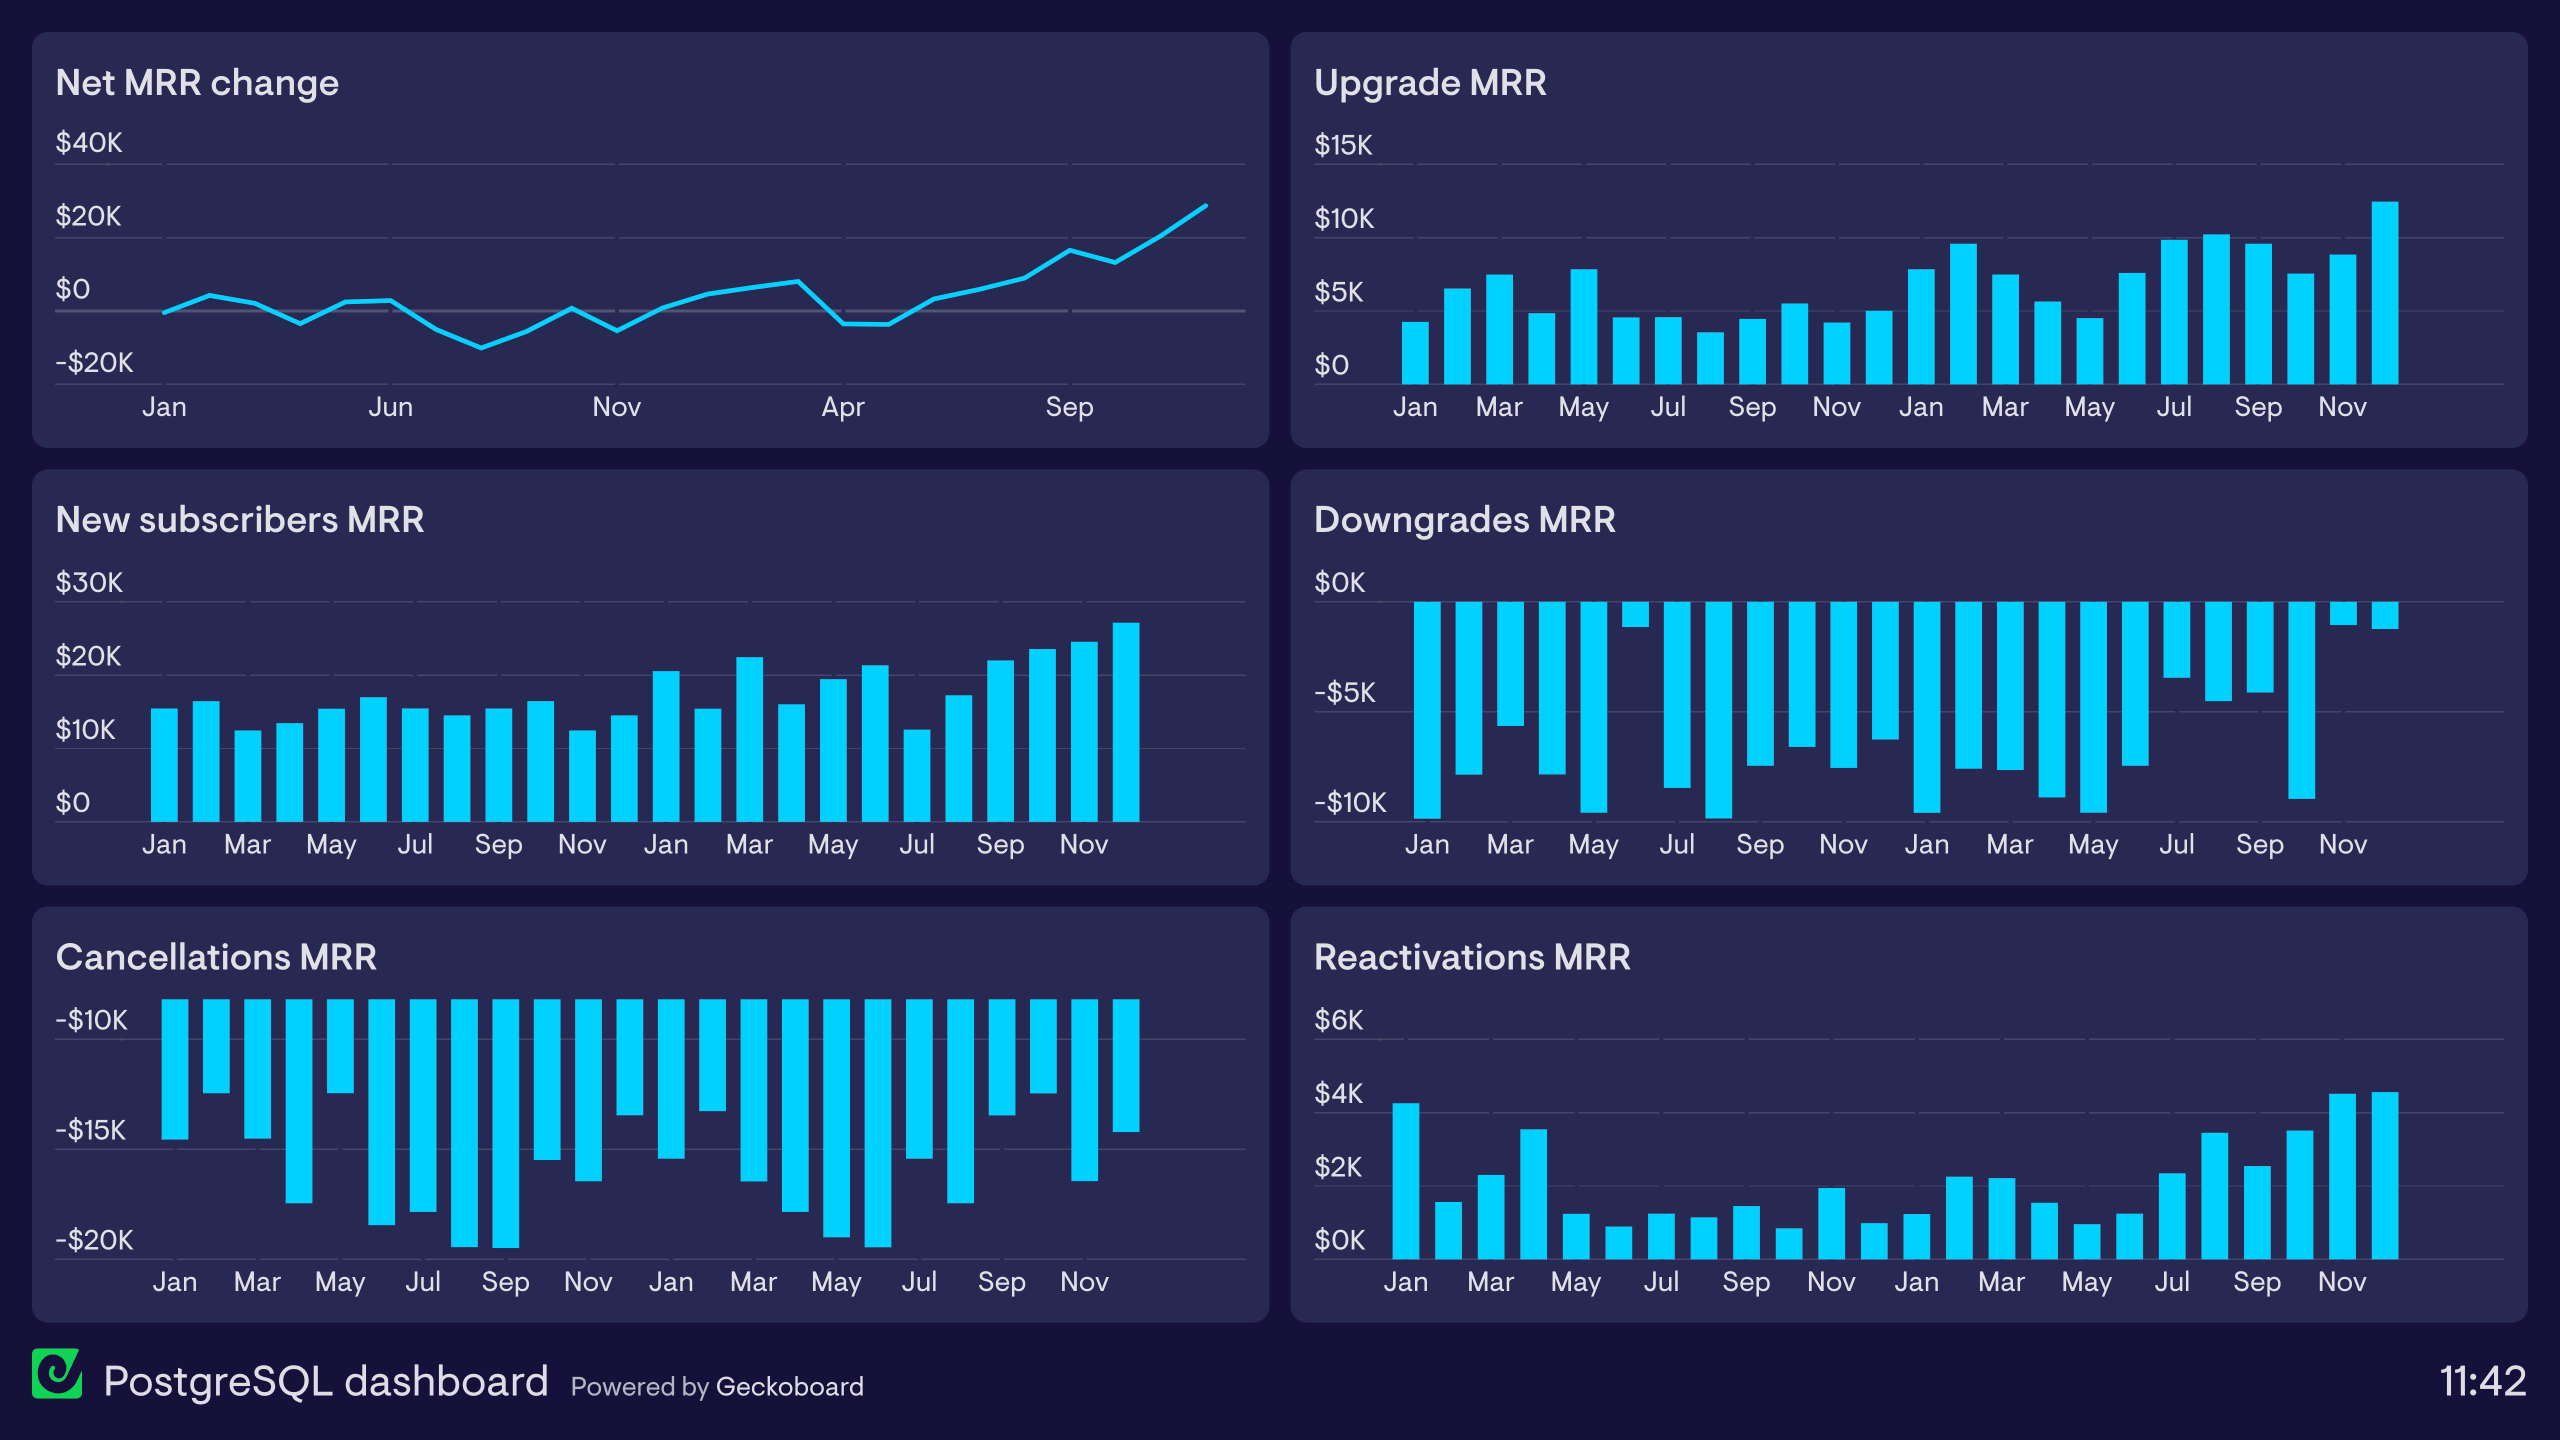
Monthly Finances
The dashboard has been built by a CFO and is designed to provide her SaaS company with a long term view of their financial performance.
By visualizing how MRR is changing each month, the whole company has a better understanding of how the business is doing financially.
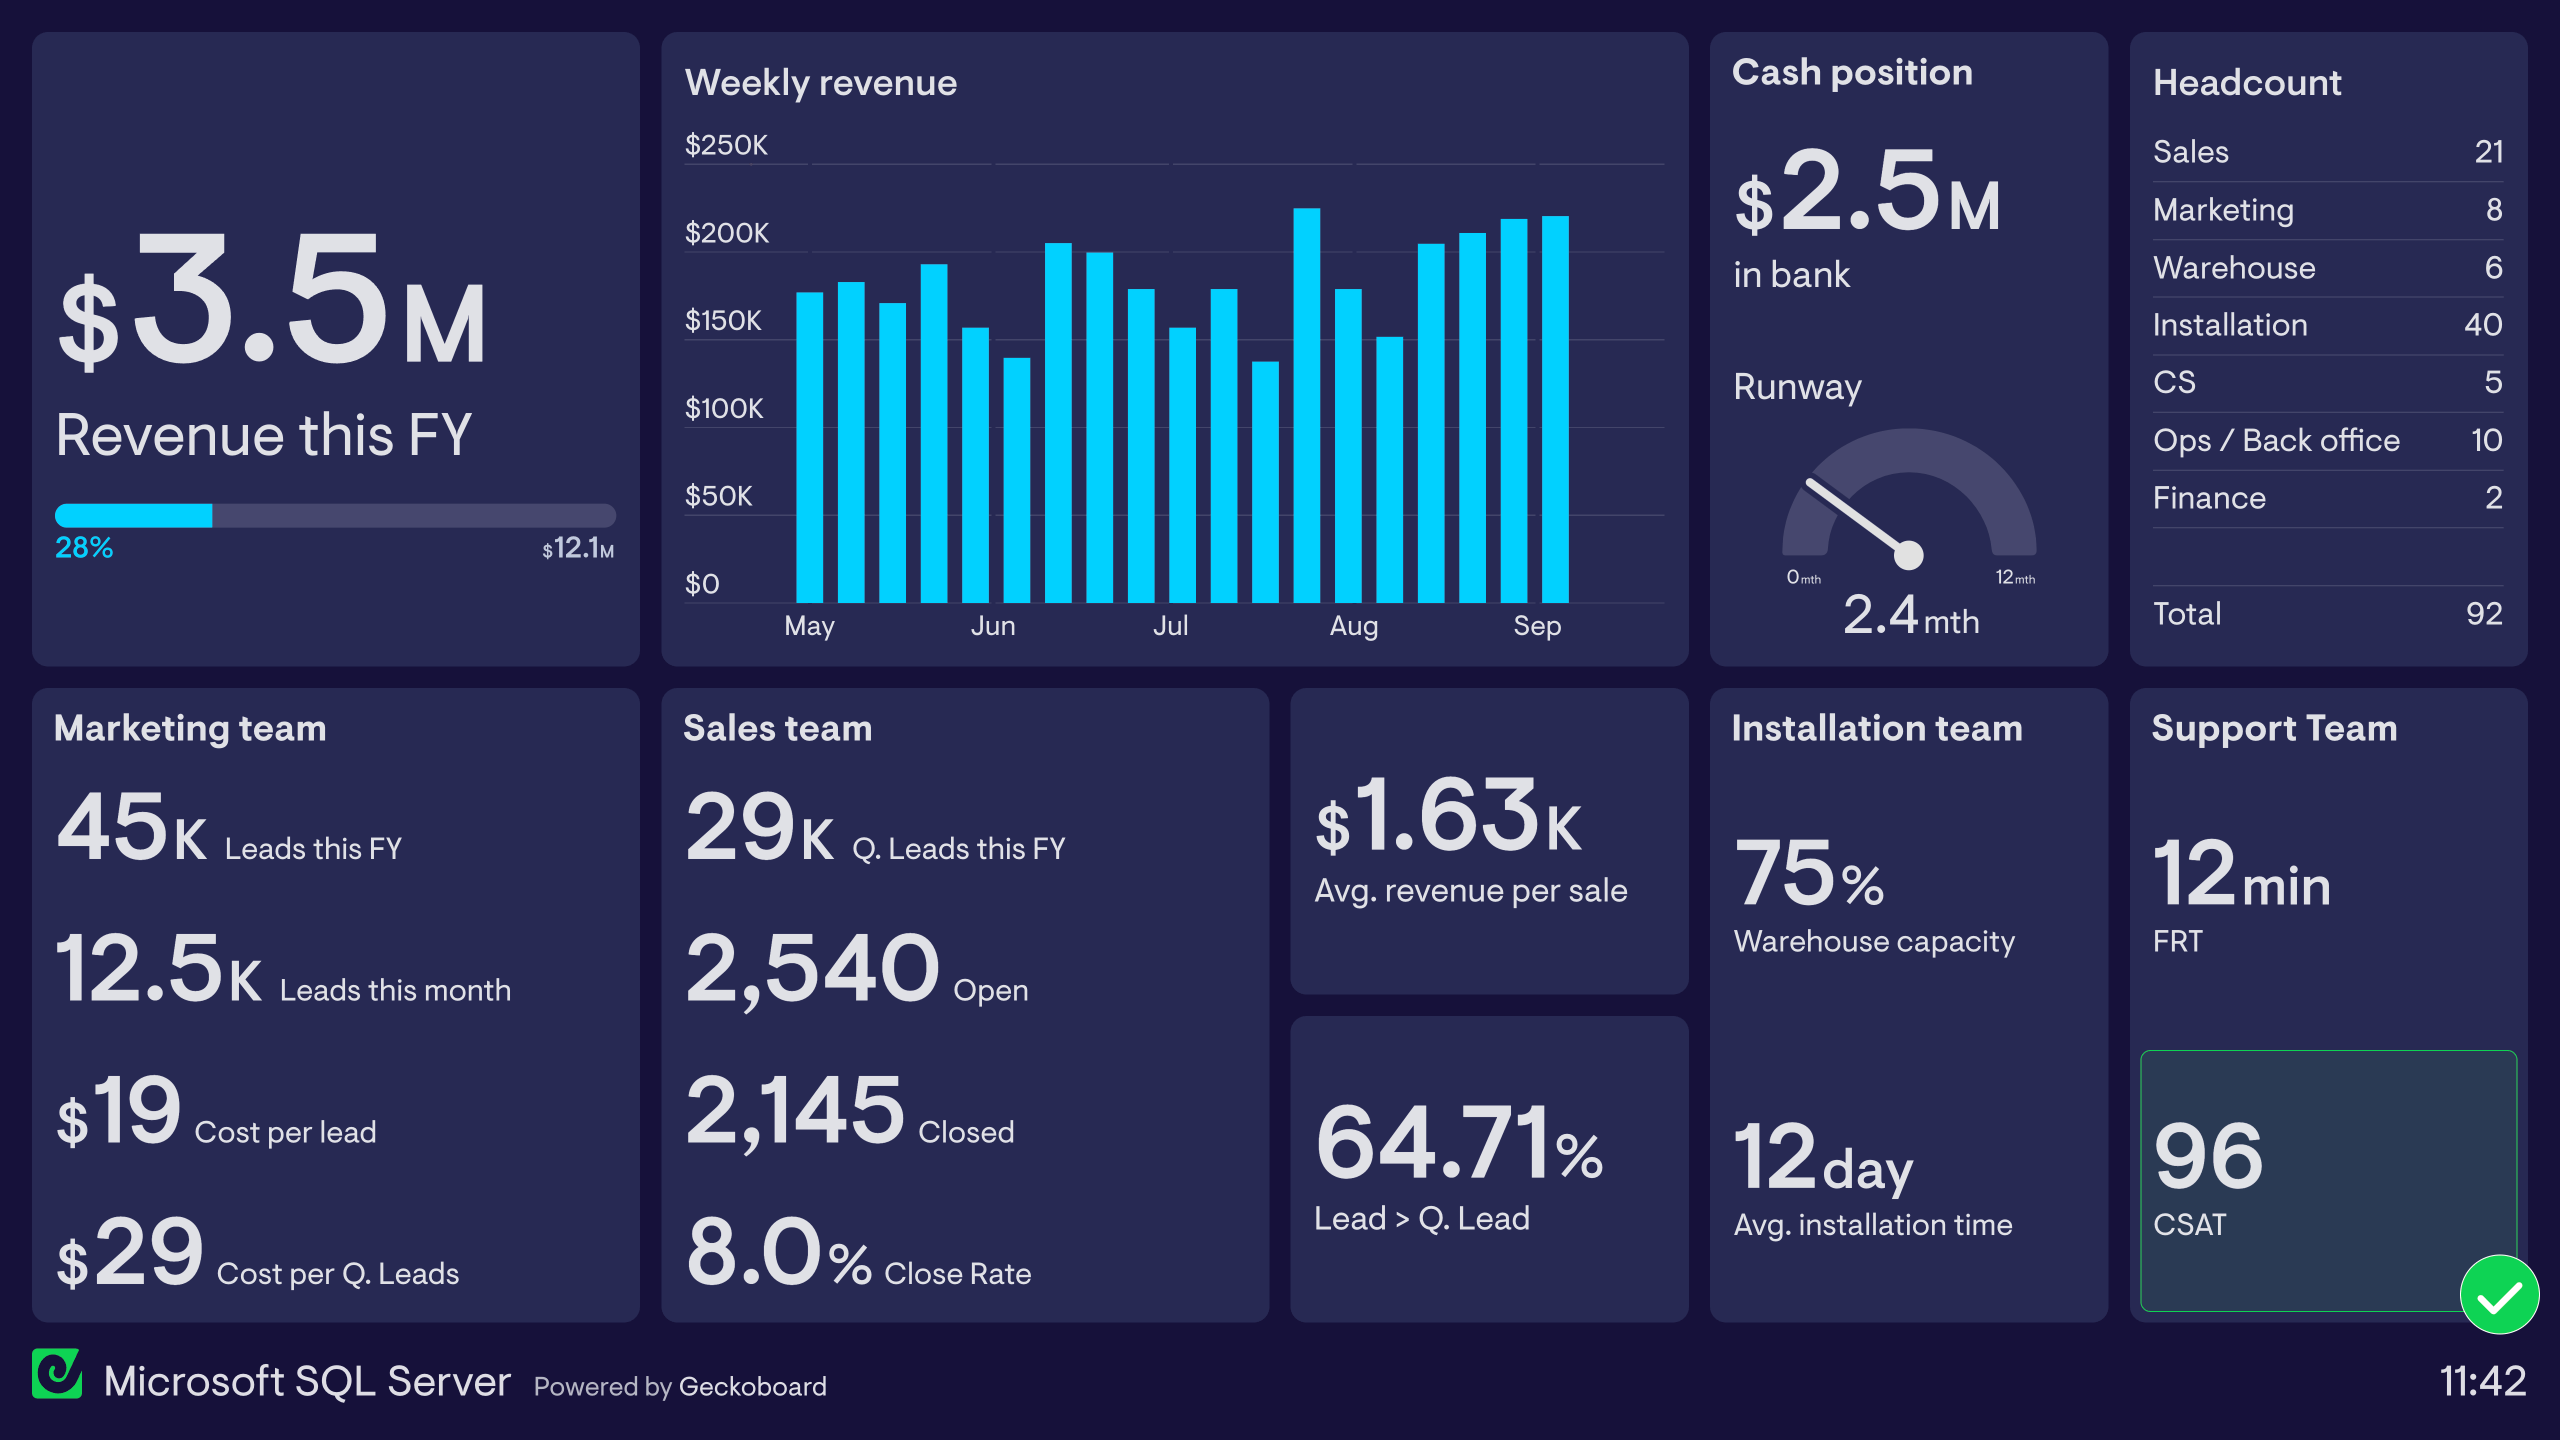
Team KPIs
This dashboard displays KPIs from the different teams in the business – including Sales, Marketing, Finance, Operations and Customer Support.
By seeing how each team’s performance contributes to the whole, everyone feels more motivated with a shared sense of purpose.