Share dynamic dashboards, powered by Google Sheets
Make your data come alive with real-time Google Sheets dashboards.
Direct Connection
Link directly with Google Drive and immediately access your Sheets.
Auto-refresh
See changes reflected on your dashboard within minutes of updates in your Google Sheets.
Access Anywhere
View and share read-only Google Sheets dashboards designed for desktop, mobile and TV.
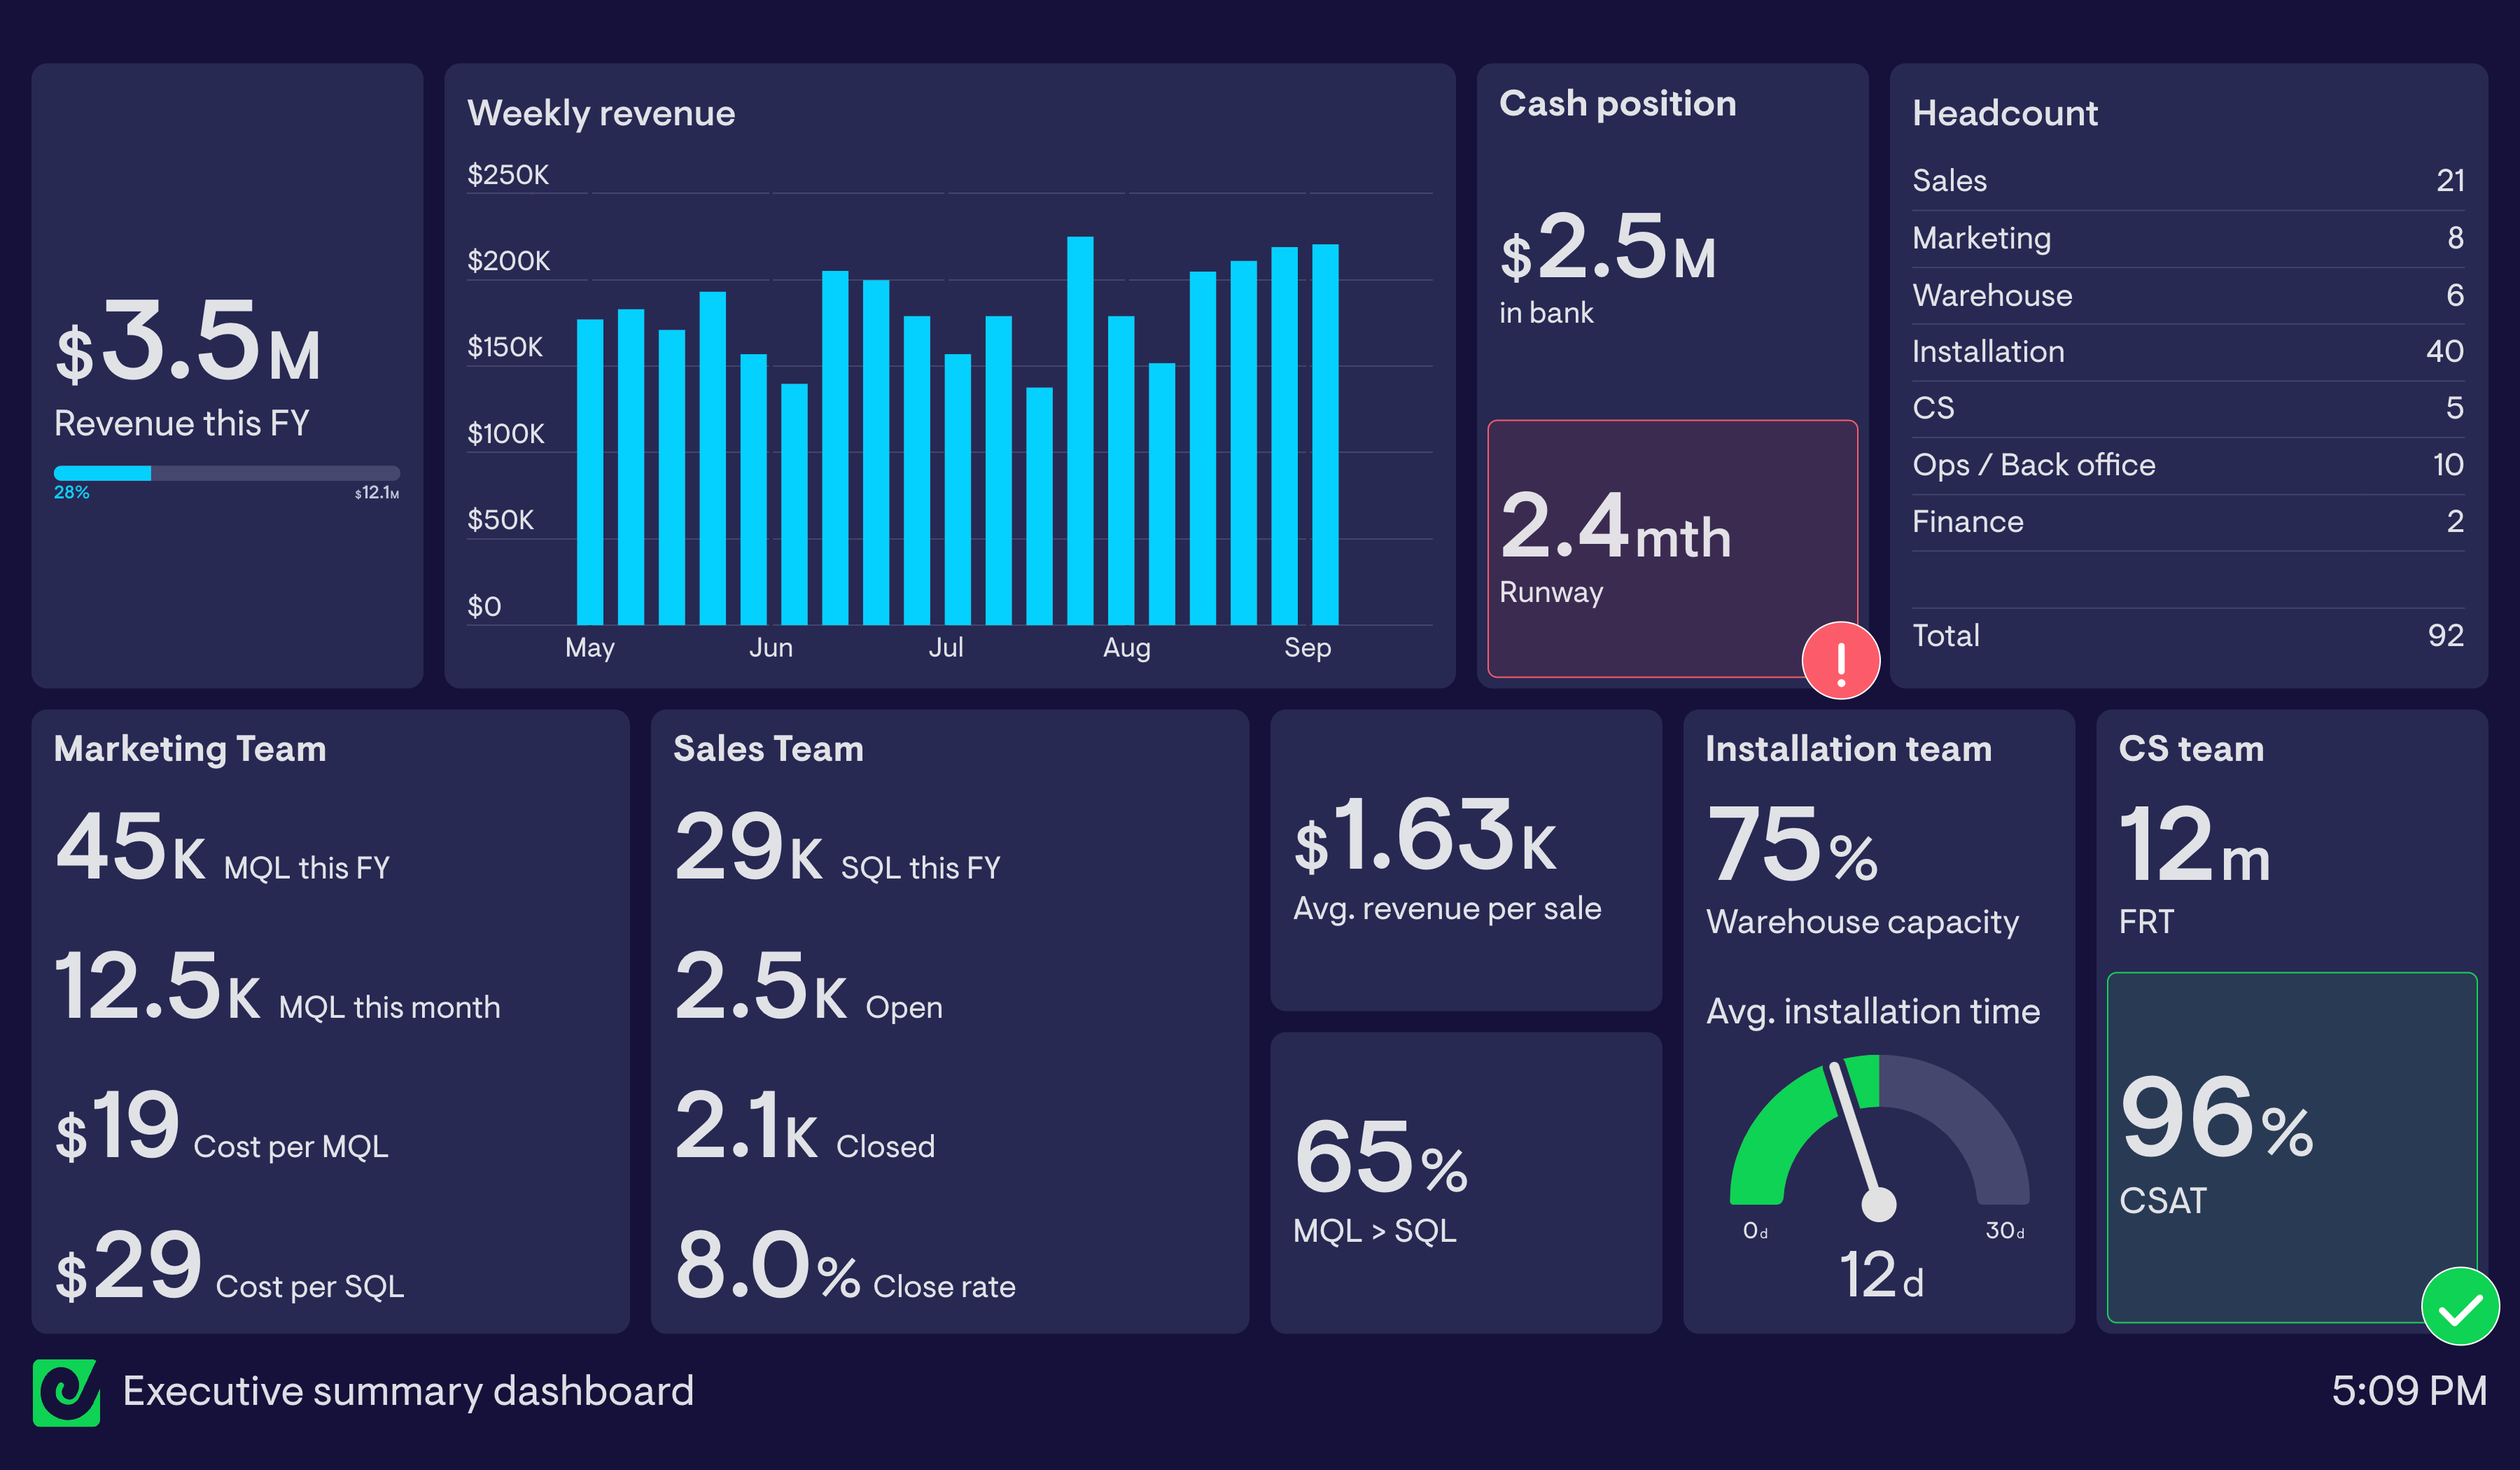
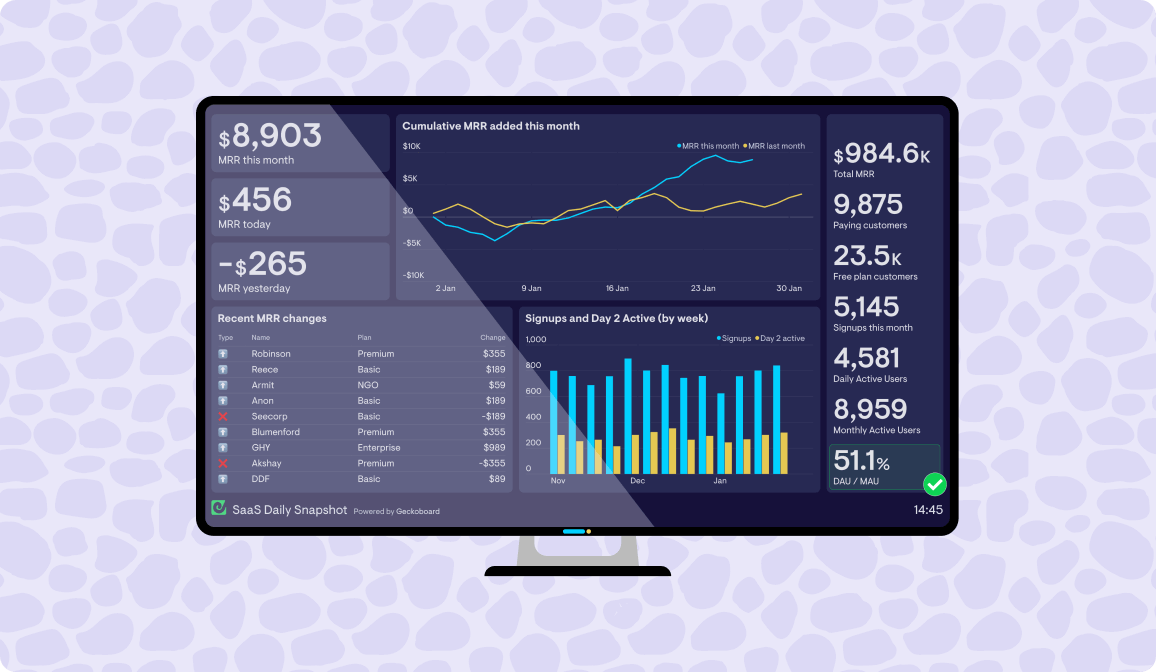
Turn Google Sheets data into easy-to-understand dashboards
Easily create dashboards using your Google Sheets data to keep stakeholders in the loop, enhance team productivity and encourage data-driven decision making.
Easily work with your data
Directly link Google Sheets from your Google Drive and start visualizing data in minutes.
Present data effectively
Make data from Google Sheets easy for teams and stakeholders to understand and act on.
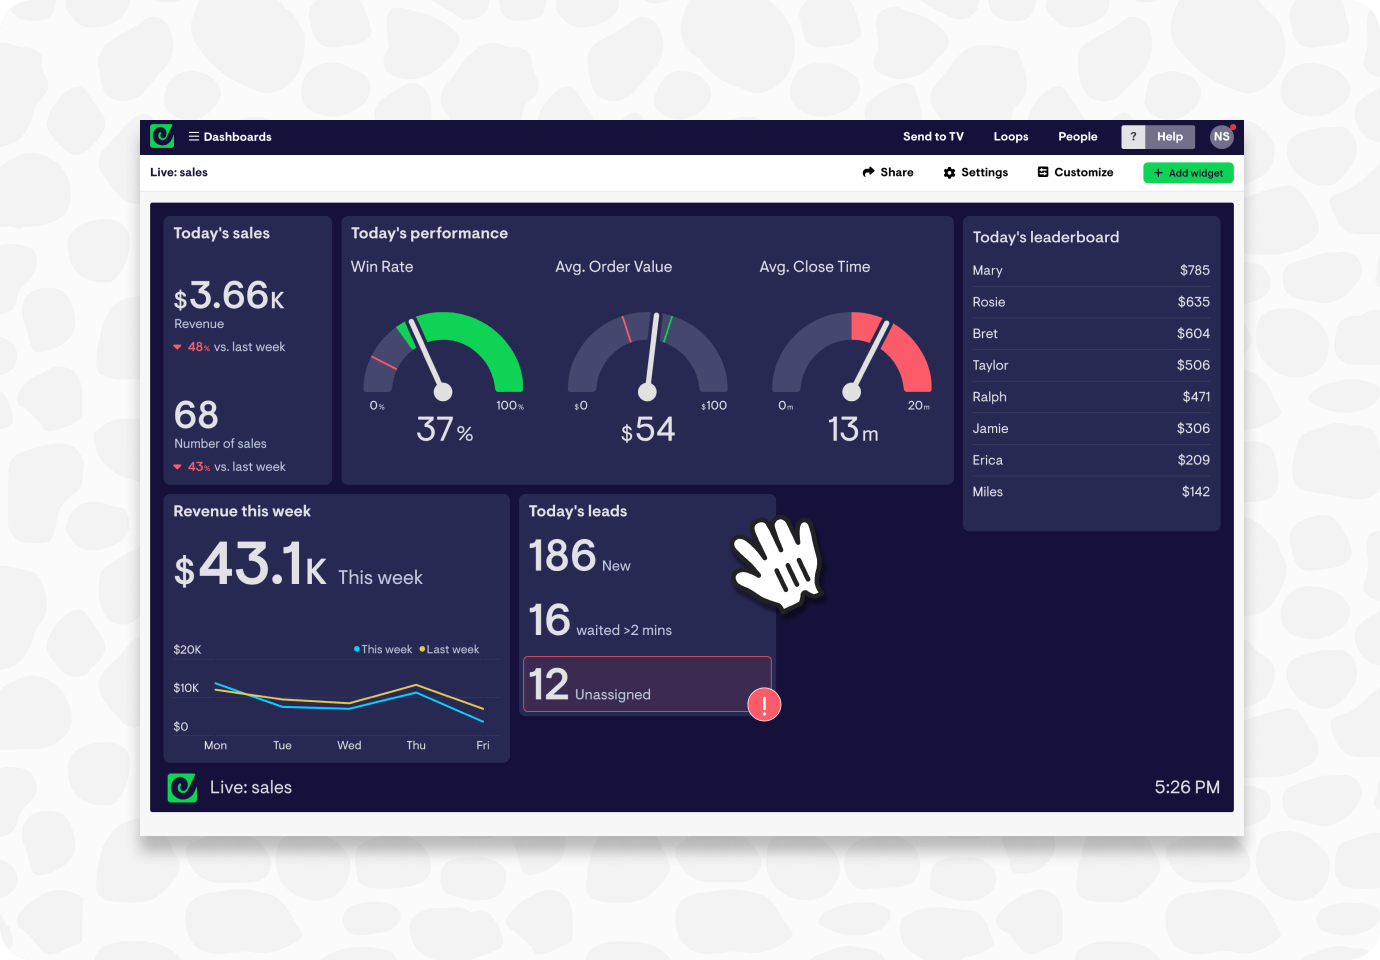
Drag-and-drop customization
Arrange and resize your dashboard elements effortlessly to suit your team’s needs.
-
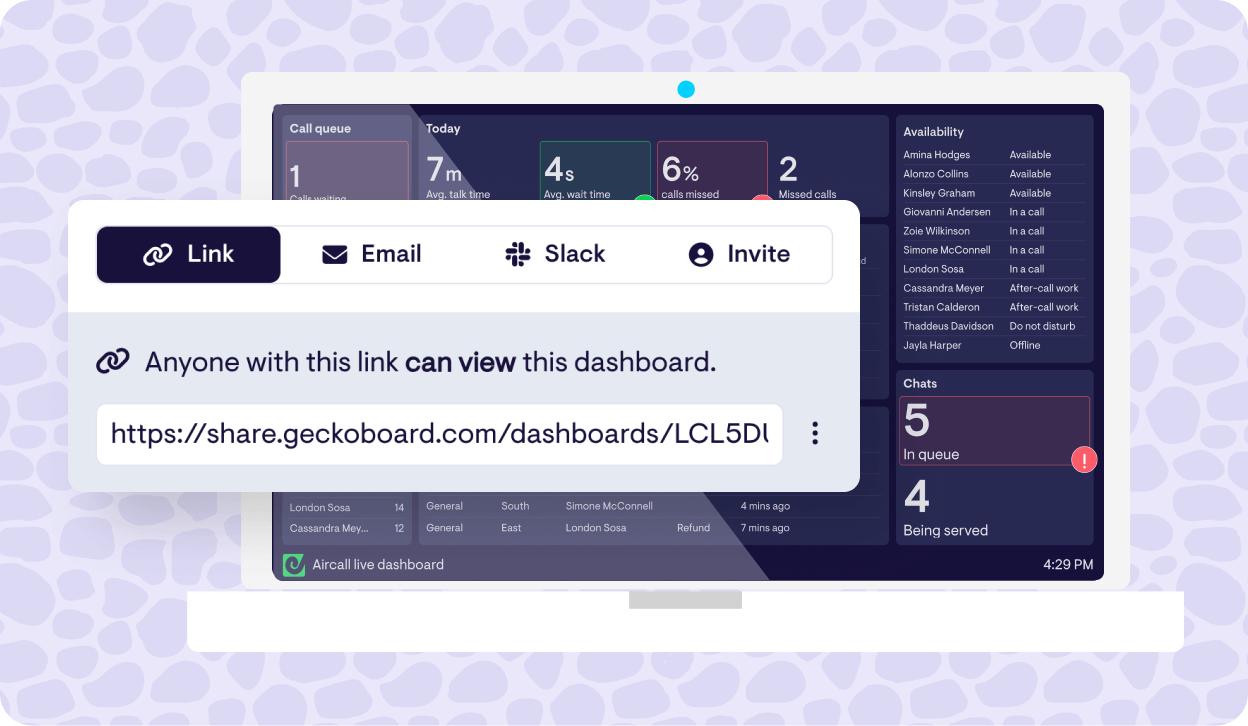
Share read-only Google Sheets dashboards
Give teammates, managers, clients or your organization access to up-to-date dashboards they can view (but not edit) in any browser.
-
Display KPIs on TVs & big screens
Easily display live Google Sheets metrics on TVs and large screens around your workspace. We’ve made it easy with simple, affordable hardware. Learn more.
-
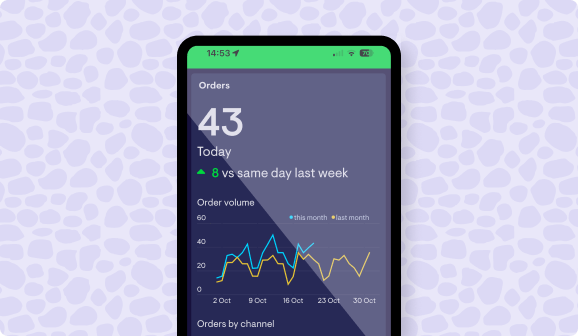
Access your dashboards on the go
Access mobile-friendly versions of dashboards in your Geckoboard account using a smartphone or tablet. Learn more.
-
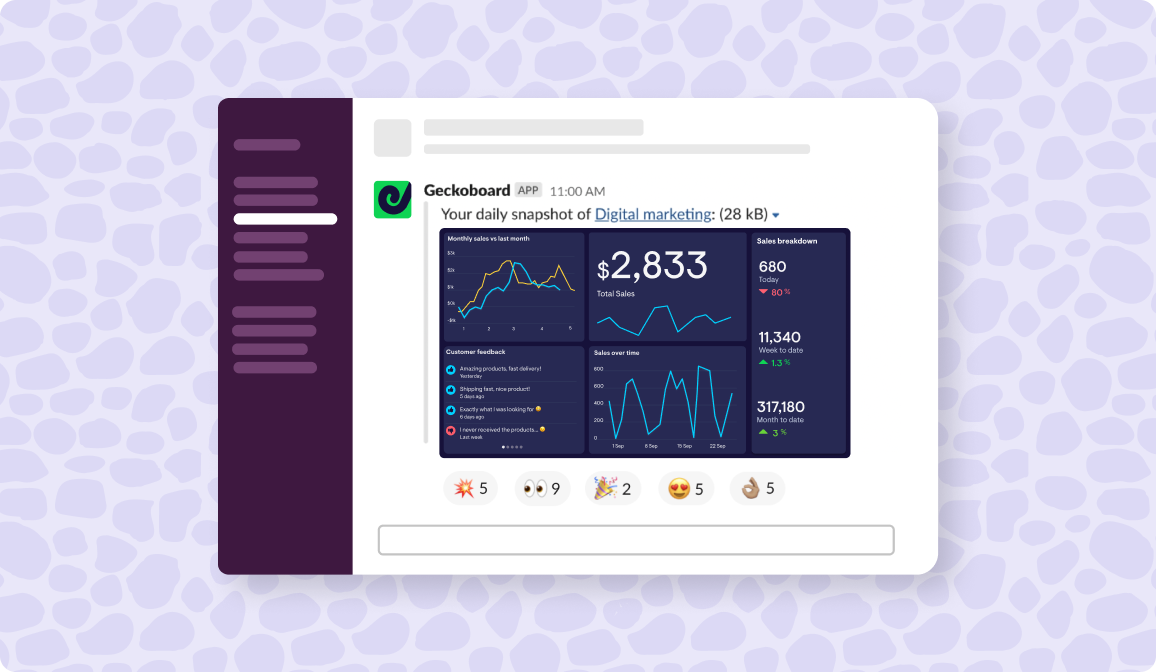
Automate Google Sheets reporting
Send snapshots of your dashboards to stakeholders or clients over email and Slack, automatically every day, week or month. Learn more.

90+ data sources
Easily add live data from over 90 other tools alongside Google Sheets data, including Google Analytics, Salesforce, Shopify and Zendesk.


Quick and easy dashboard creator
Whether you’re a business owner, marketing manager, or simply want easier access to your Google Sheets data, Geckoboard’s dashboard creator lets you create stunning dashboards from your data in a matter of minutes.
FAQ
What sort of dashboards can I create?
Geckoboard is ideal for creating an up-to-date view of metrics you, your team or stakeholders should be regularly monitoring, which can include data from several sources. Examples might include financial dashboards, project management dashboards, or dashboards for specific departments or teams. For inspiration, check out our dashboard examples.
How real-time is Geckoboard’s Google Sheets integration?
Google Sheets widgets update every 3 minutes. See this help article for refresh rates of all our other data sources.
Can I connect multiple Google Sheets?
Absolutely, you can add metrics from different Google Sheets and data sources to the same dashboard too.
What sort of support does Geckoboard offer?
Geckoboard is designed to be easy for anyone to use without any training or complicated setup. To help along the way, we’ve put together useful articles answering common questions, and for anything else, our friendly and knowledgeable team are on hand 24/5 to help you succeed with your dashboards, whatever time zone you’re in. Pro and Enterprise plans offer even snappier support, with priority support and dedicated support reps available.
How much does it cost?
You can try Geckoboard completely free for 14 days by signing up for a free trial - no payment details required. Plans then start from $60/month, with options for more dashboards, users and TVs on your account. View our pricing here.