Excel dashboard examples
Bring your Excel data to life. Connect your spreadsheets to Geckoboard and display live KPIs on a dashboard your whole team can see.
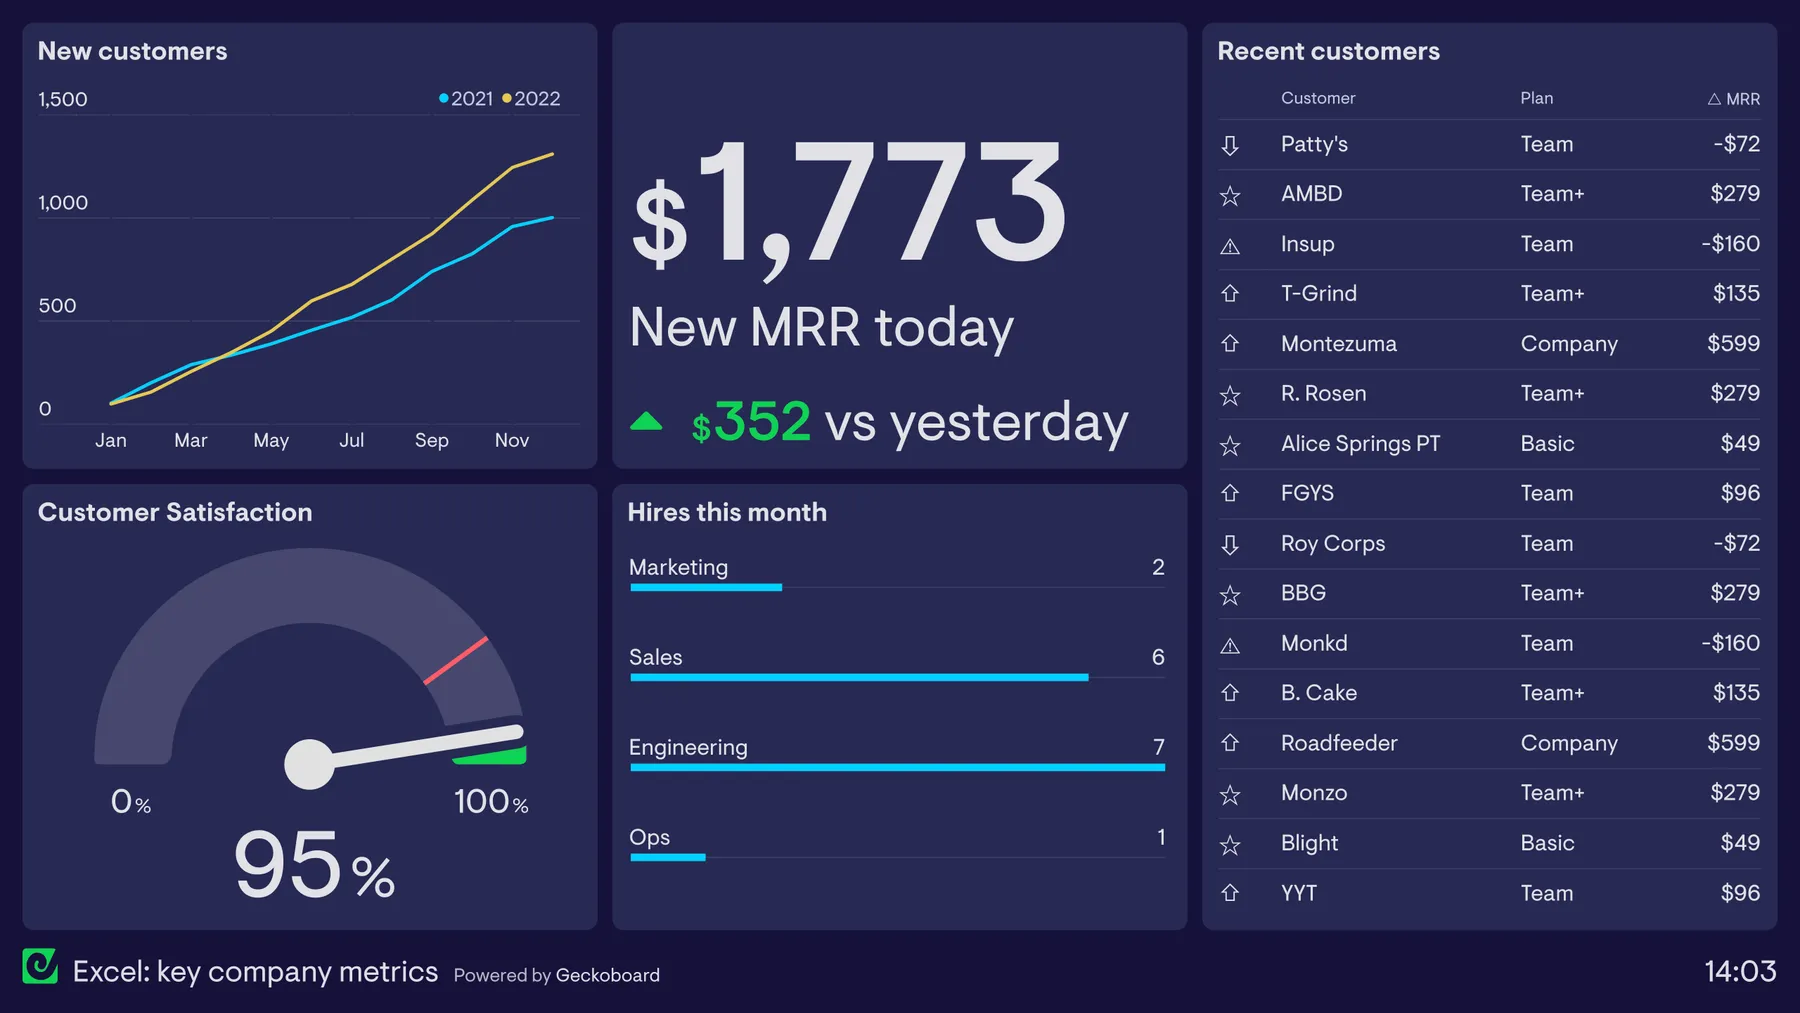
Company KPI dashboard
Excel dashboards enable users to visualize their most important Excel data so KPIs can be viewed by everyone, at a glance. Spreadsheets are a popular way of sharing key metrics with team members and stakeholders, but using them to communicate fast-moving metrics has several drawbacks: readers may not know which numbers are most important, the design is often uninspiring, and by the time people look at the spreadsheet the information may be out of date.
A wall-mounted Excel dashboard makes important spreadsheet metrics easy for teams to access and understand. And because the dashboard is live, it ensures that important information is seen before it’s out of date.
This dashboard visualizes high-level company KPIs from a small SaaS company. All the raw data comes from a single Excel file uploaded to Dropbox. Any saved changes to the Excel file are synced with the dashboard automatically, ensuring only up-to-date information is displayed to the team. As a result, everyone in the company has a real-time view of company performance — including clear progress towards goals (new customers and new MRR) and important health metrics like Customer Satisfaction (CSAT).
Sales dashboard from Excel
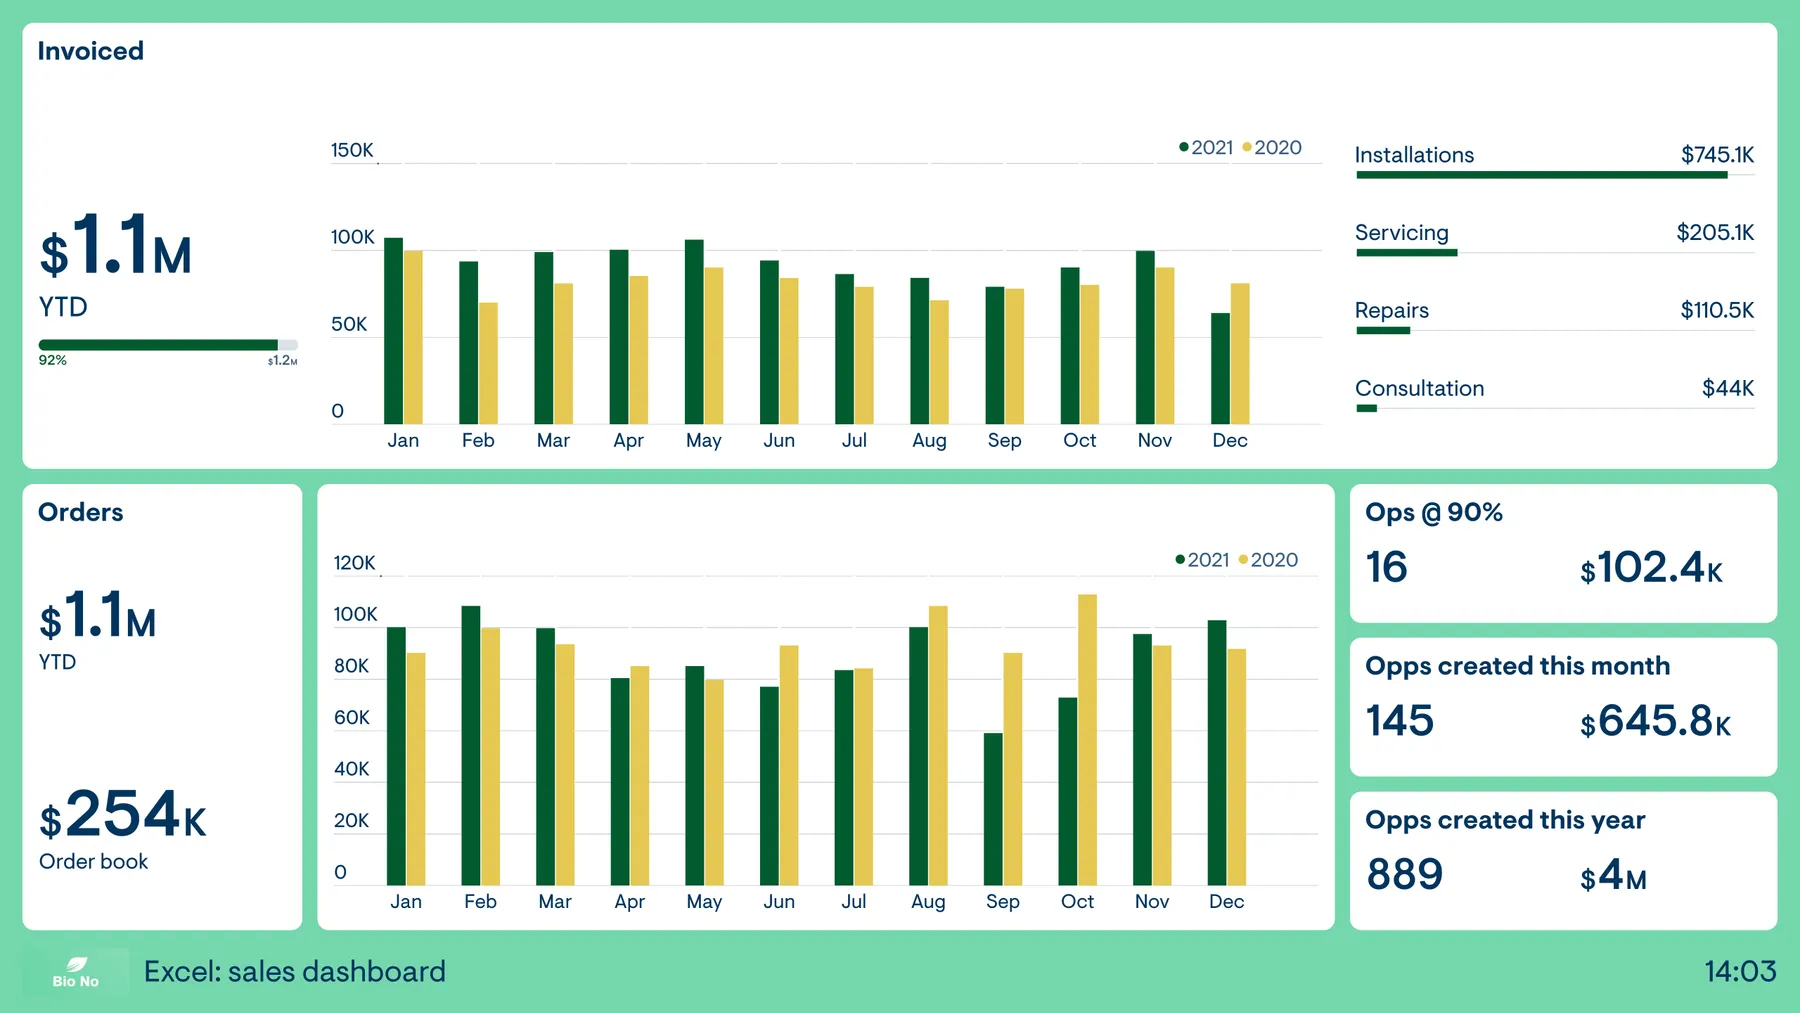
This dashboard focuses on sales KPIs across the financial year. The Sales team needs to stay aware of metrics related to both orders and invoices, as they’re responsible for generating new orders as well as seeing that invoices are paid when the work is completed. The dashboard also shows metrics related to sales activity higher up the funnel, in the form of new opportunities and opportunities at 90% — those which are expected to convert very soon. Like all the examples on this page, the data is generated in real-time from a single Excel file.
Finance dashboard from Excel
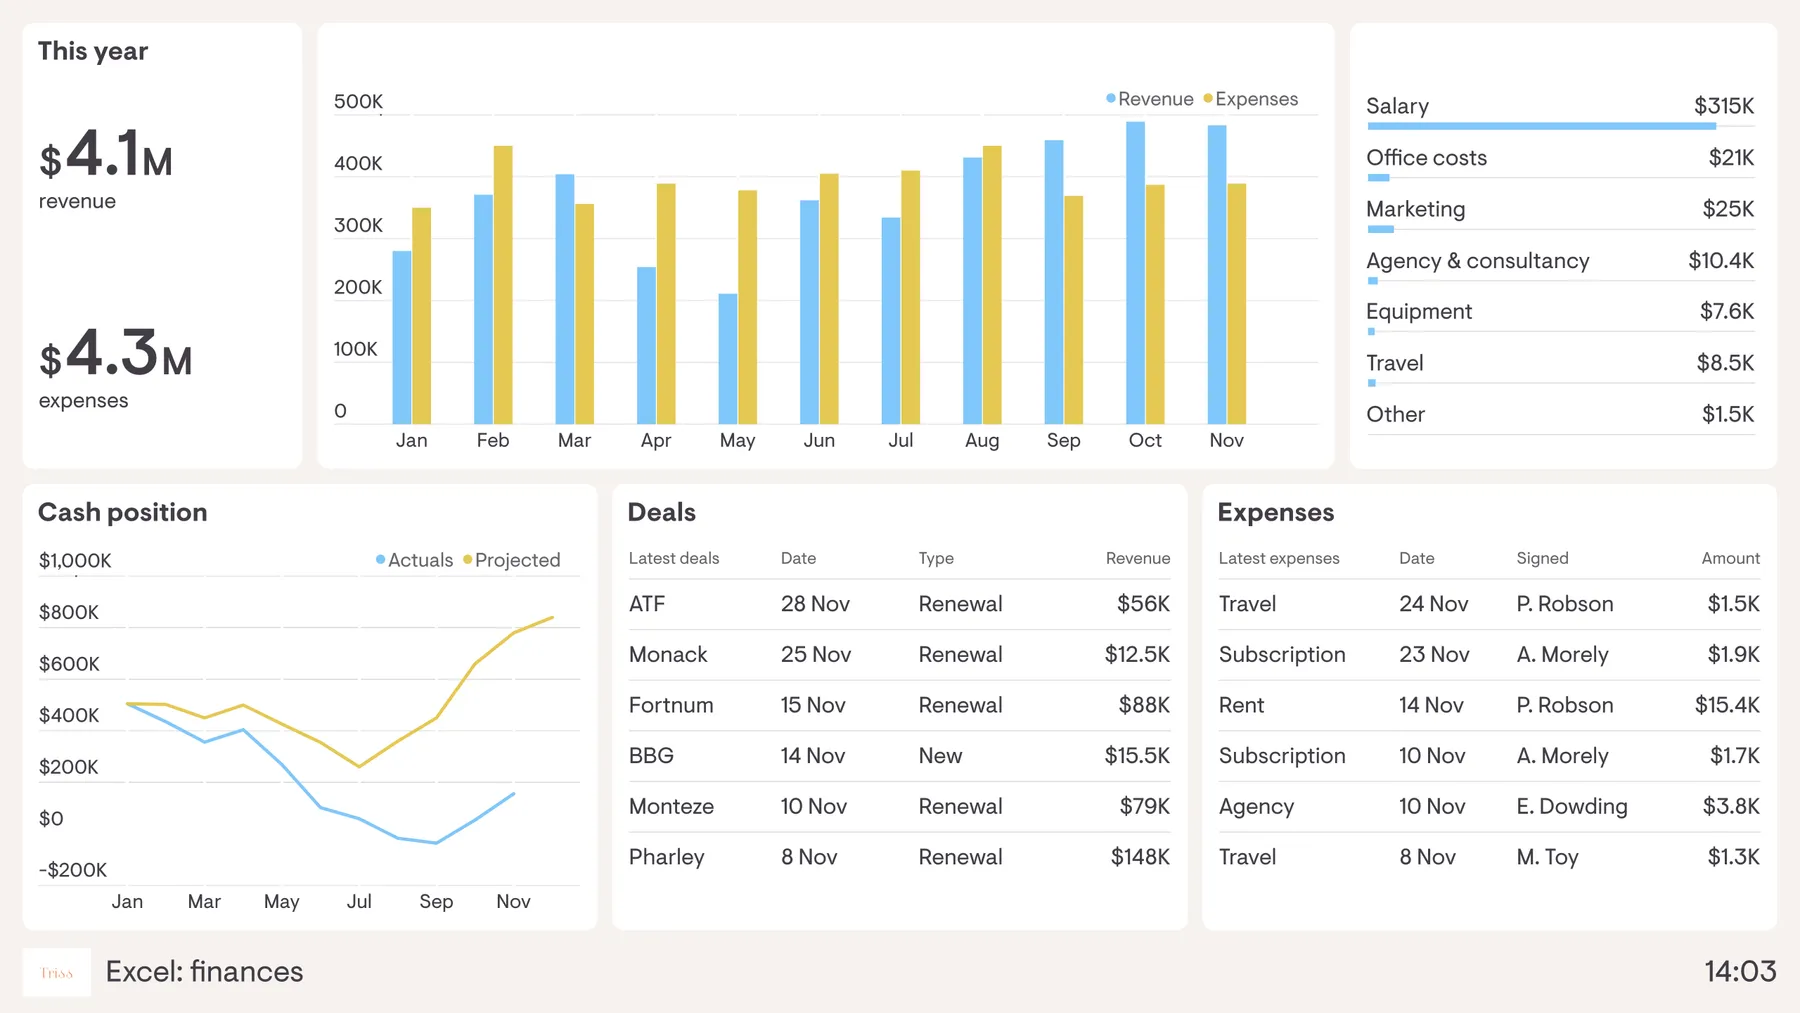
This dashboard visualizes company finances so everyone in the business can stay up to date on the financial health of the organization. It tracks revenue, expenditure and the overall cash position of the company. The benefit of visualizing financial KPIs like this is that everyone has a clear understanding of the company’s financial projections. This means the Finance Director or CEO can spend less time explaining the basics of financial performance and more time explaining goals, priorities and overall company direction.