Bring all your key data into one dashboard
Geckoboard connects your whole stack into one live business dashboard that stays current automatically, so your team has a single place to understand what’s happening across the business.
Native reports are powerful, but your team needs the whole picture
Every platform your team depends on has reporting built in. HubSpot shows you deals. Zendesk shows you tickets. Aircall shows you call volume. But none of them are built to show data from anywhere else, so you’re left to juggle browser tabs or share screenshots.
Build multi-source dashboards yourself in minutes
Data consolidation used to mean pipelines, SQL queries, weeks of engineering, and ongoing maintenance. Geckoboard removes all of that. Non-technical managers connect their own sources, build their own dashboards, and share them with anyone across the business — without a single request to a data team.
No BI team required
- Deep integrations with Salesforce, HubSpot, Zendesk, Aircall and 90+ more. Effortless to use, no code required.
- Dashboards stay in sync automatically. No one needs to maintain or refresh them.
- Leaders with no technical background can build and adapt their own views without help.
- Share the same data with agents, managers, and executives in formats that work for each of them.
Different tools, different teams — one connected dashboard.
Whatever combination of platforms your business runs on, Geckoboard brings the data together.
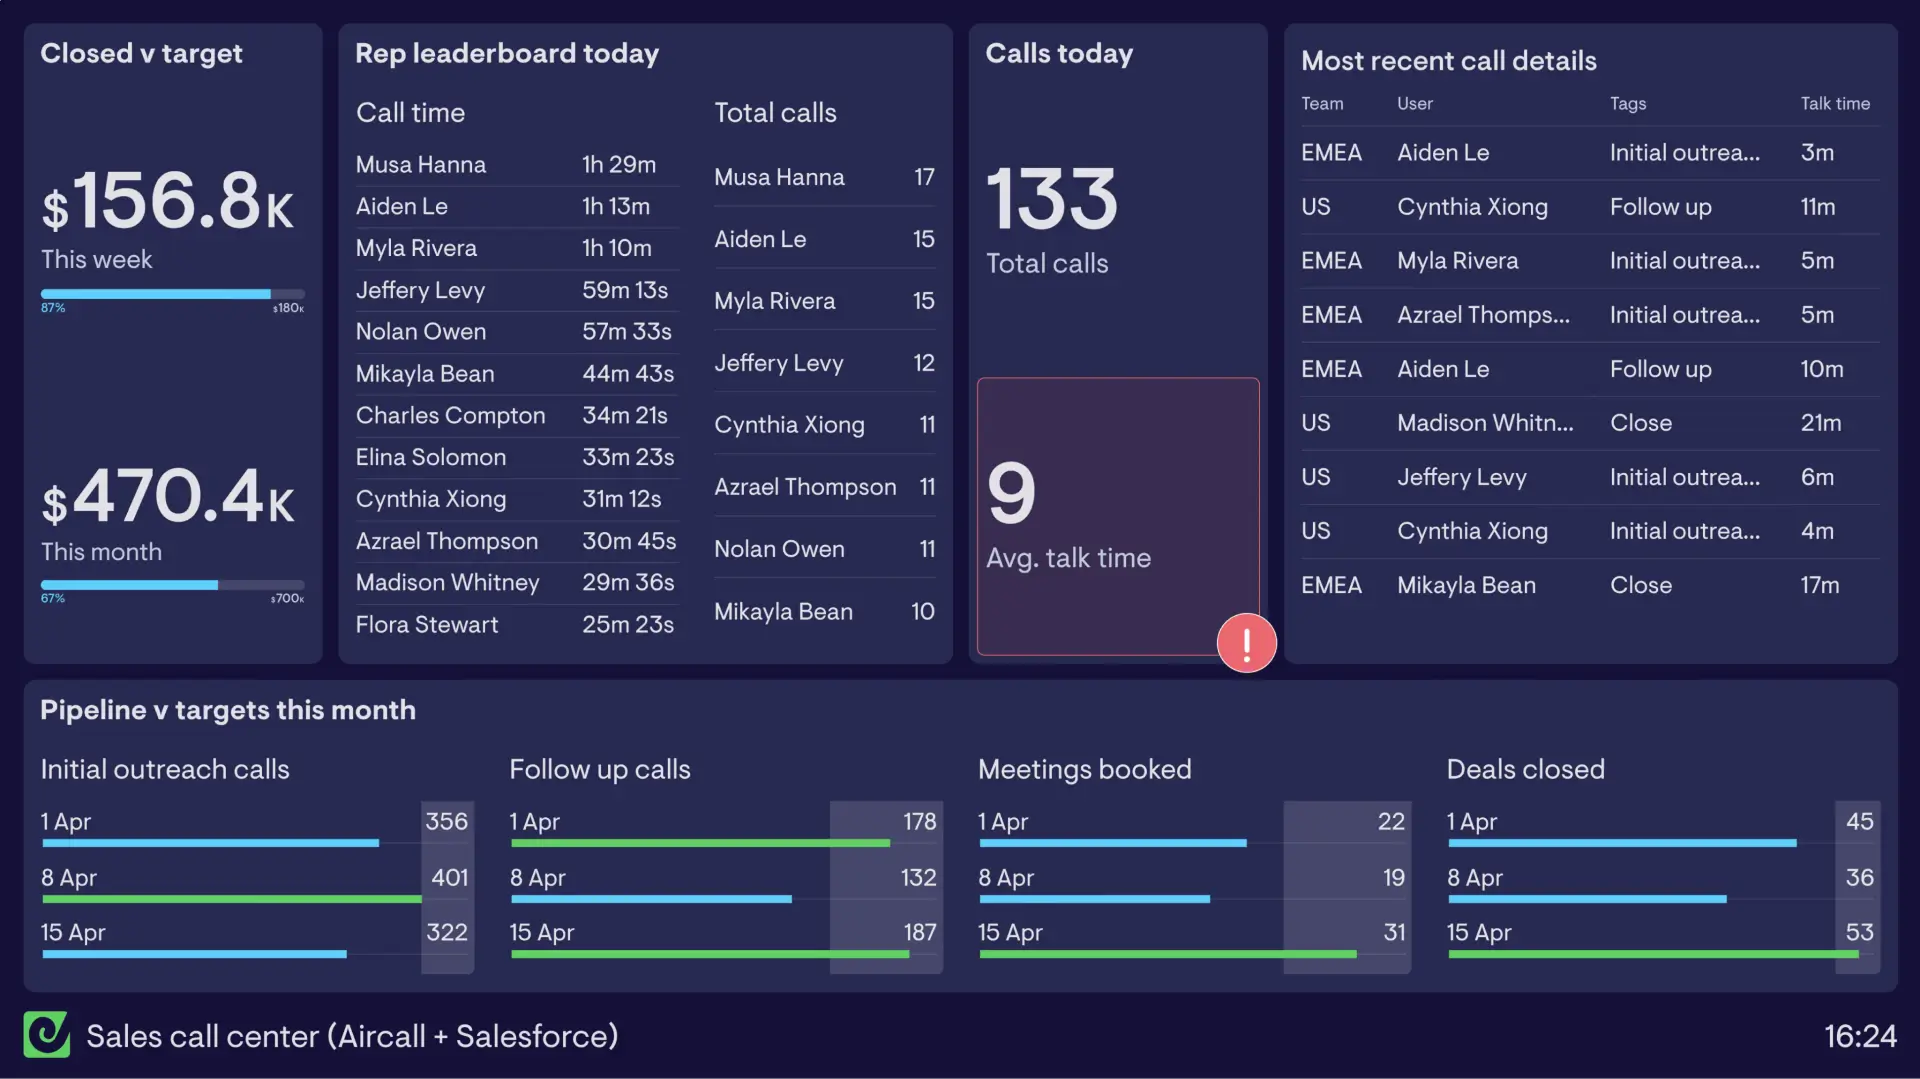
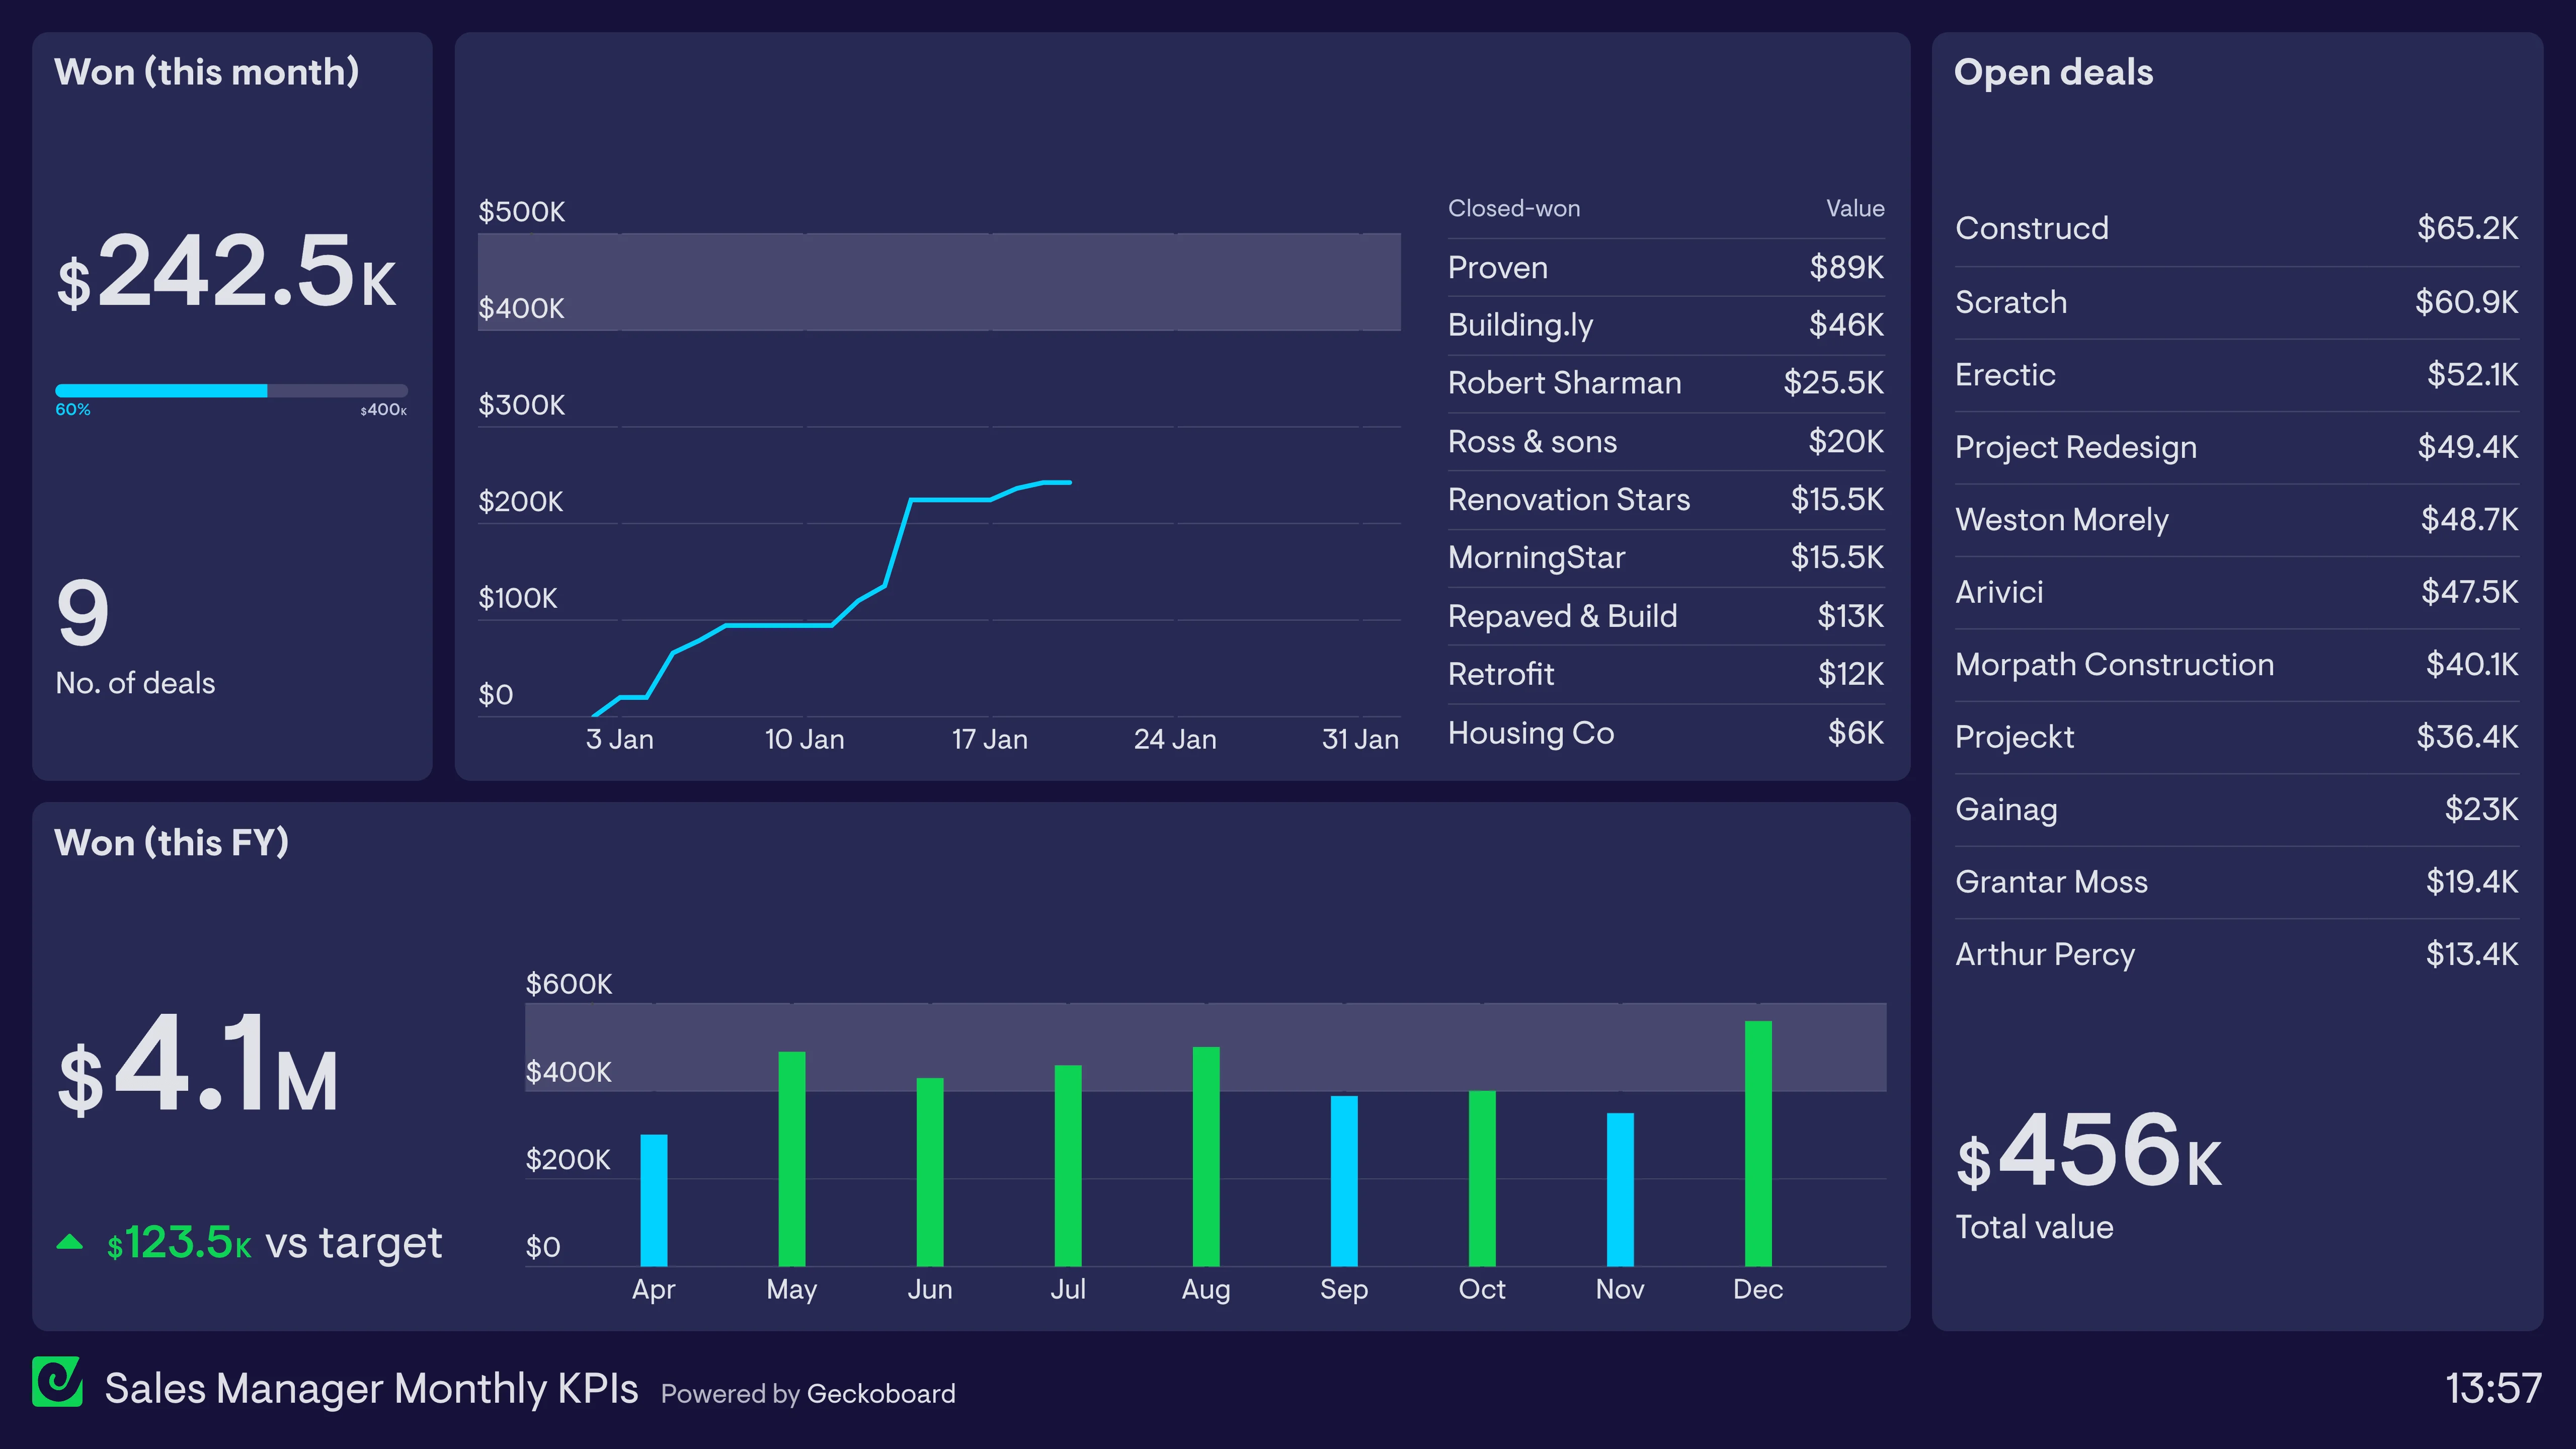
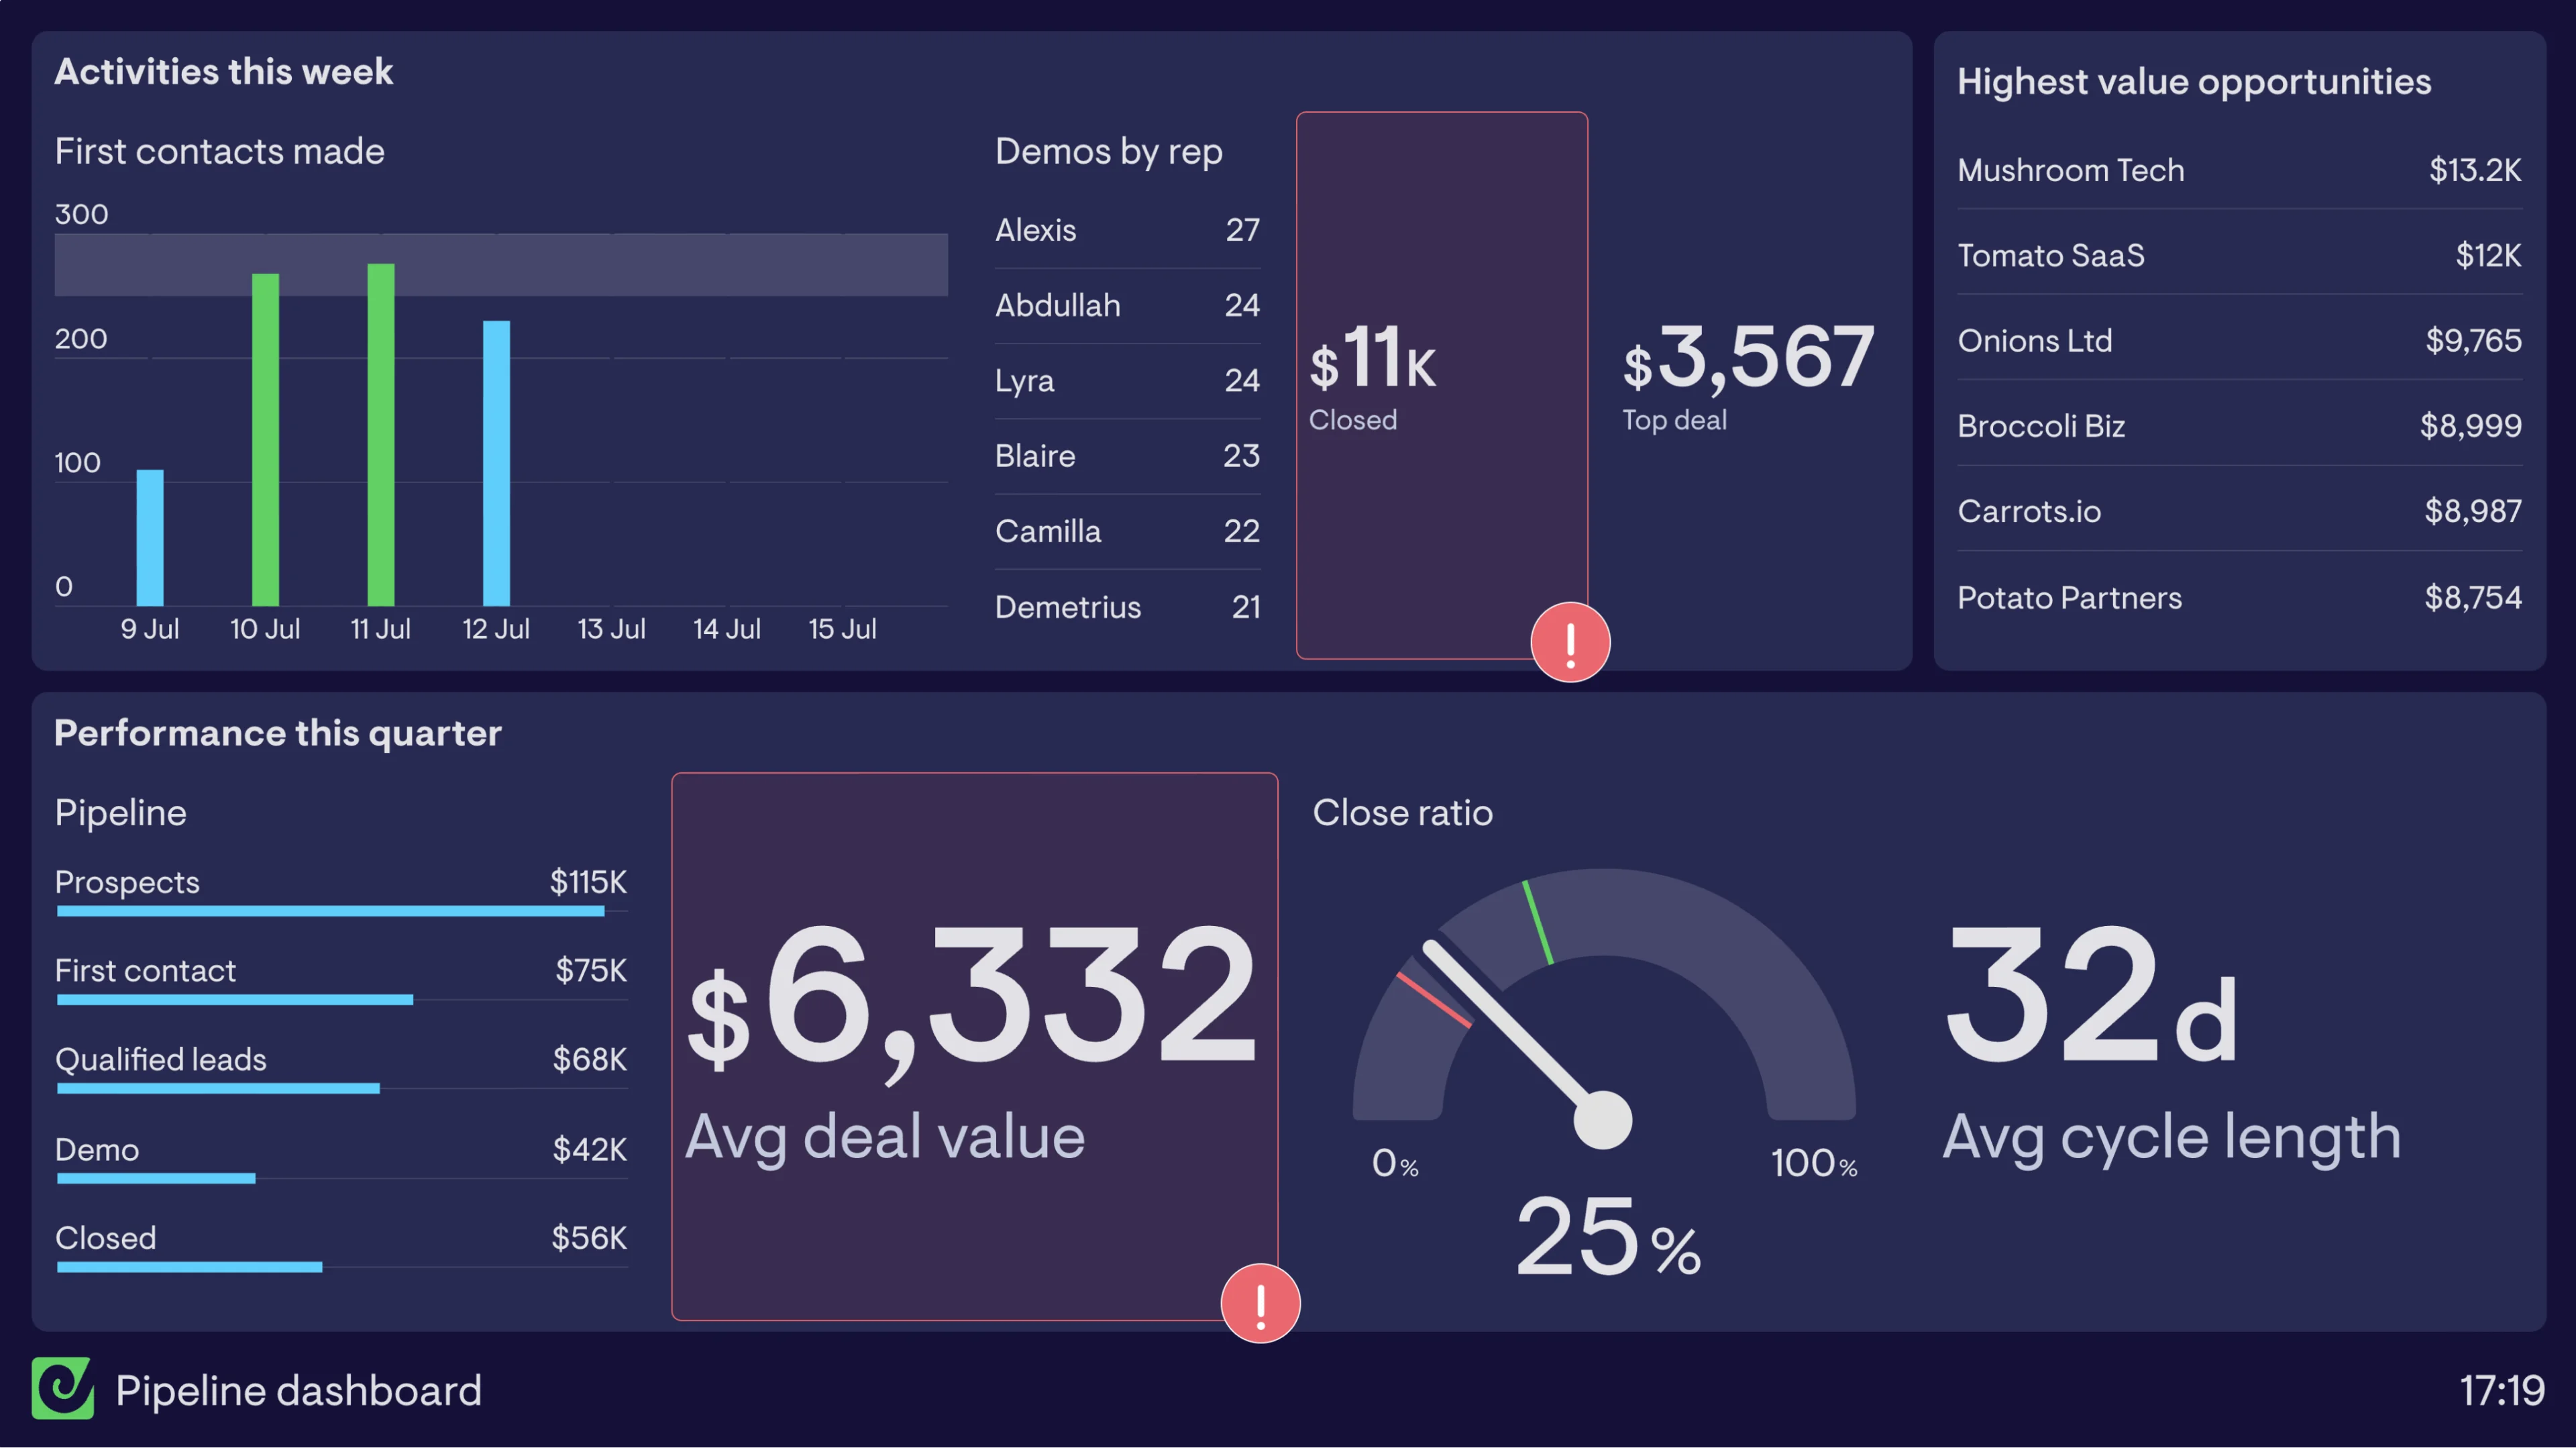
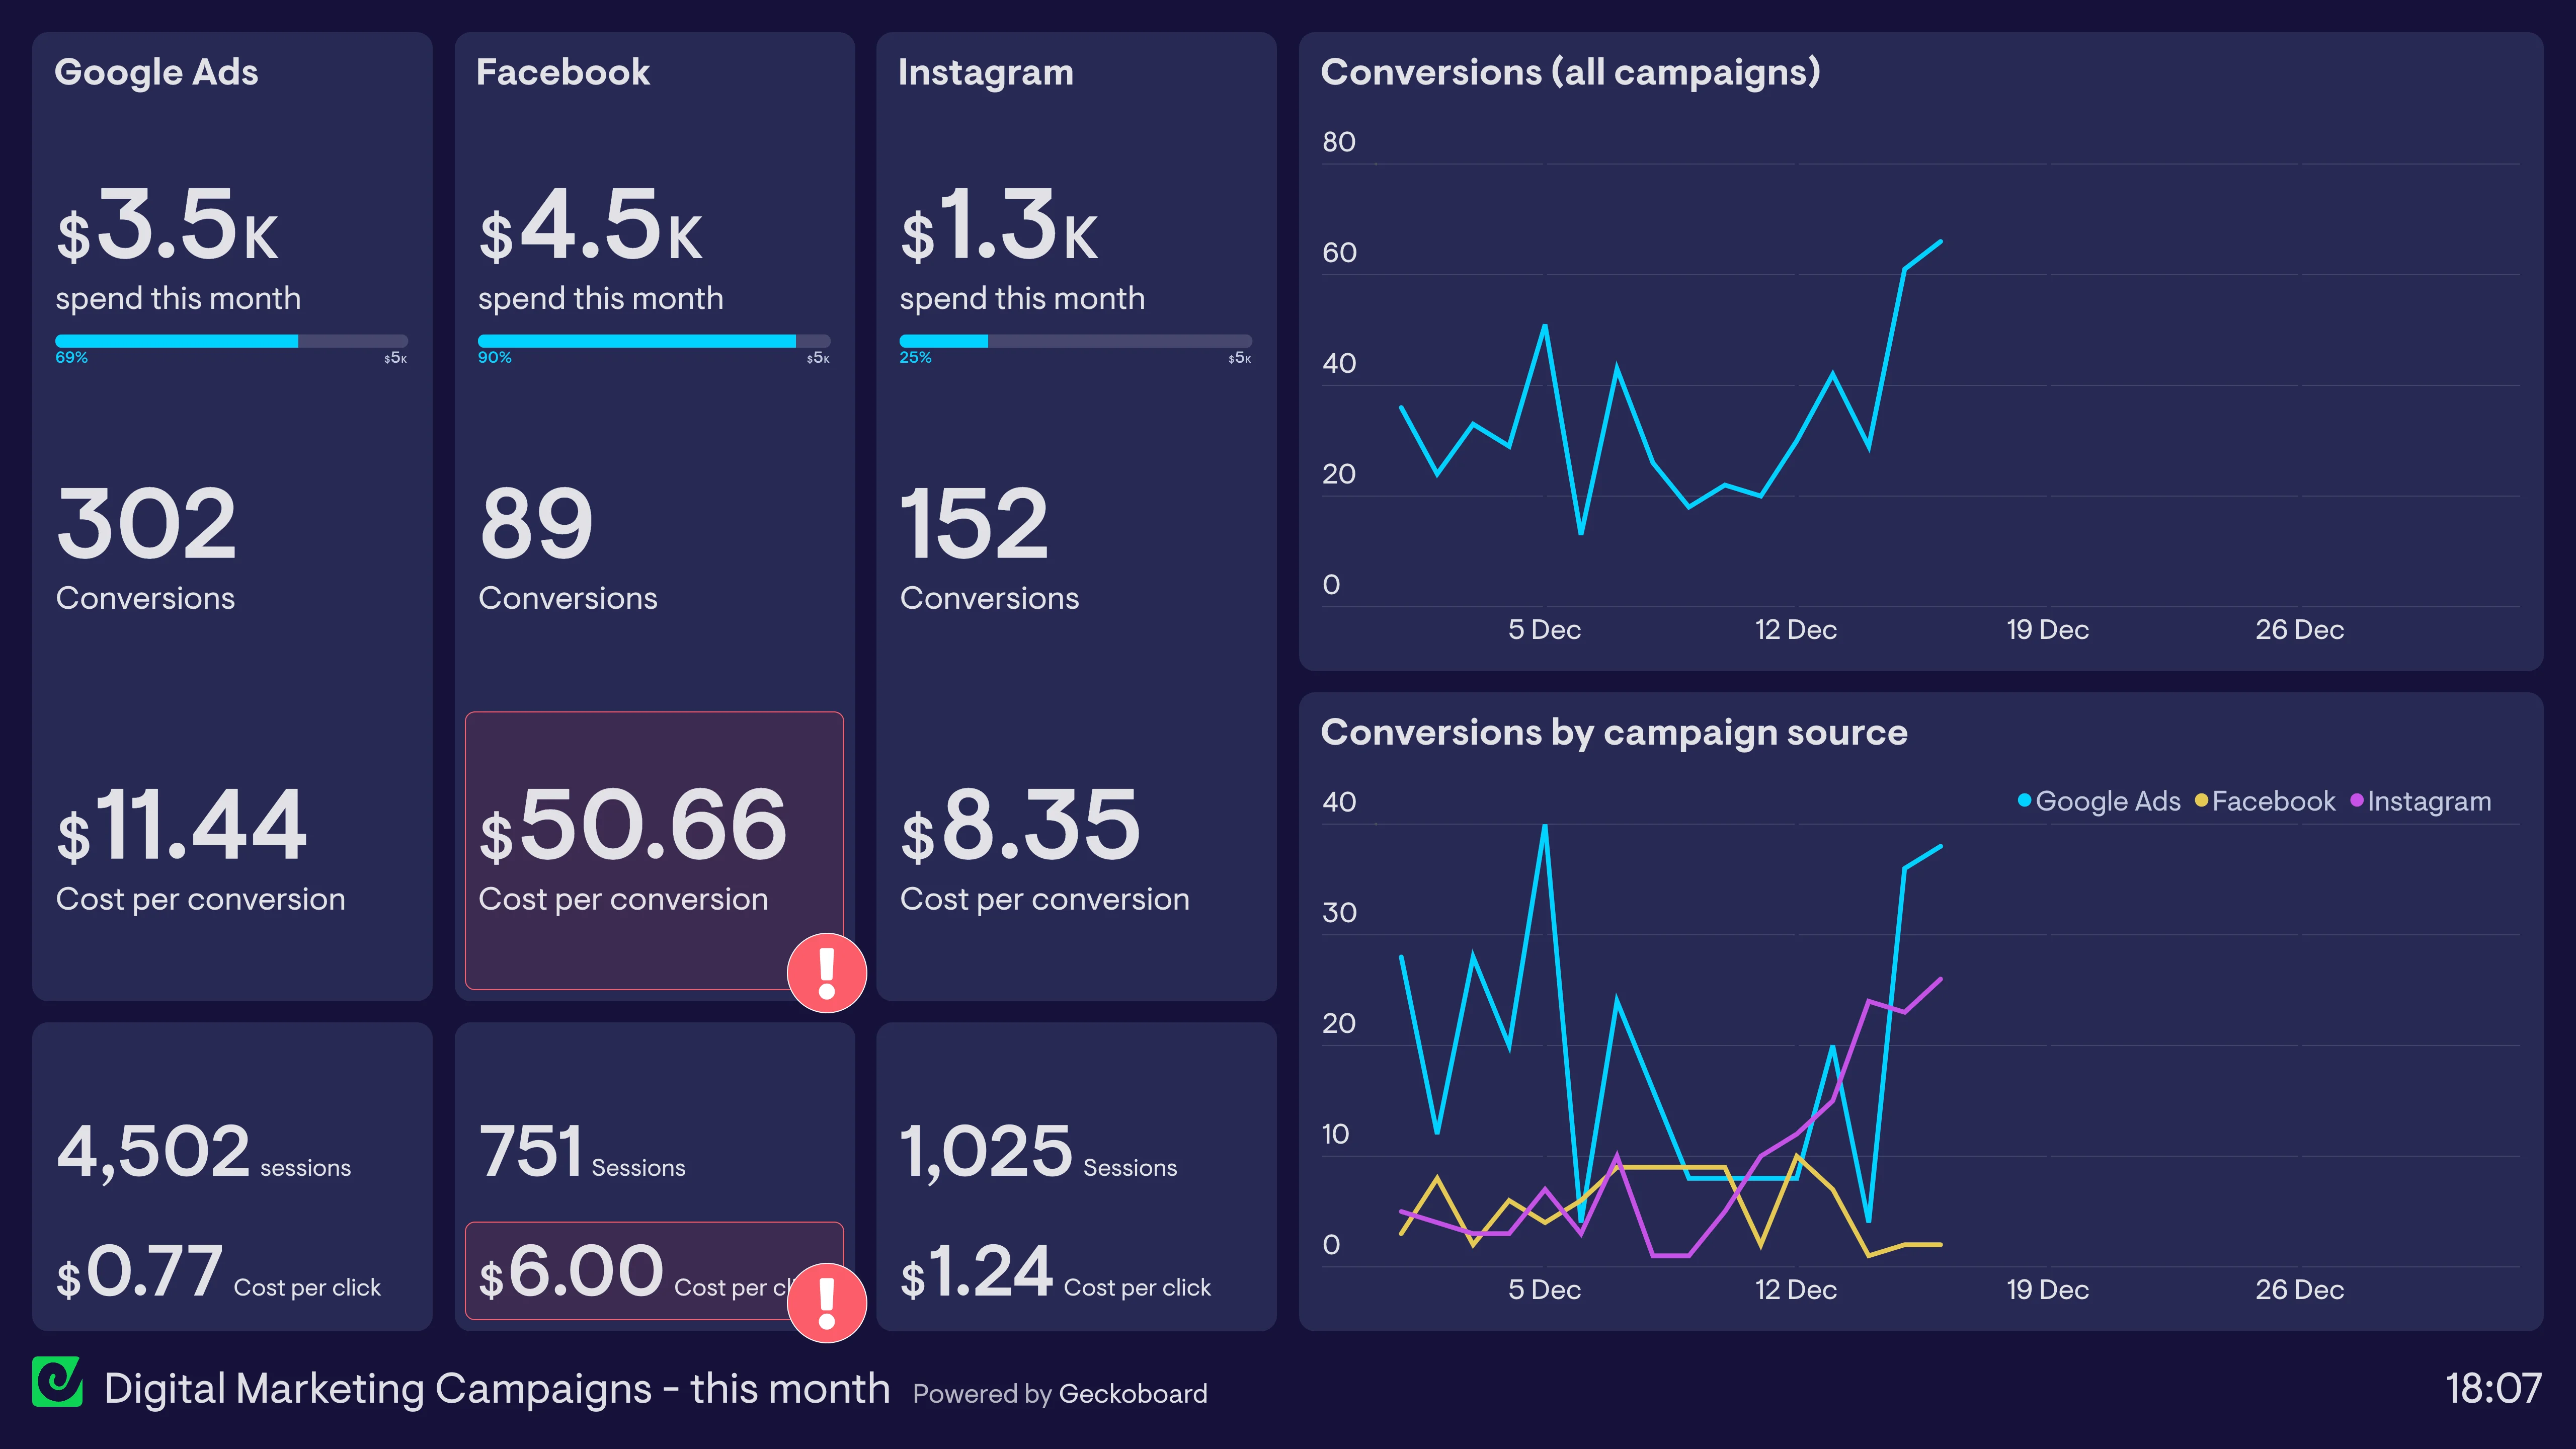
Salesforce + Aircall, side by side.
- Sales leaders see pipeline activity and real-time call performance in one view.
- No more switching between reports to understand what’s driving the day.
- Set a goal, track it live, and keep the team focused on what moves the number.
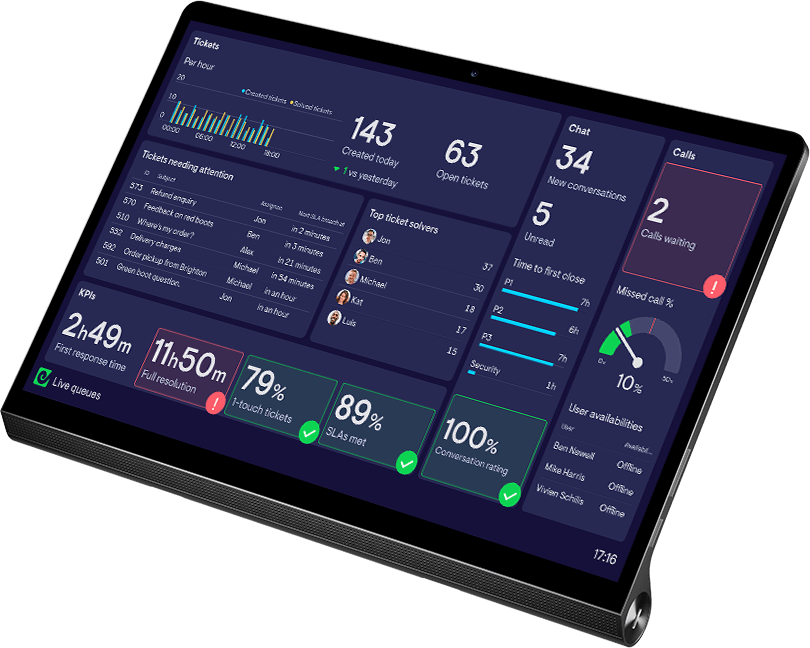
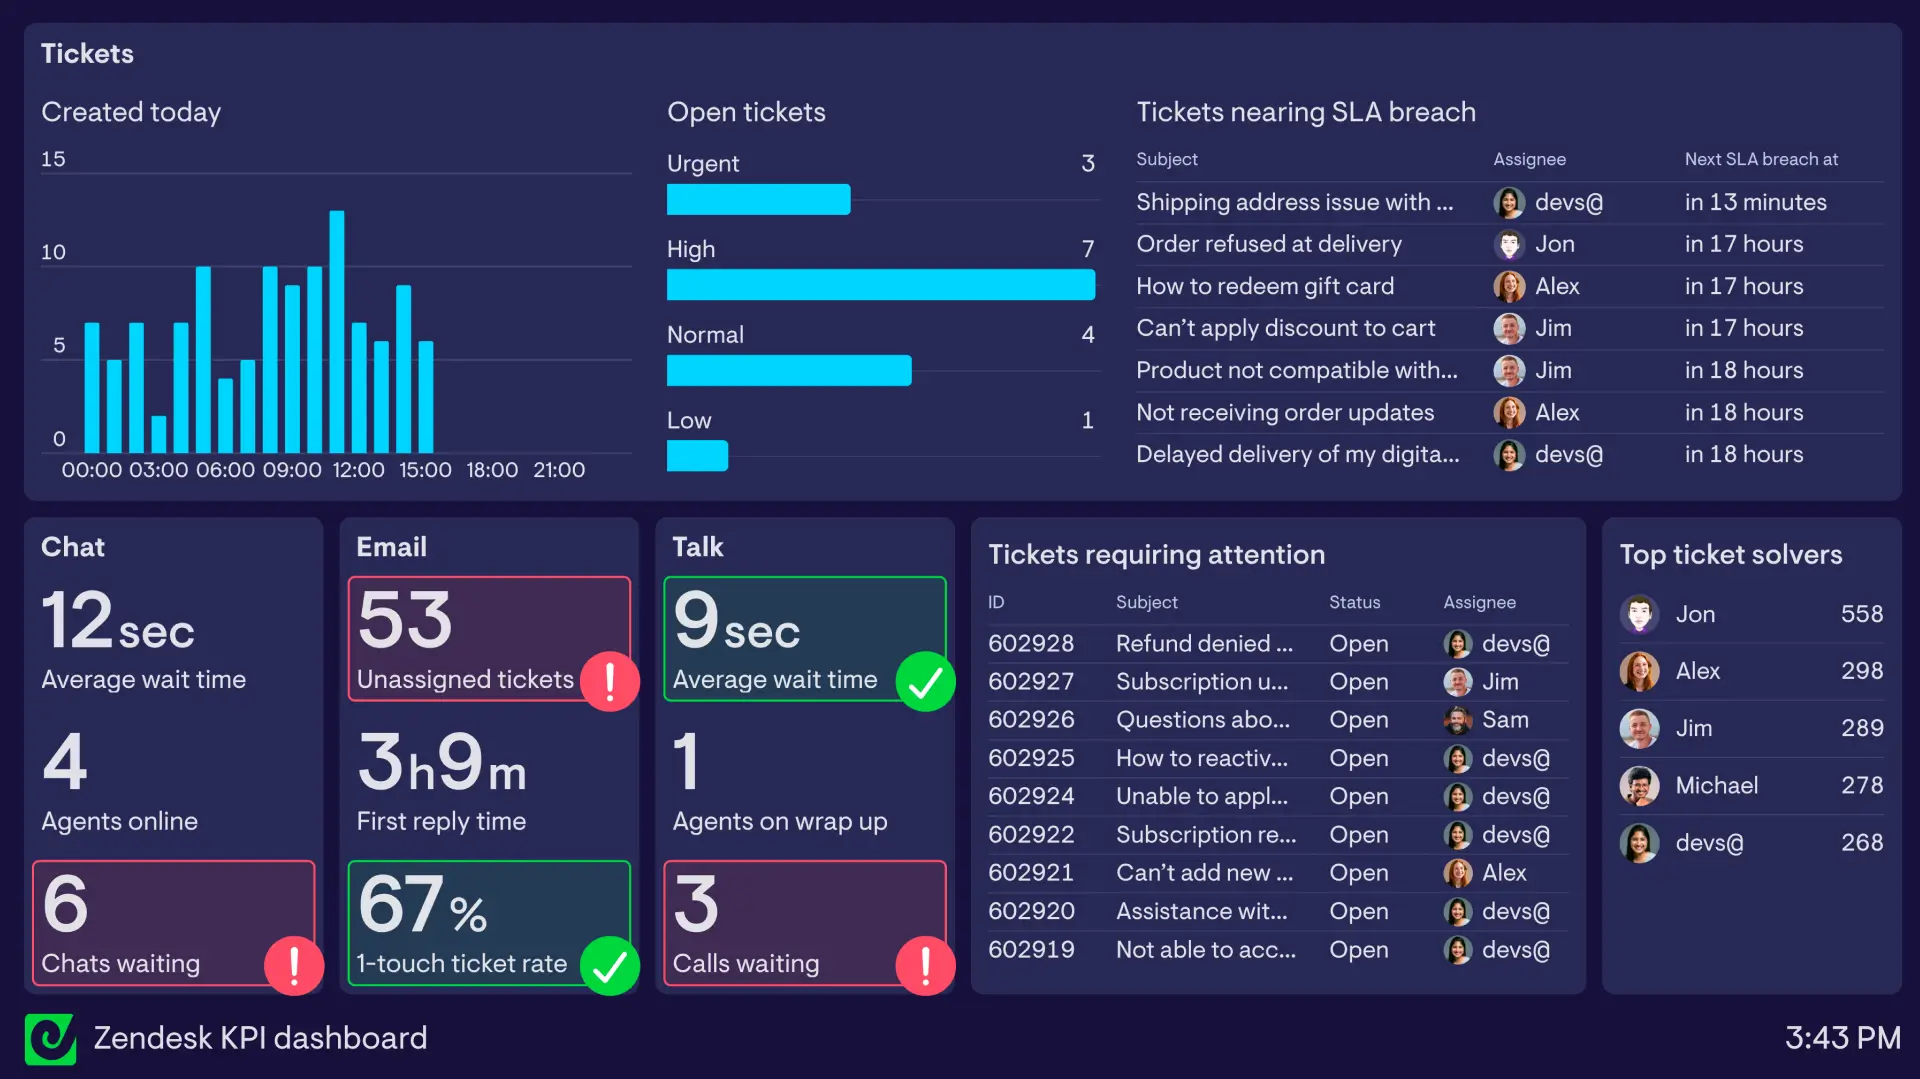
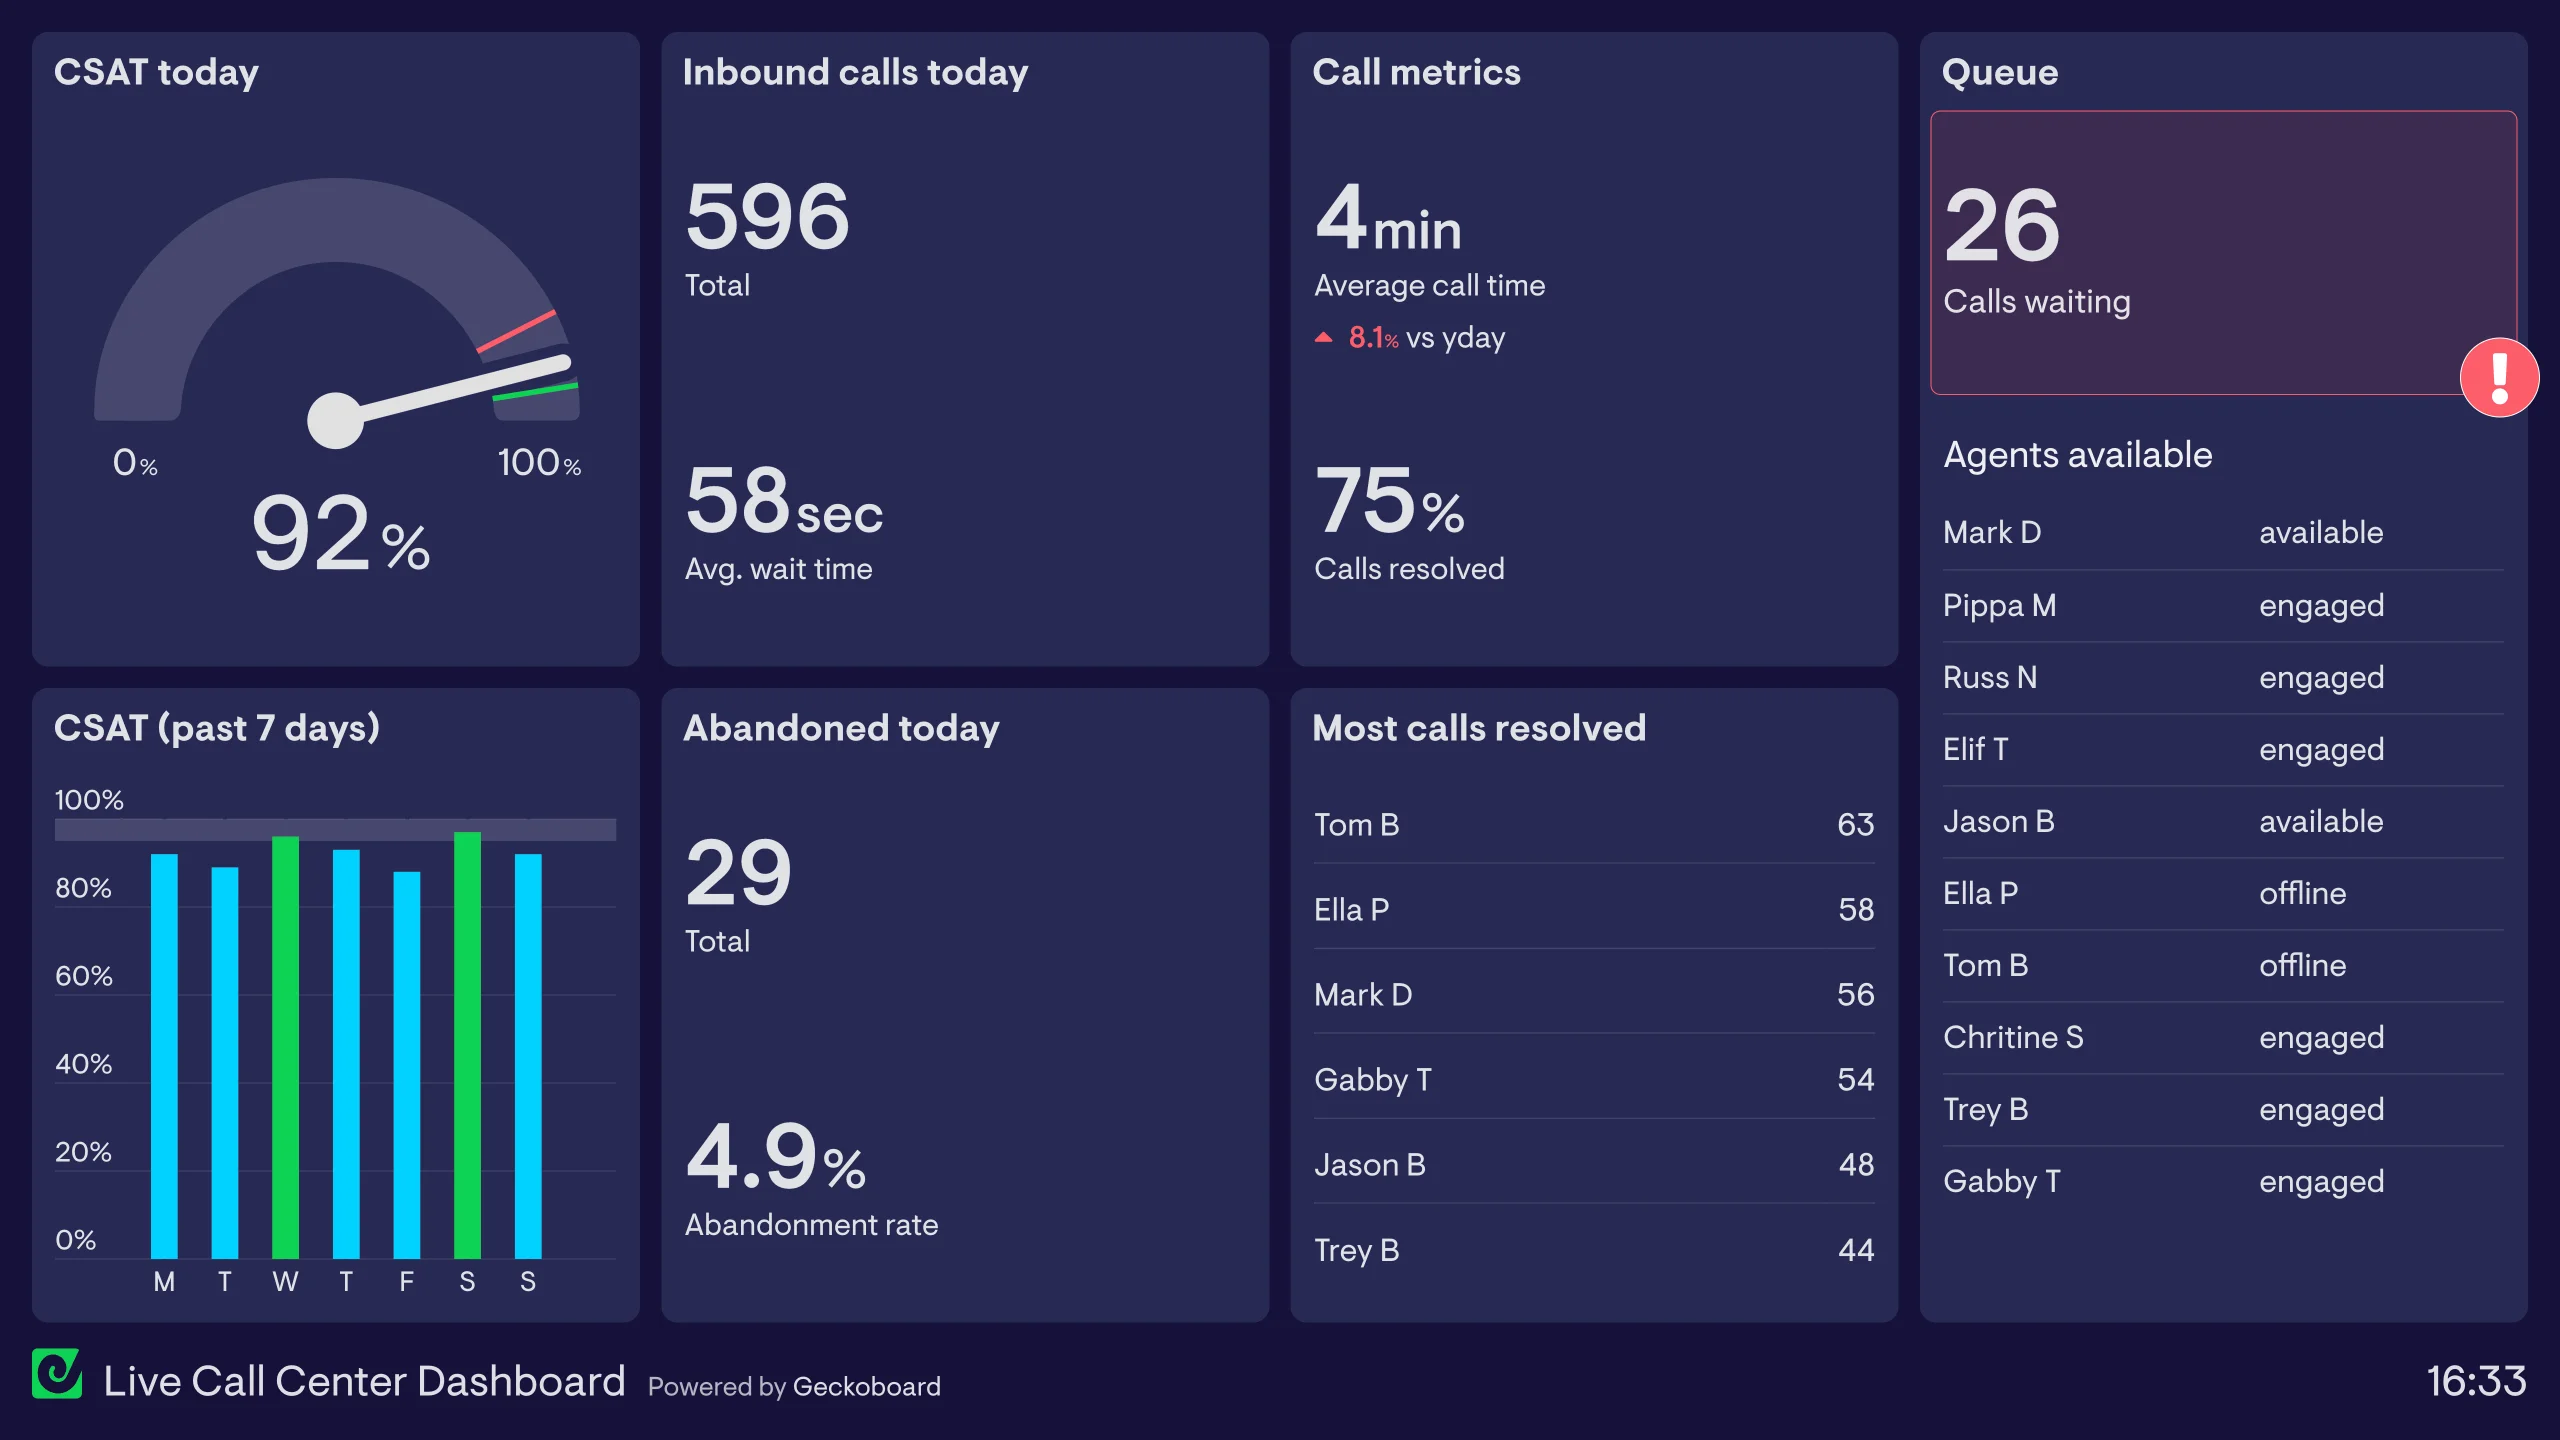
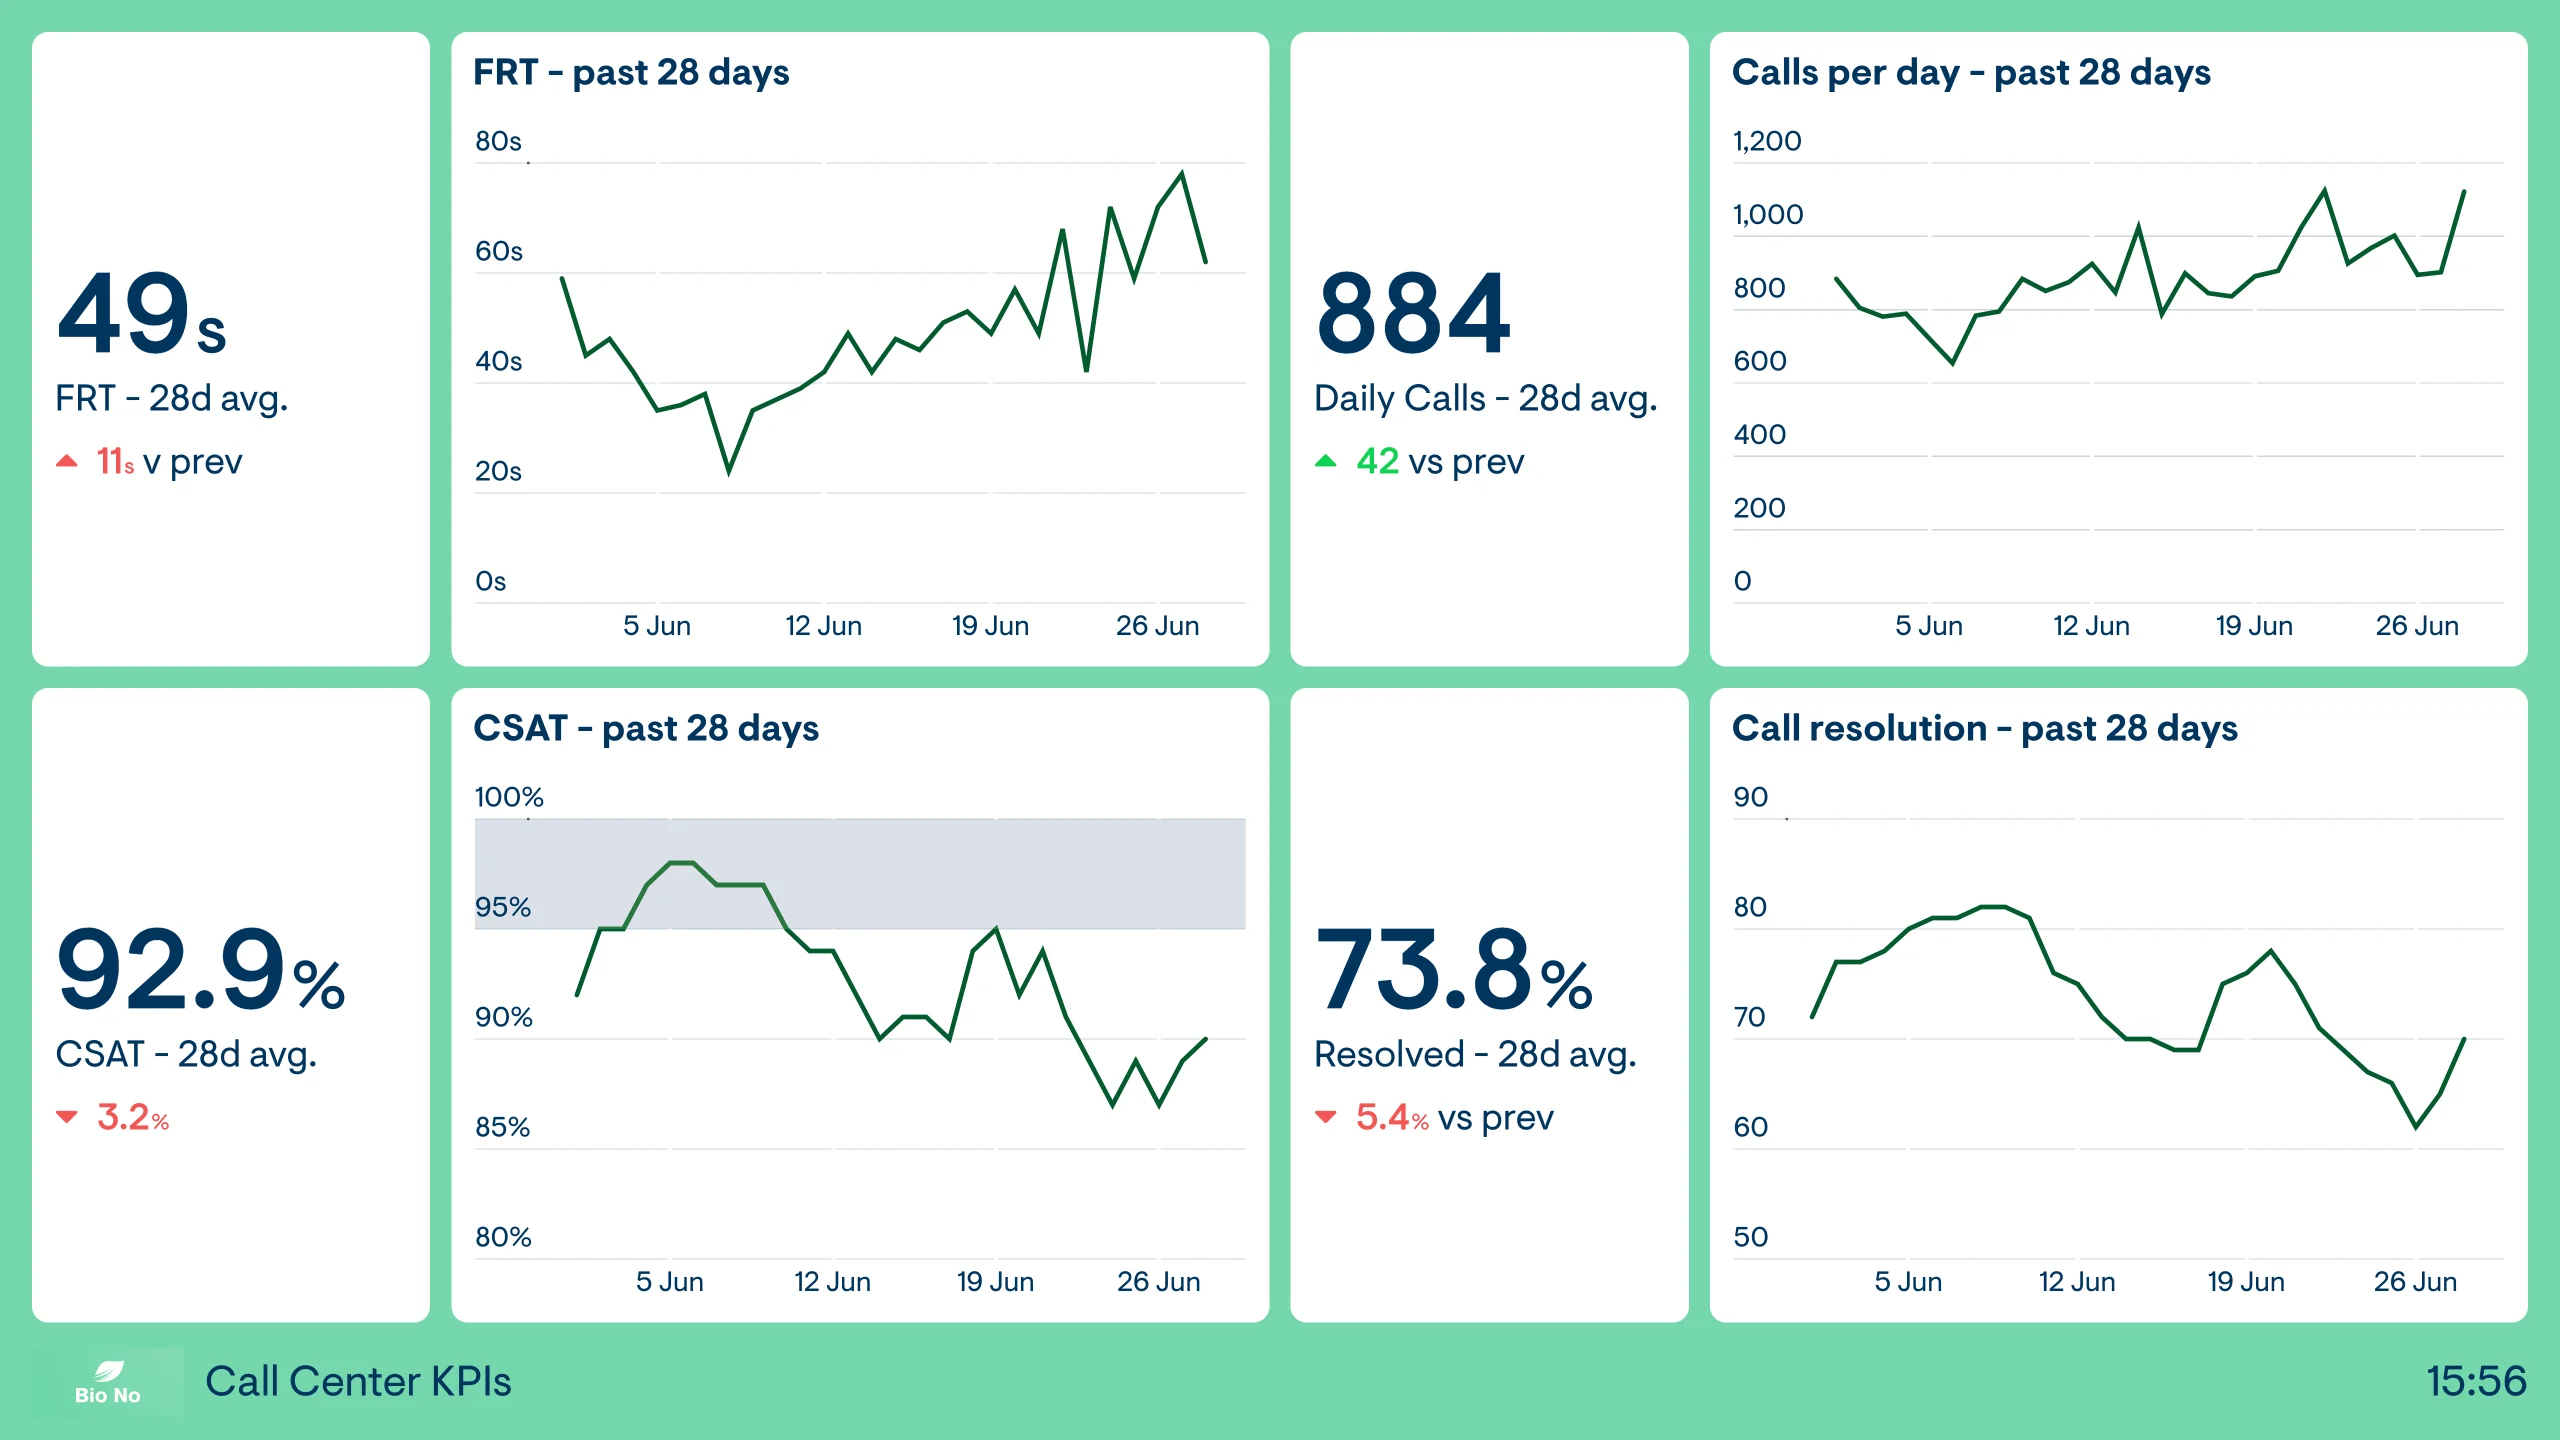
All your support channels in one view.
- Tickets, chats, call data, agent availability and data from other tools, all in one shareable view.
- Shift leads see where queue pressure is starting to build without needing to dig into different views.
- Agents can self-organize across different channels based on workload.
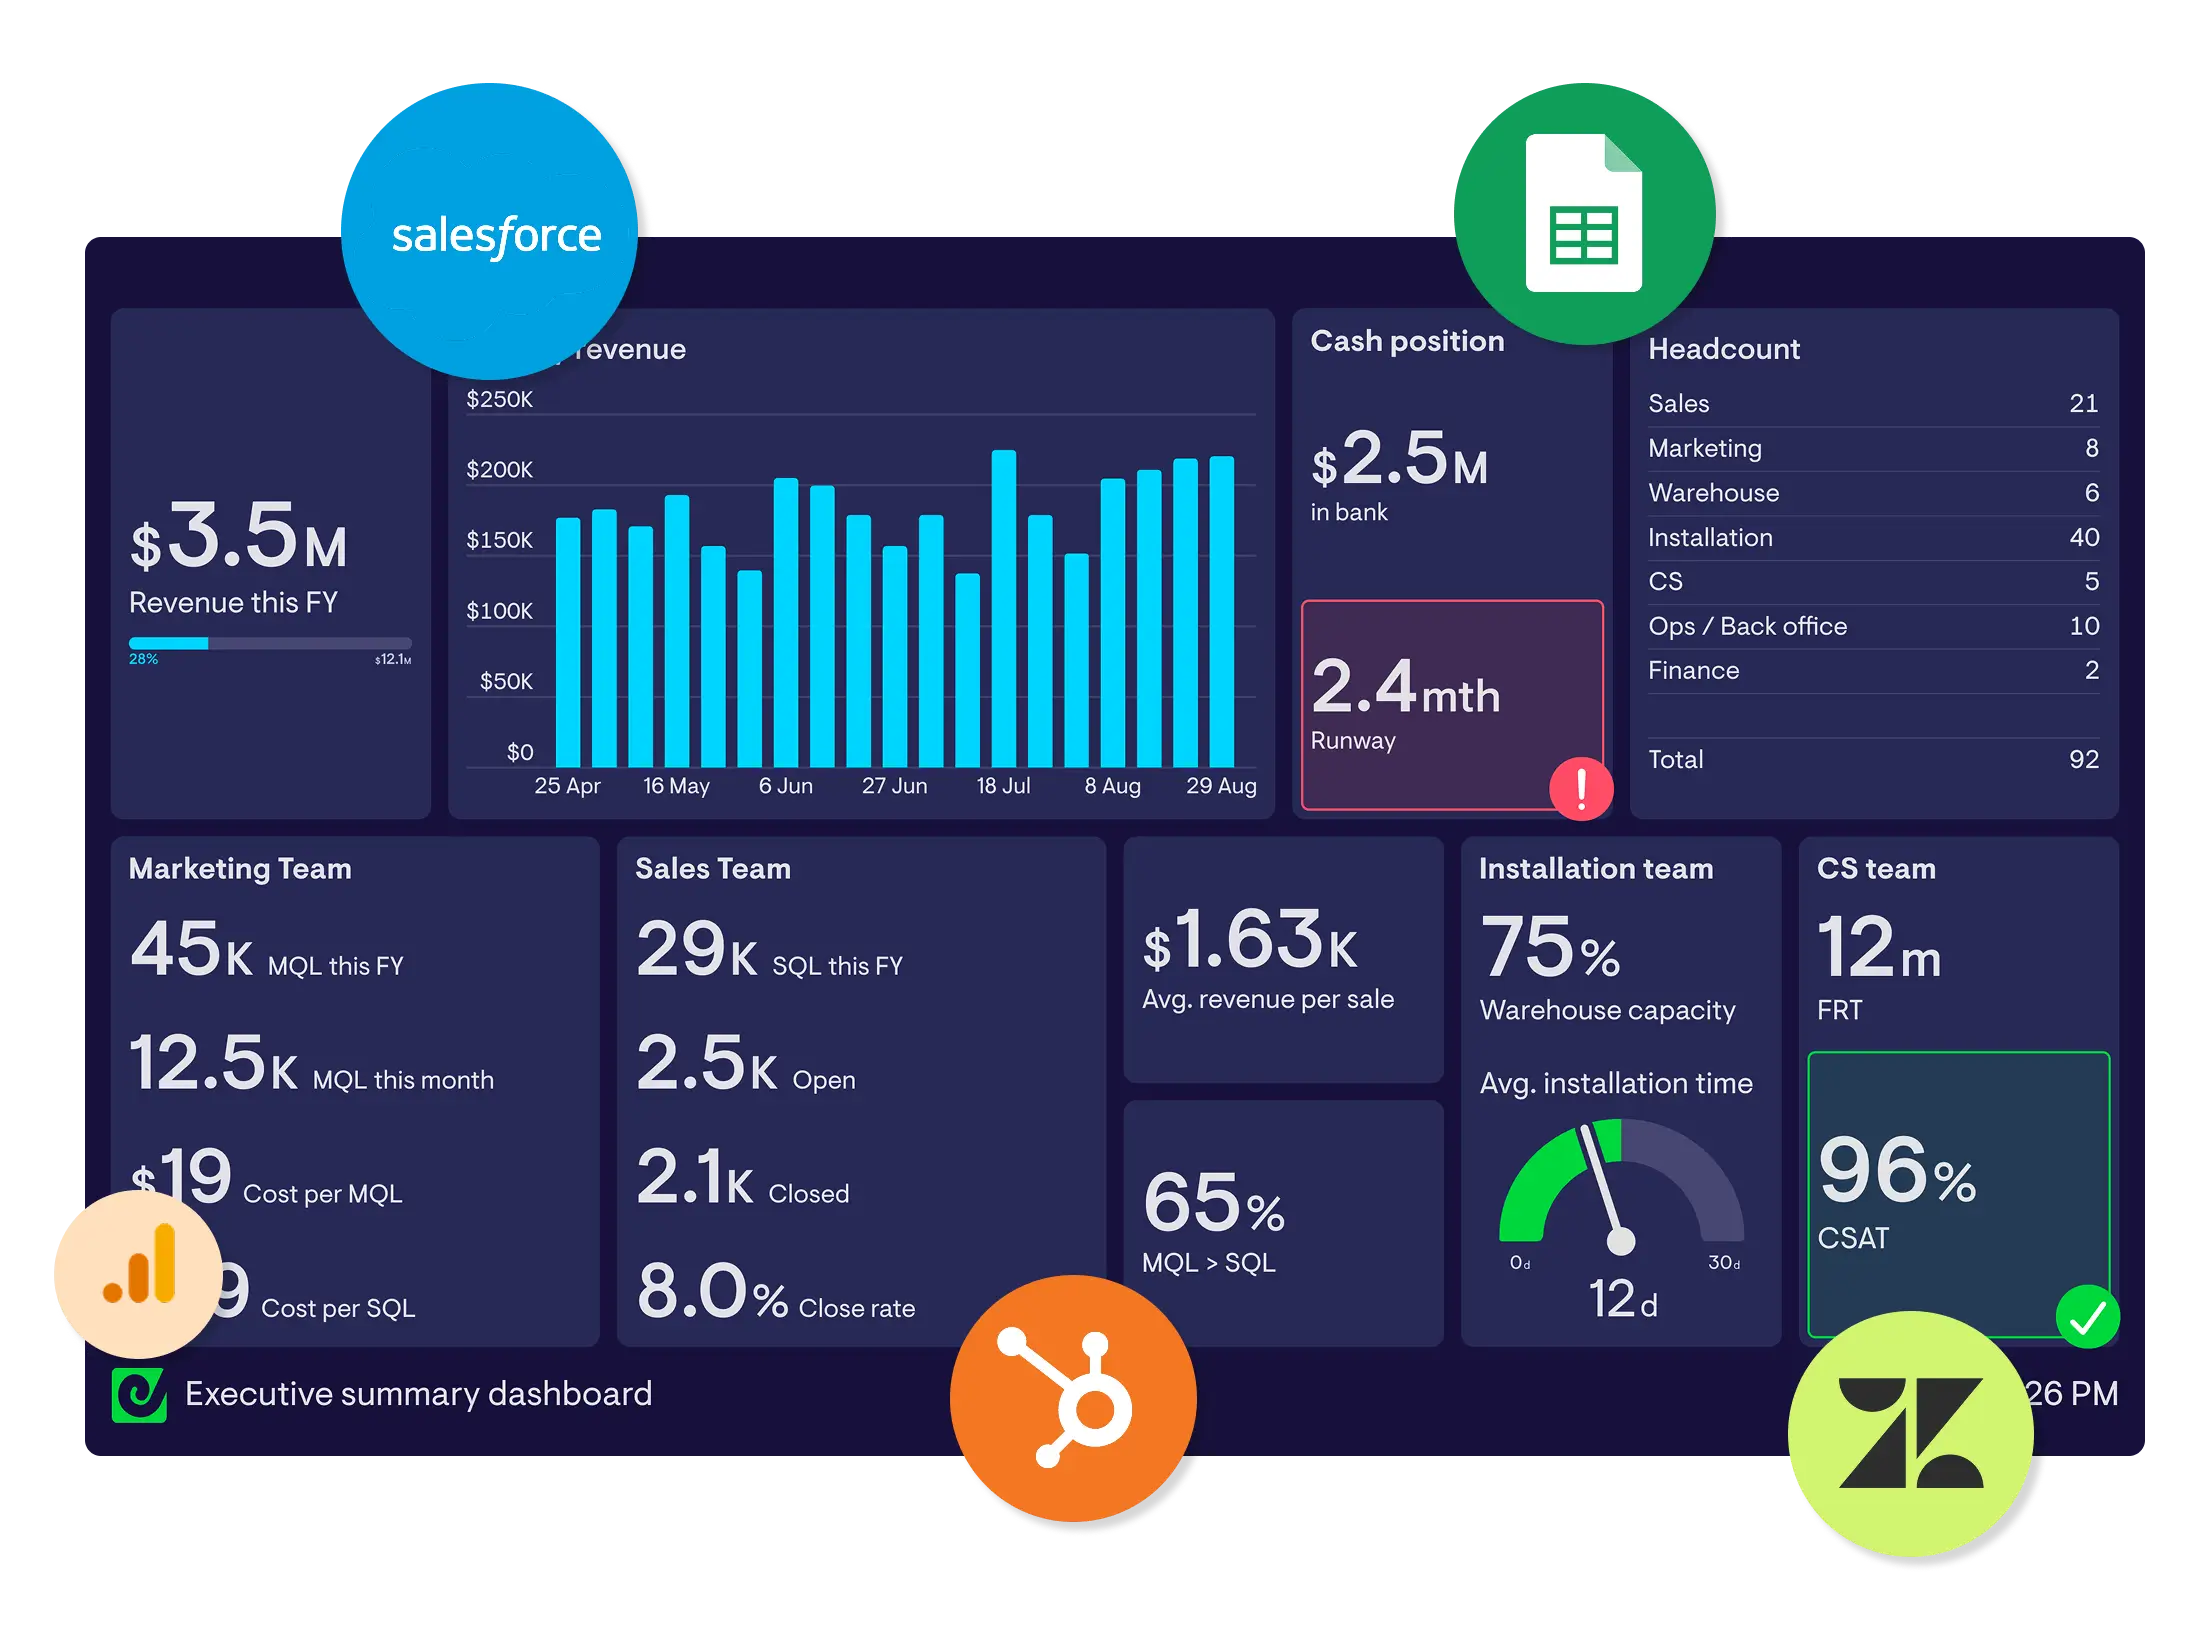
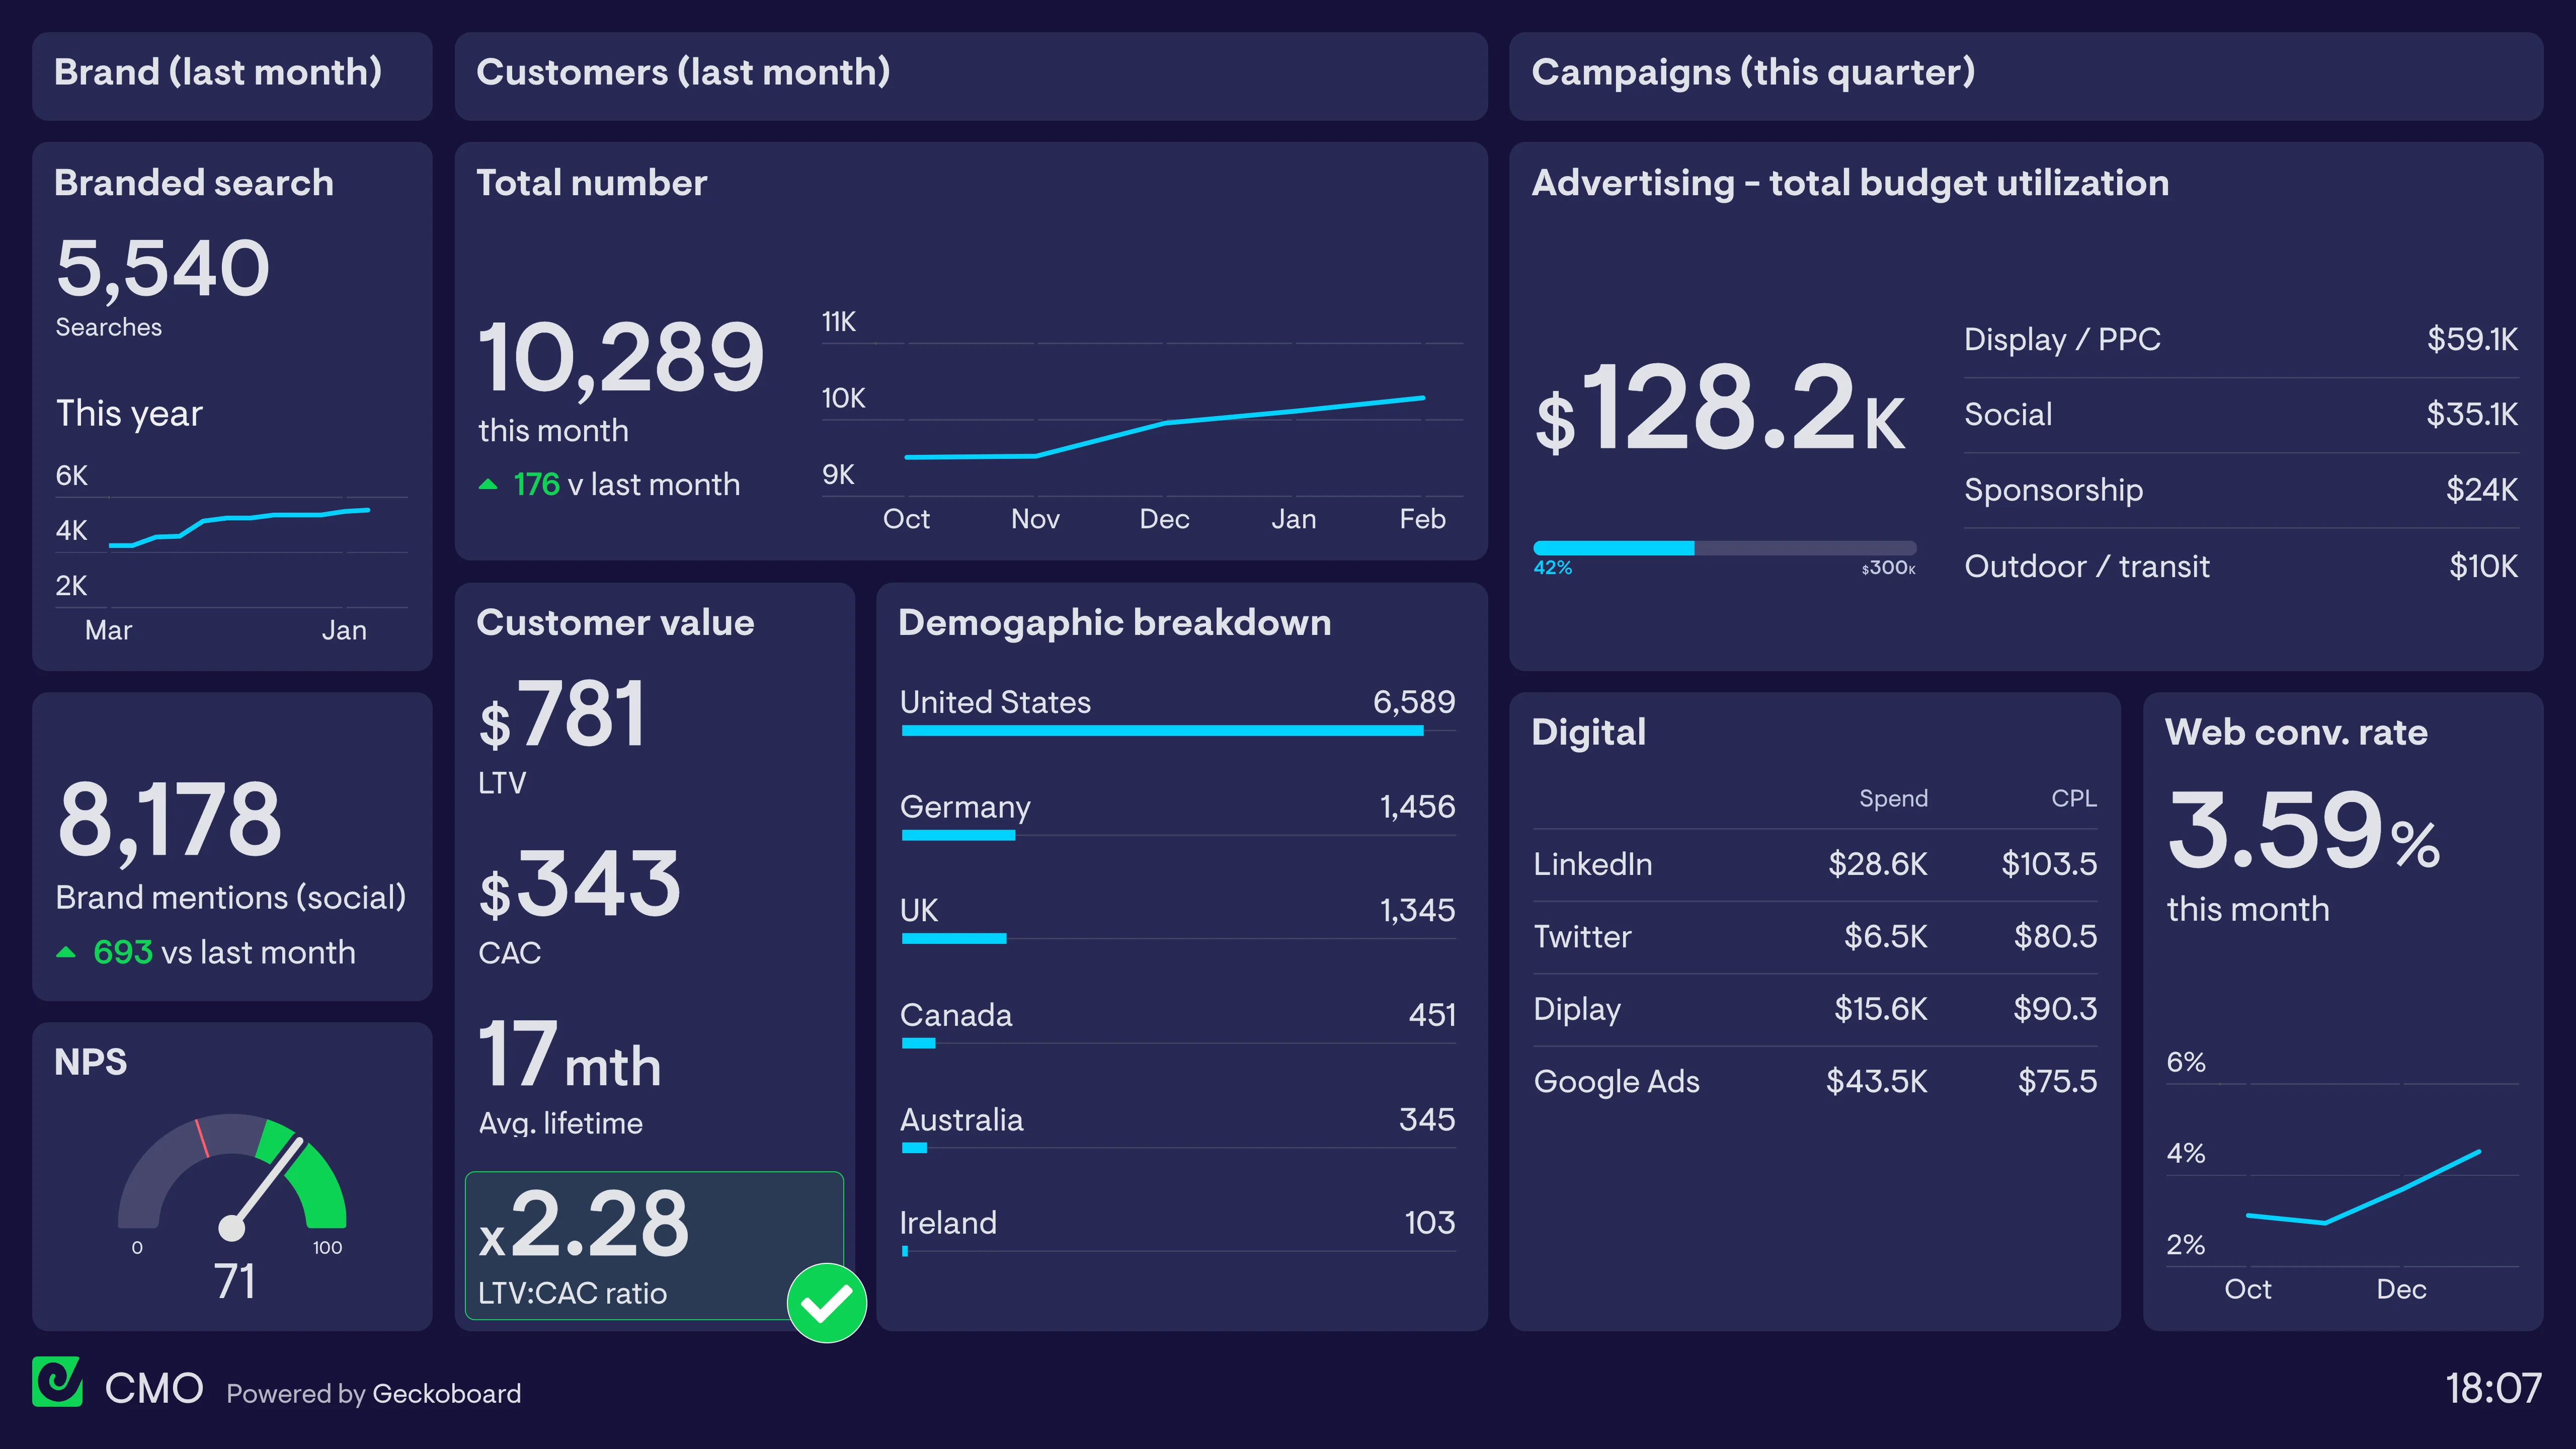
Cross-functional data, one picture.
- Finance, CRM, operations, and product data brought together for a leadership or board view.
- One dashboard that tells the full story without a custom report from every department.

The consolidated view none of your source tools have.
Multi-source from the start
Geckoboard connects to multiple tools simultaneously. It is not a report you export from a single system — it is a live dashboard that pulls from your whole stack and keeps every metric current.
Live data, not lagging reports
Metrics update automatically from your source tools. Your team sees what is happening now, not what happened last week.
Built for every audience
Support agents, sales reps, team leads, and board members all work from the same connected data, in a format that fits how each of them uses it.
Consolidate your data in an hour or less.


The information was critical, but it was stuck in Zendesk. We needed real-time insights that anyone could see, from agents to executives.
Trusted by data-driven teams across thousands of businesses
- Data updates in real-time, as standard
- A growing number of features and data sources
- Safe, secure handling of your data
- Quick and efficient, 24/5 support

A business dashboard is a live view of the metrics that matter most to your team, pulled automatically from the tools you use every day. Instead of switching between platforms to piece together what’s happening, your team has one screen that updates in real time. Geckoboard connects your CRM, support, finance, and operations tools into a single business dashboard anyone on the team can access.
Native reporting in HubSpot, Zendesk, or Salesforce only shows data from that one platform. If you need to understand performance across more than one tool, native reports can’t give you that. Geckoboard combines data from all of them in a single live view.
Spreadsheets work until they become the job. Every manual assembly step is a recurring cost: time to pull the data, time to format it, and a view that’s already out of date when it’s shared. Geckoboard removes the assembly entirely. Connect your sources once, and the dashboard stays current on its own.
Neither. Geckoboard is a dashboard platform. It connects to your existing tools and displays live metrics in a format your whole team can use without SQL, data modelling, or analyst support. Think of it as the live view that sits on top of the tools you already have.
Tableau and Looker are built for analysts who need to model and explore complex data. Geckoboard is built for operational teams who need to see what is happening right now, without technical setup or ongoing maintenance. Most teams use both: BI tools for strategic analysis, Geckoboard for the live operational view.
That is exactly who Geckoboard is built for. Non-technical managers connect their own sources, build their own dashboards, and make changes without involving a data or engineering team. Our onboarding team can walk you through the setup in a 20-minute session. Start a free trial or schedule a demo.
90+ sources including HubSpot, Zendesk, Aircall, Salesforce, Jira, Xero, Google Sheets, Snowflake, Intercom, and many more. Custom data can be added via the Datasets API or a spreadsheet import. See all integrations.
Geckoboard handles the refresh automatically. Once you connect a source, the dashboard stays current without any manual steps. No exports, no triggers, no one responsible for keeping it live. See refresh rates for all data sources.
Yes. You can build separate dashboards for frontline agents, team leads, and executives from the same connected data. Each audience sees the view that works for their role, on a screen, via a link, or as a Slack snapshot. Learn more about team visibility.
See the full picture of your business, without the manual work.
Connect your tools. Build your first dashboard. No engineering required.