Team performance dashboards that keep everyone aligned
Geckoboard surfaces live KPIs for your whole team, so targets are clear, progress is visible, and teams can manage themselves without waiting to be told.


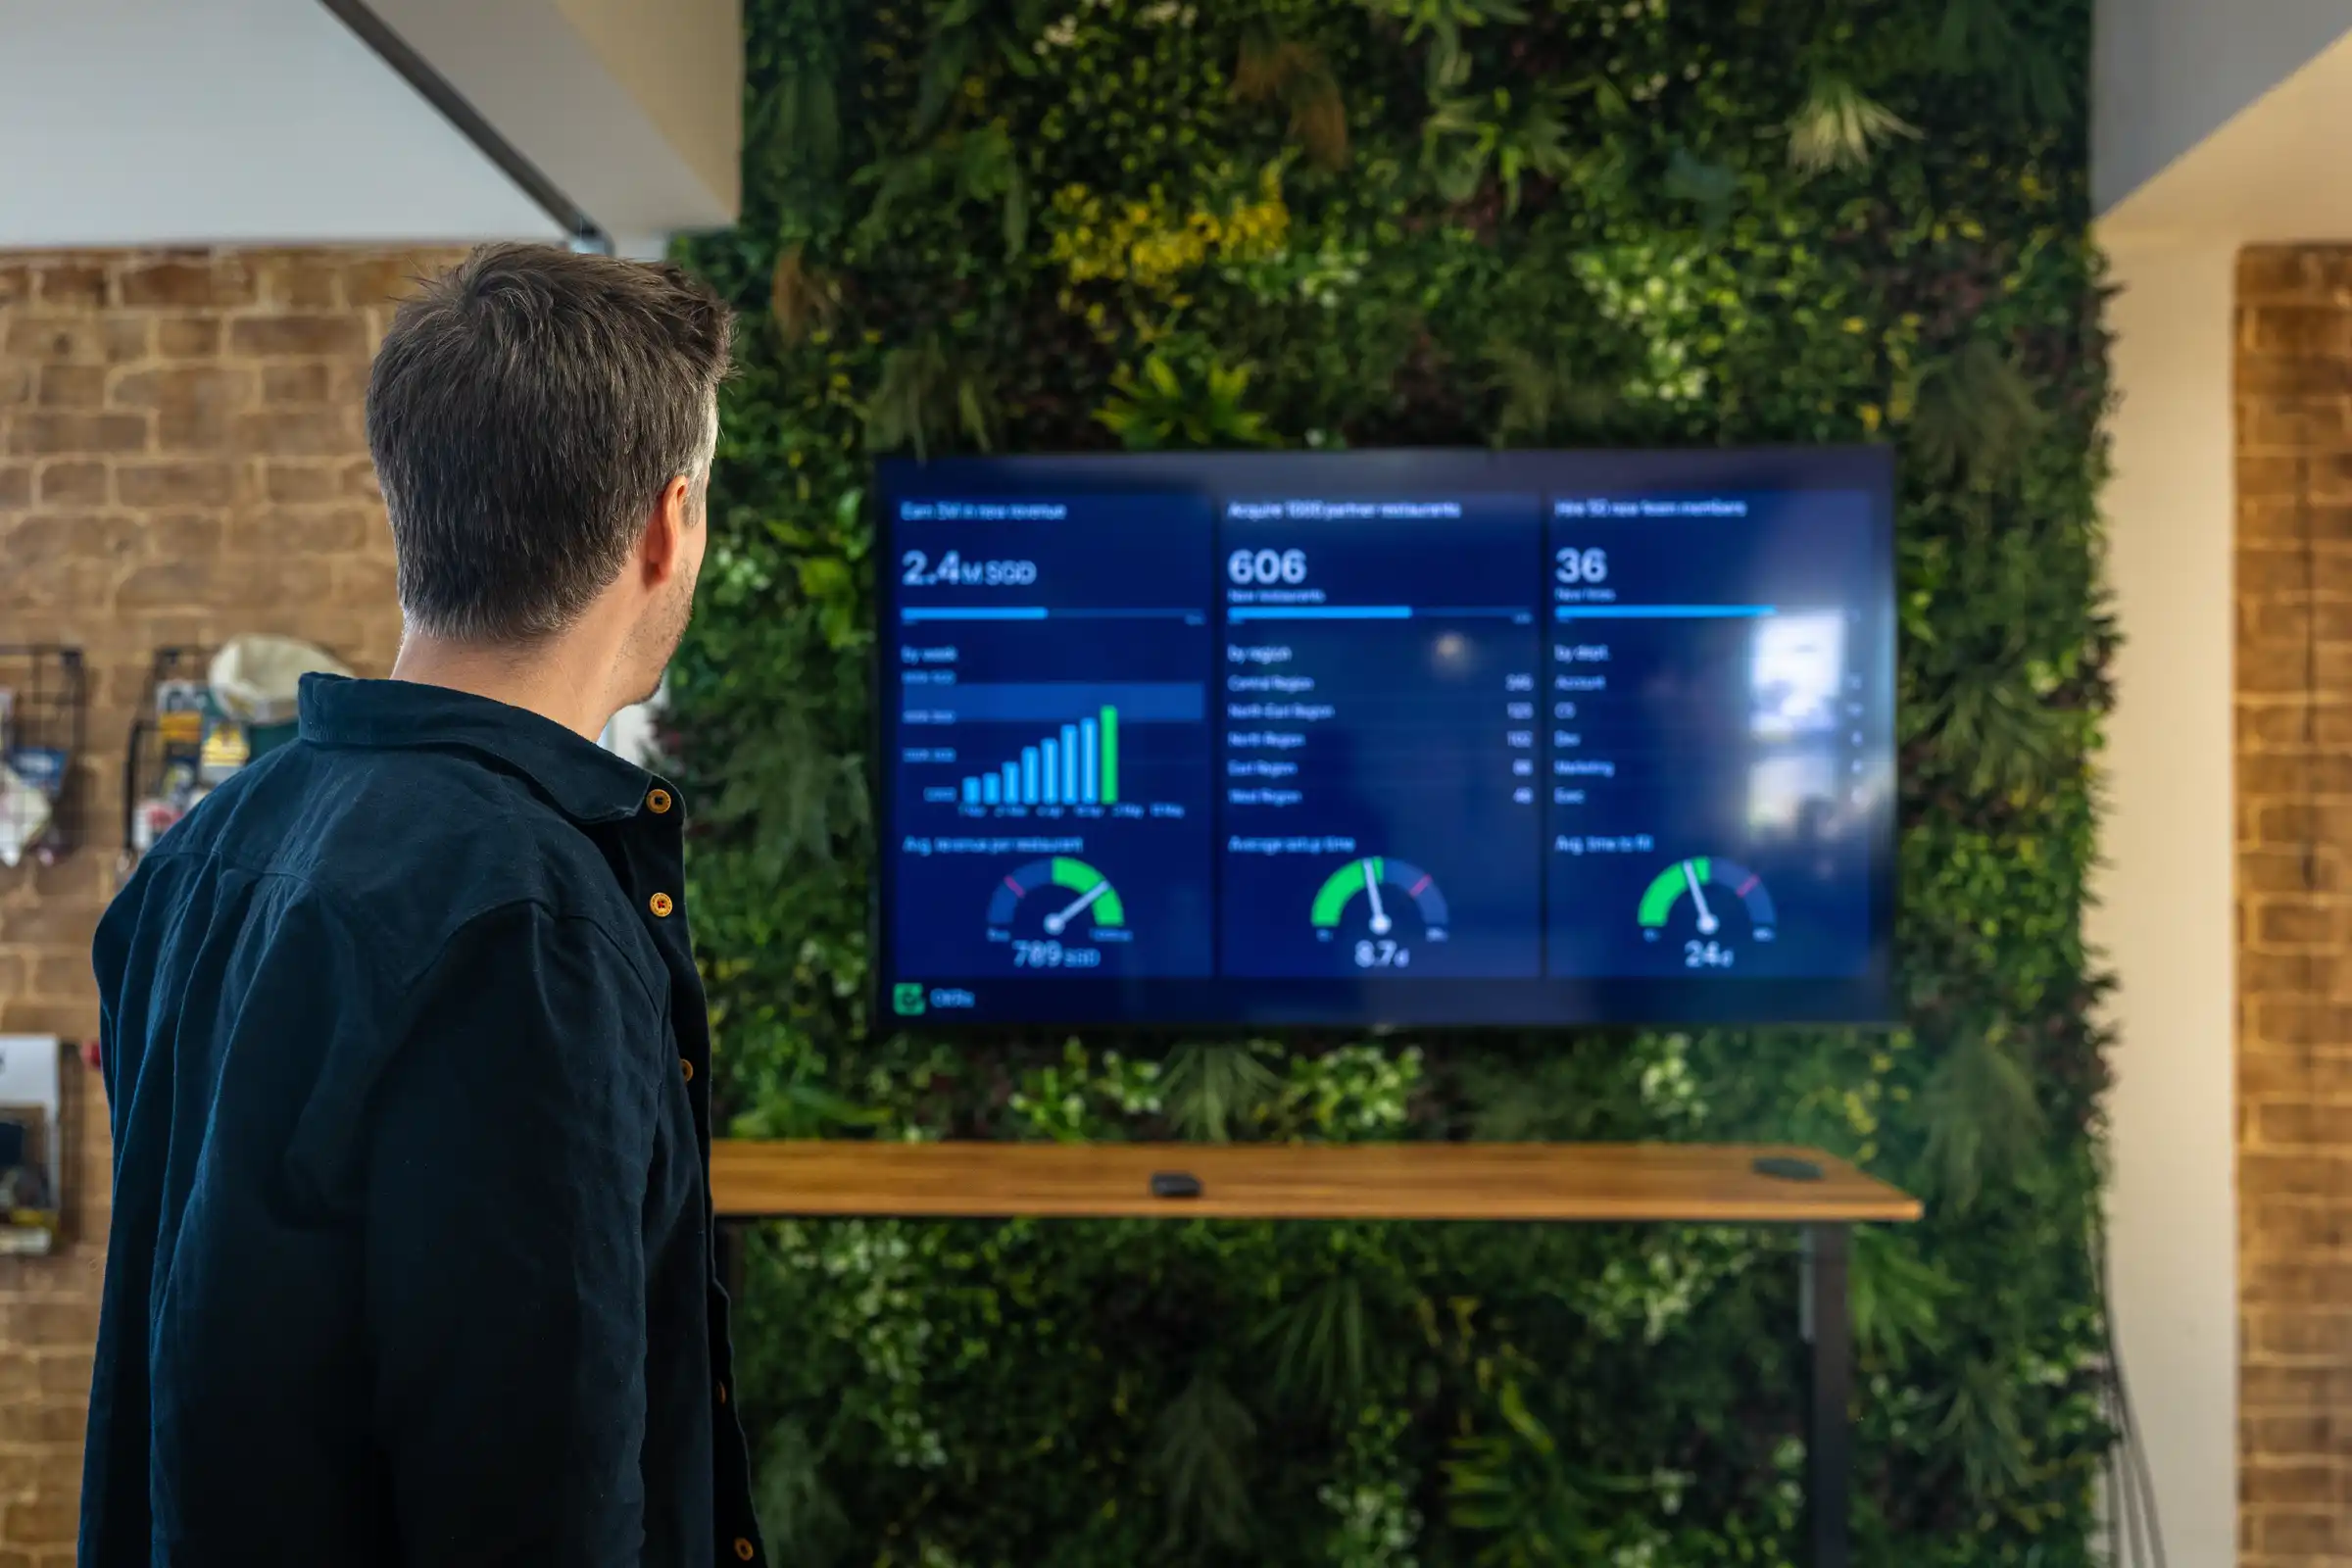
Your team can’t act on data they can’t see.
When KPIs live inside a manager’s reporting or analytics tools, the people responsible for hitting them are flying blind. Support agents don’t know if the queue is building. Sales reps can’t see where they stand against target. Team leads spend time chasing updates that shouldn’t need chasing.
By the time someone’s found the right numbers, the moment to act has already passed.
Whether your team is in the office, working from home, or spread across locations, the problem is the same: performance is locked away where most people can’t see it.
Drive action by giving teams access to live data.
Teams with a live view of KPIs see dramatic performance gains.
- Teams make faster decisions based on the data they see
- Creates accountability without micromanagement
- Coaching becomes timely, not retrospective
- Motivates teams through shared visibility of progress
- Trust builds when performance is visible to everyone
How it works
Connect your tools. Build your dashboard. Put it on a screen.
Connect to Zendesk, Salesforce, HubSpot, Aircall, Google Sheets, and 90+ more, and display live metrics wherever your team works. Numbers update automatically. No exports, no maintenance, no one needs to remember to refresh it.
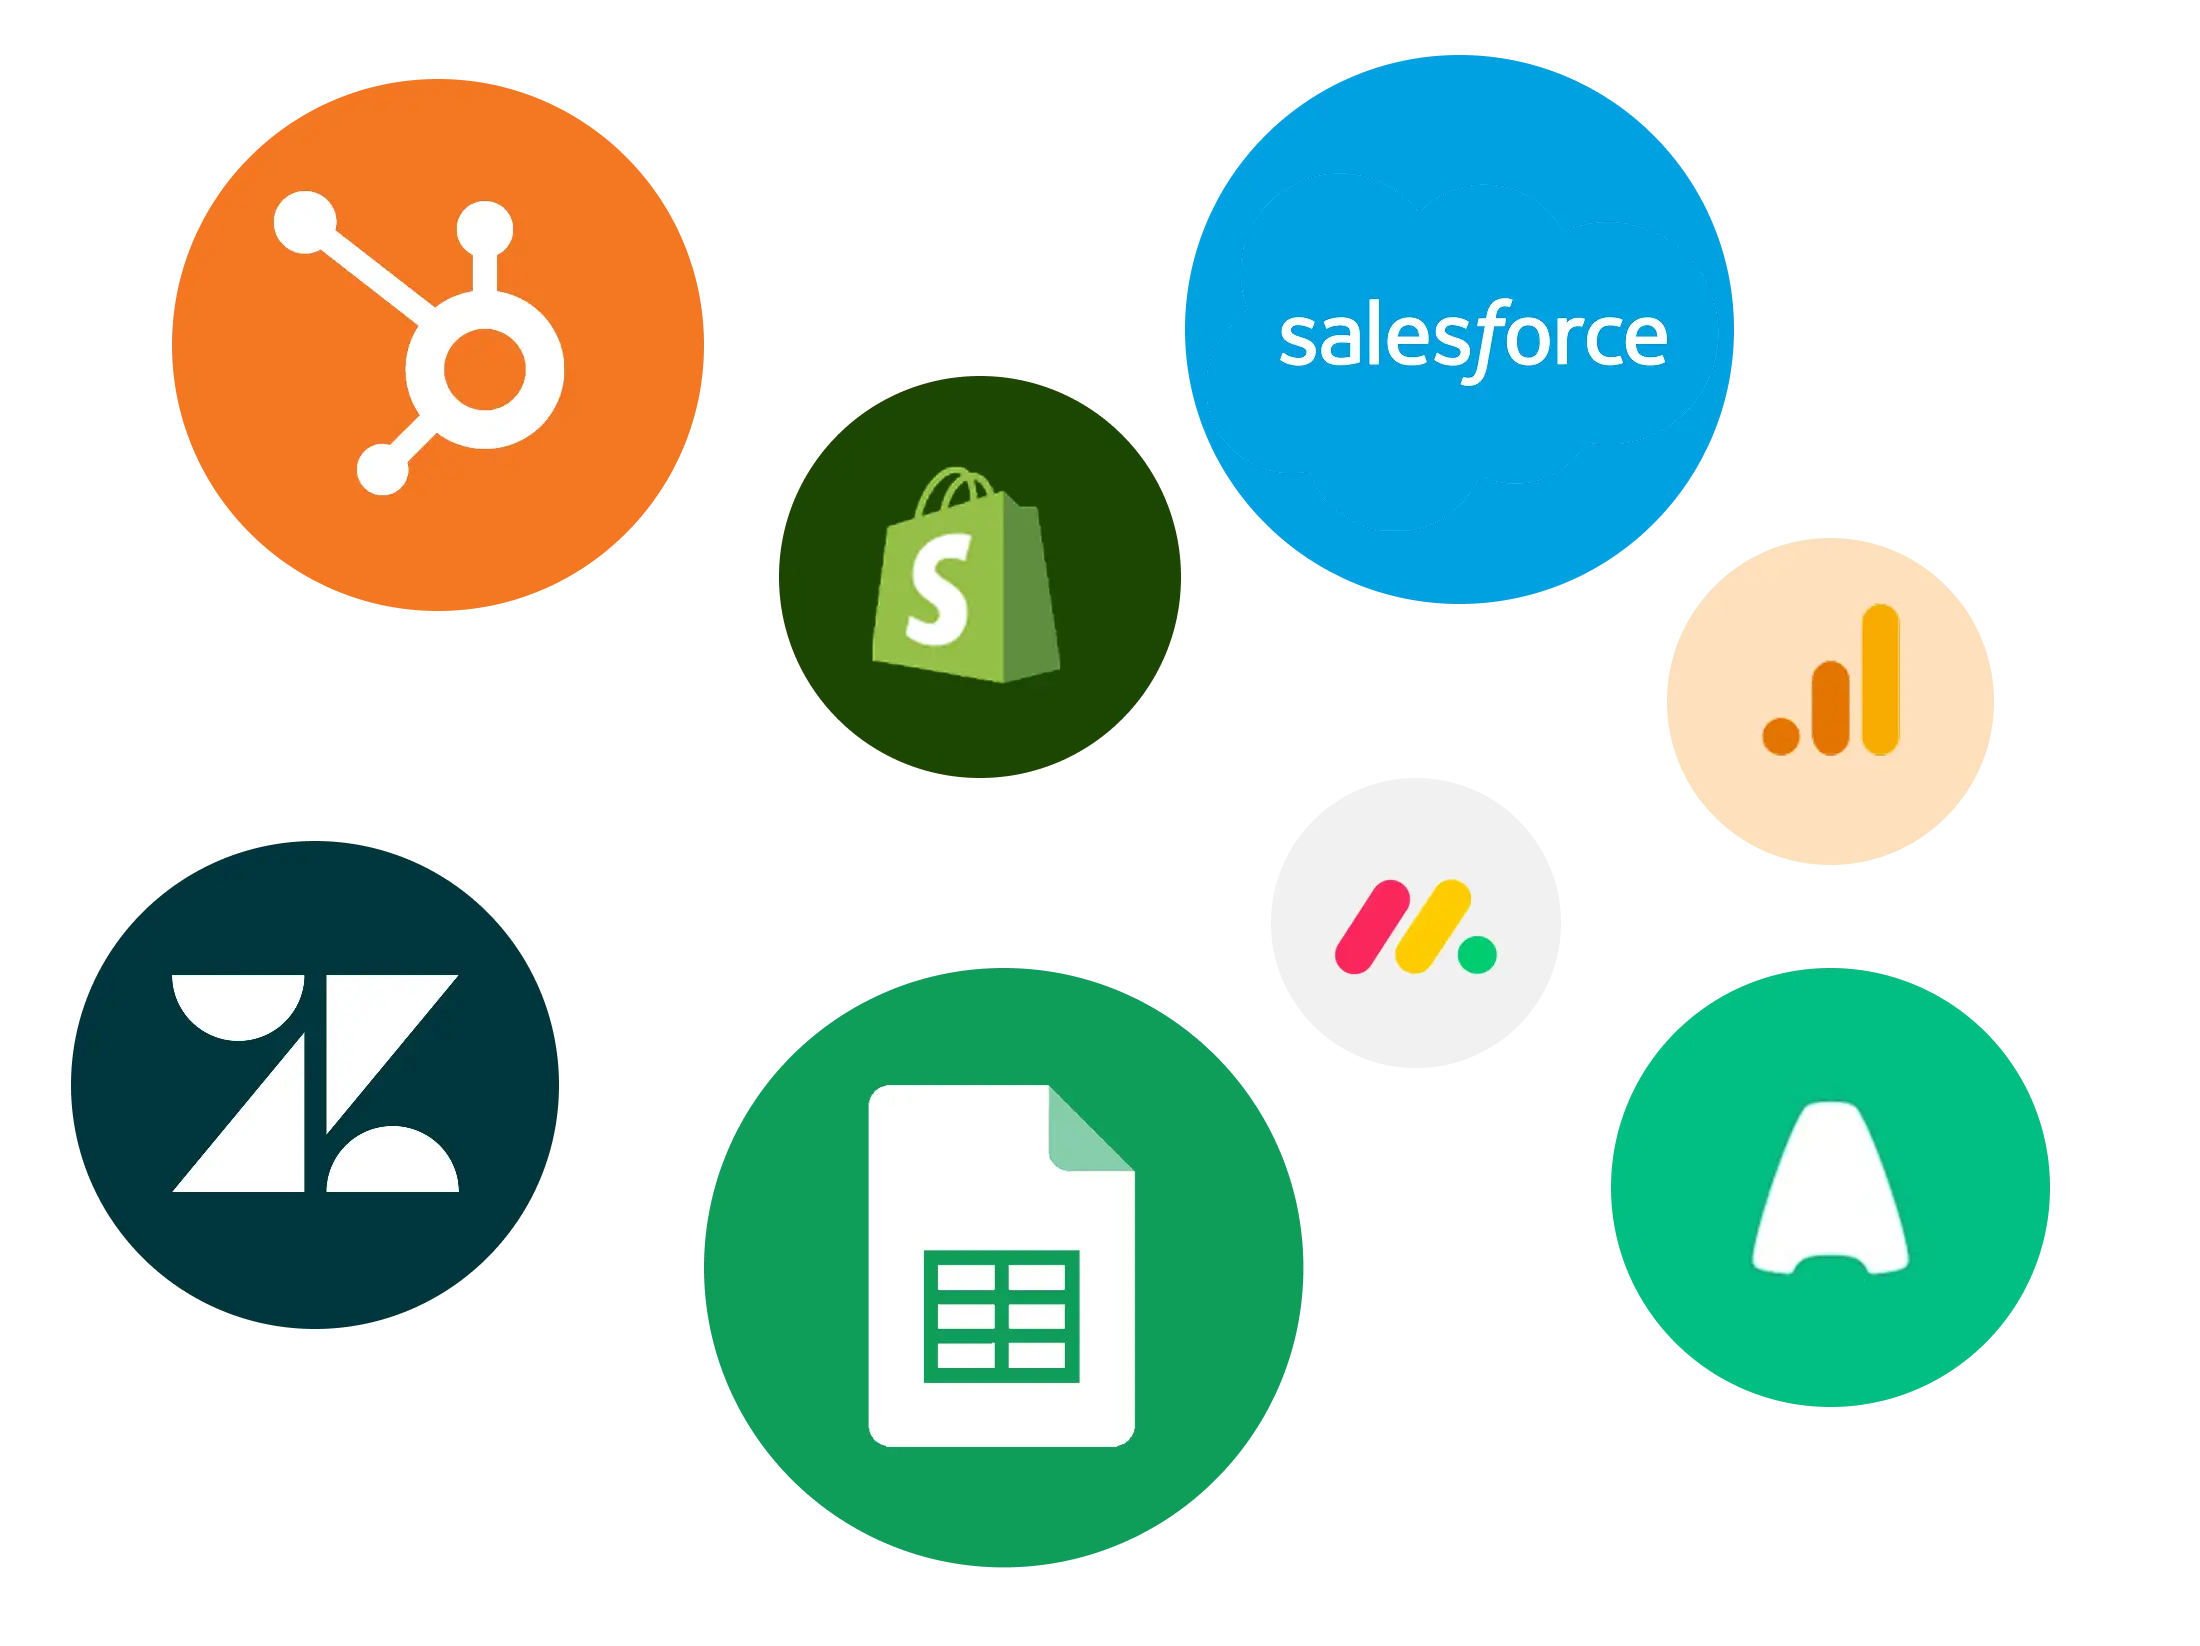
Step 1: Connect
Connect your tools in a few clicks — from Salesforce to Spreadsheets, Zendesk to Zapier. No engineering work required.
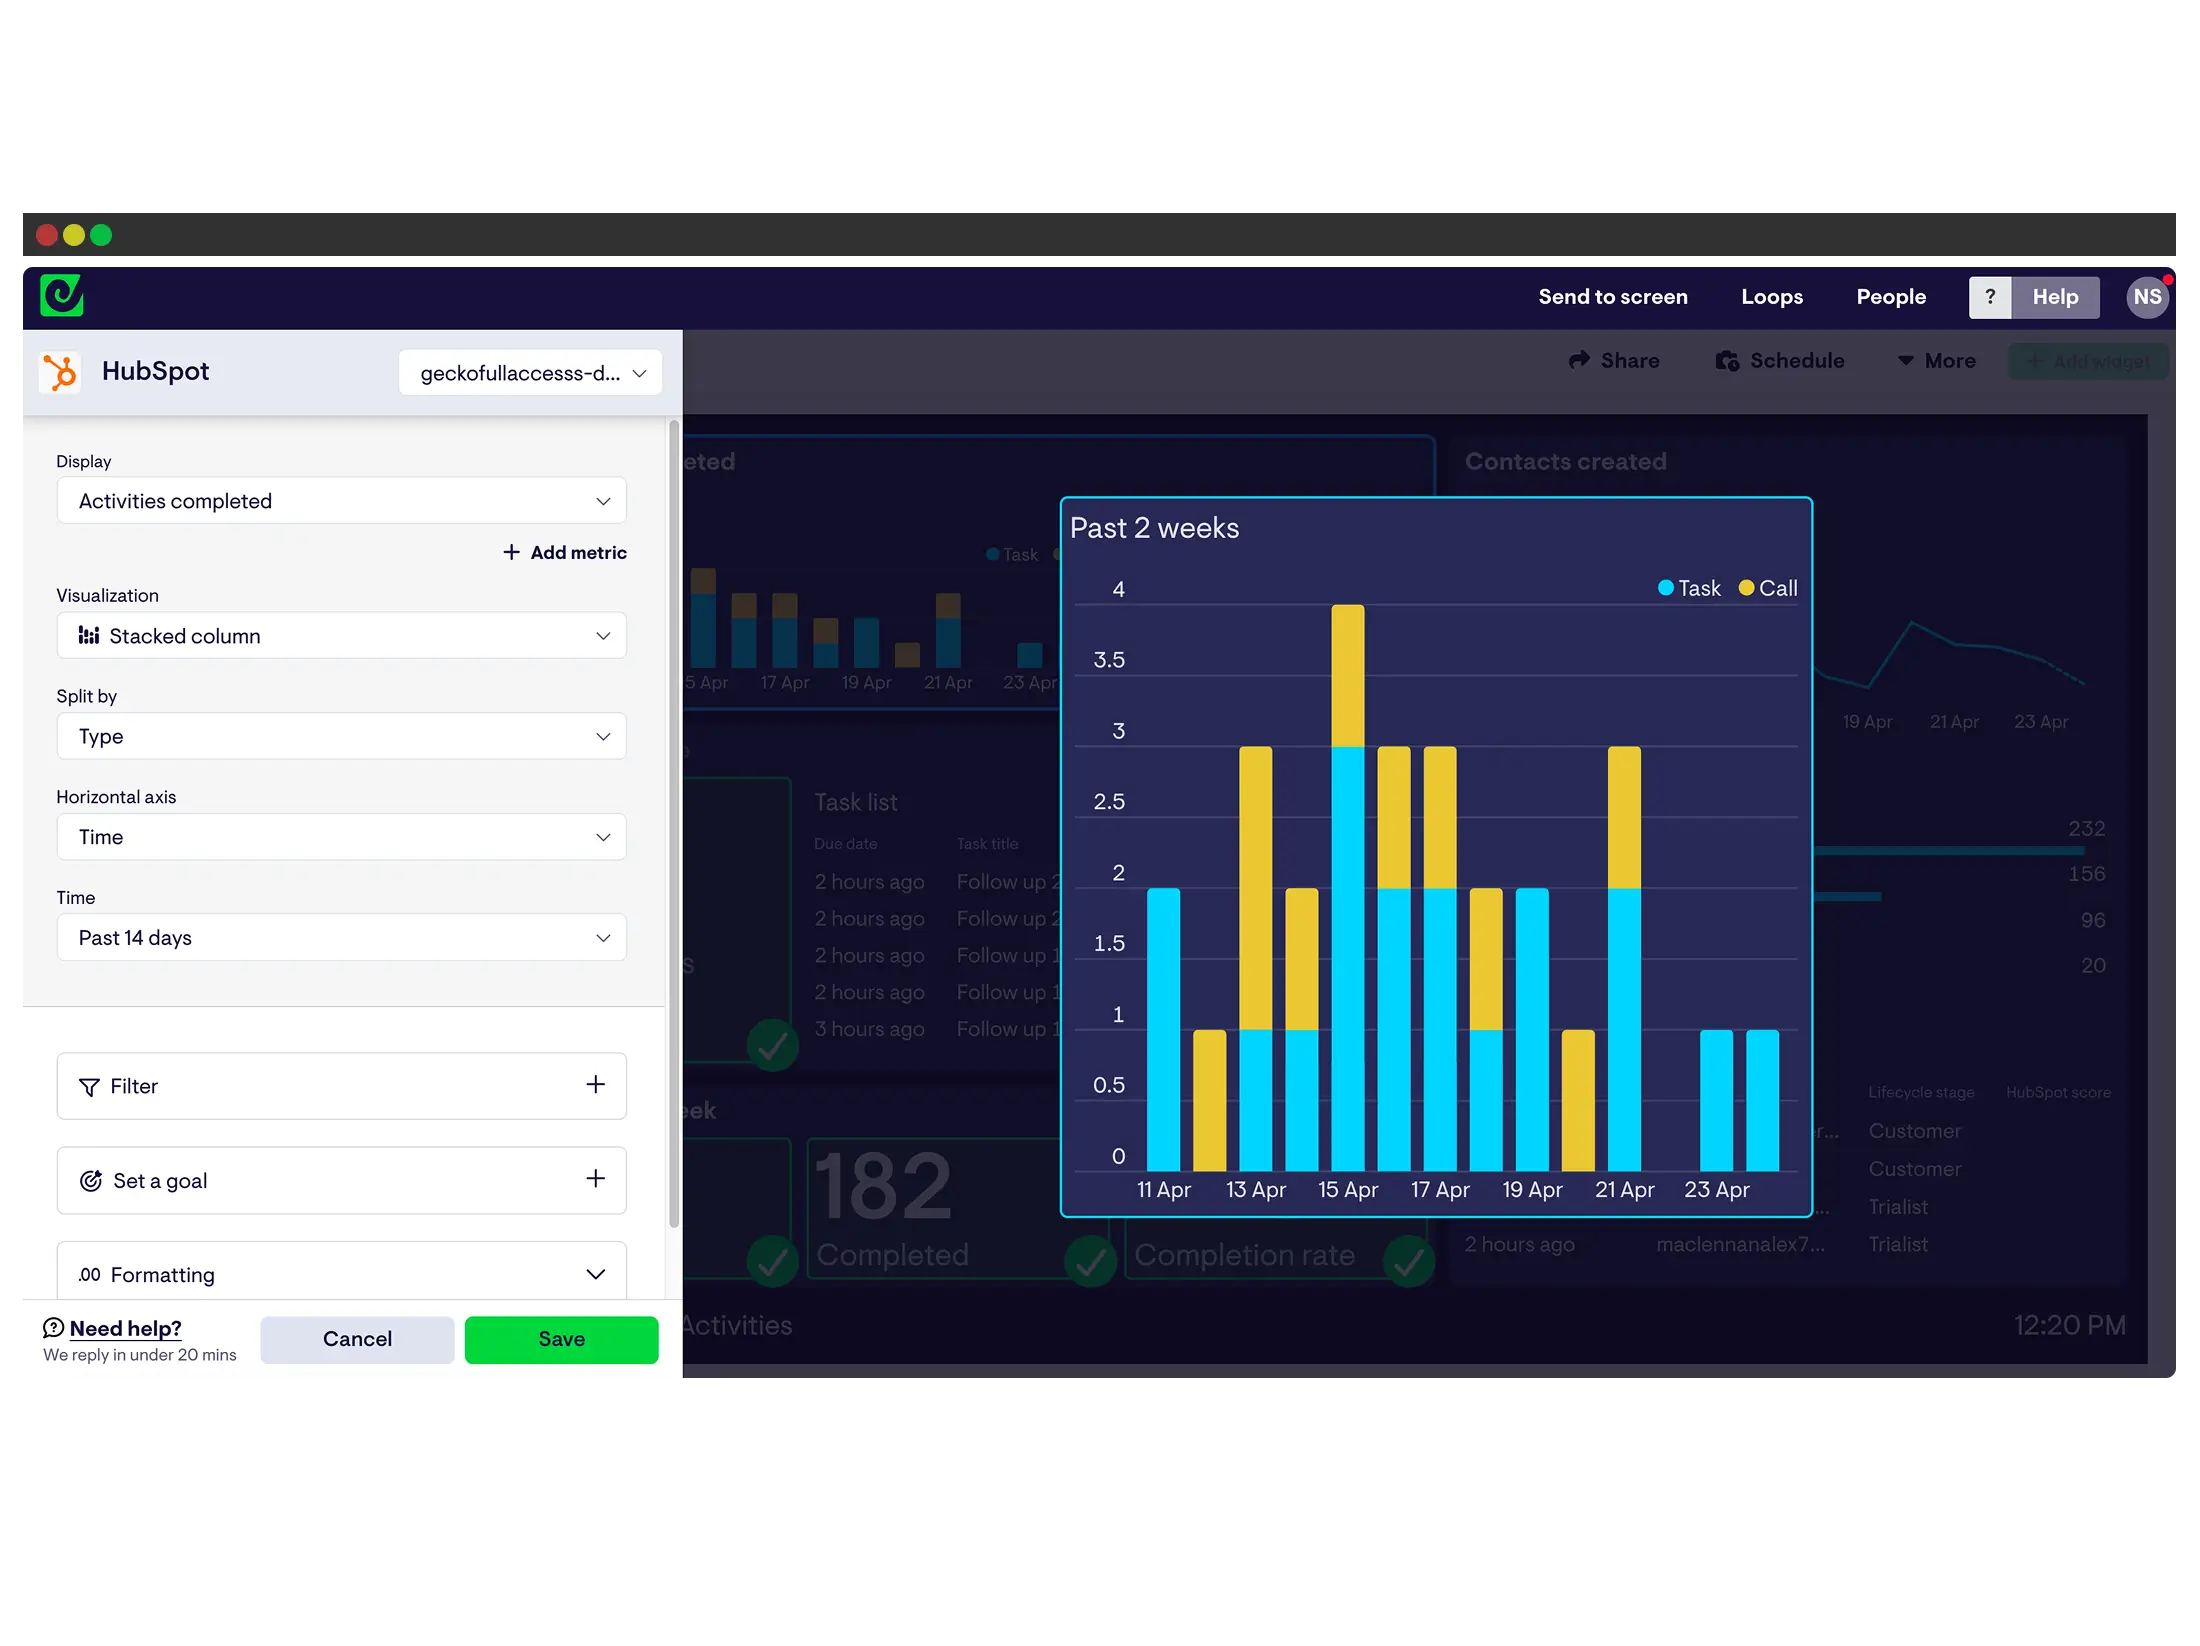
Step 2: Build
Choose your KPIs and arrange them in the drag-and-drop editor to create a custom view of your team’s performance.
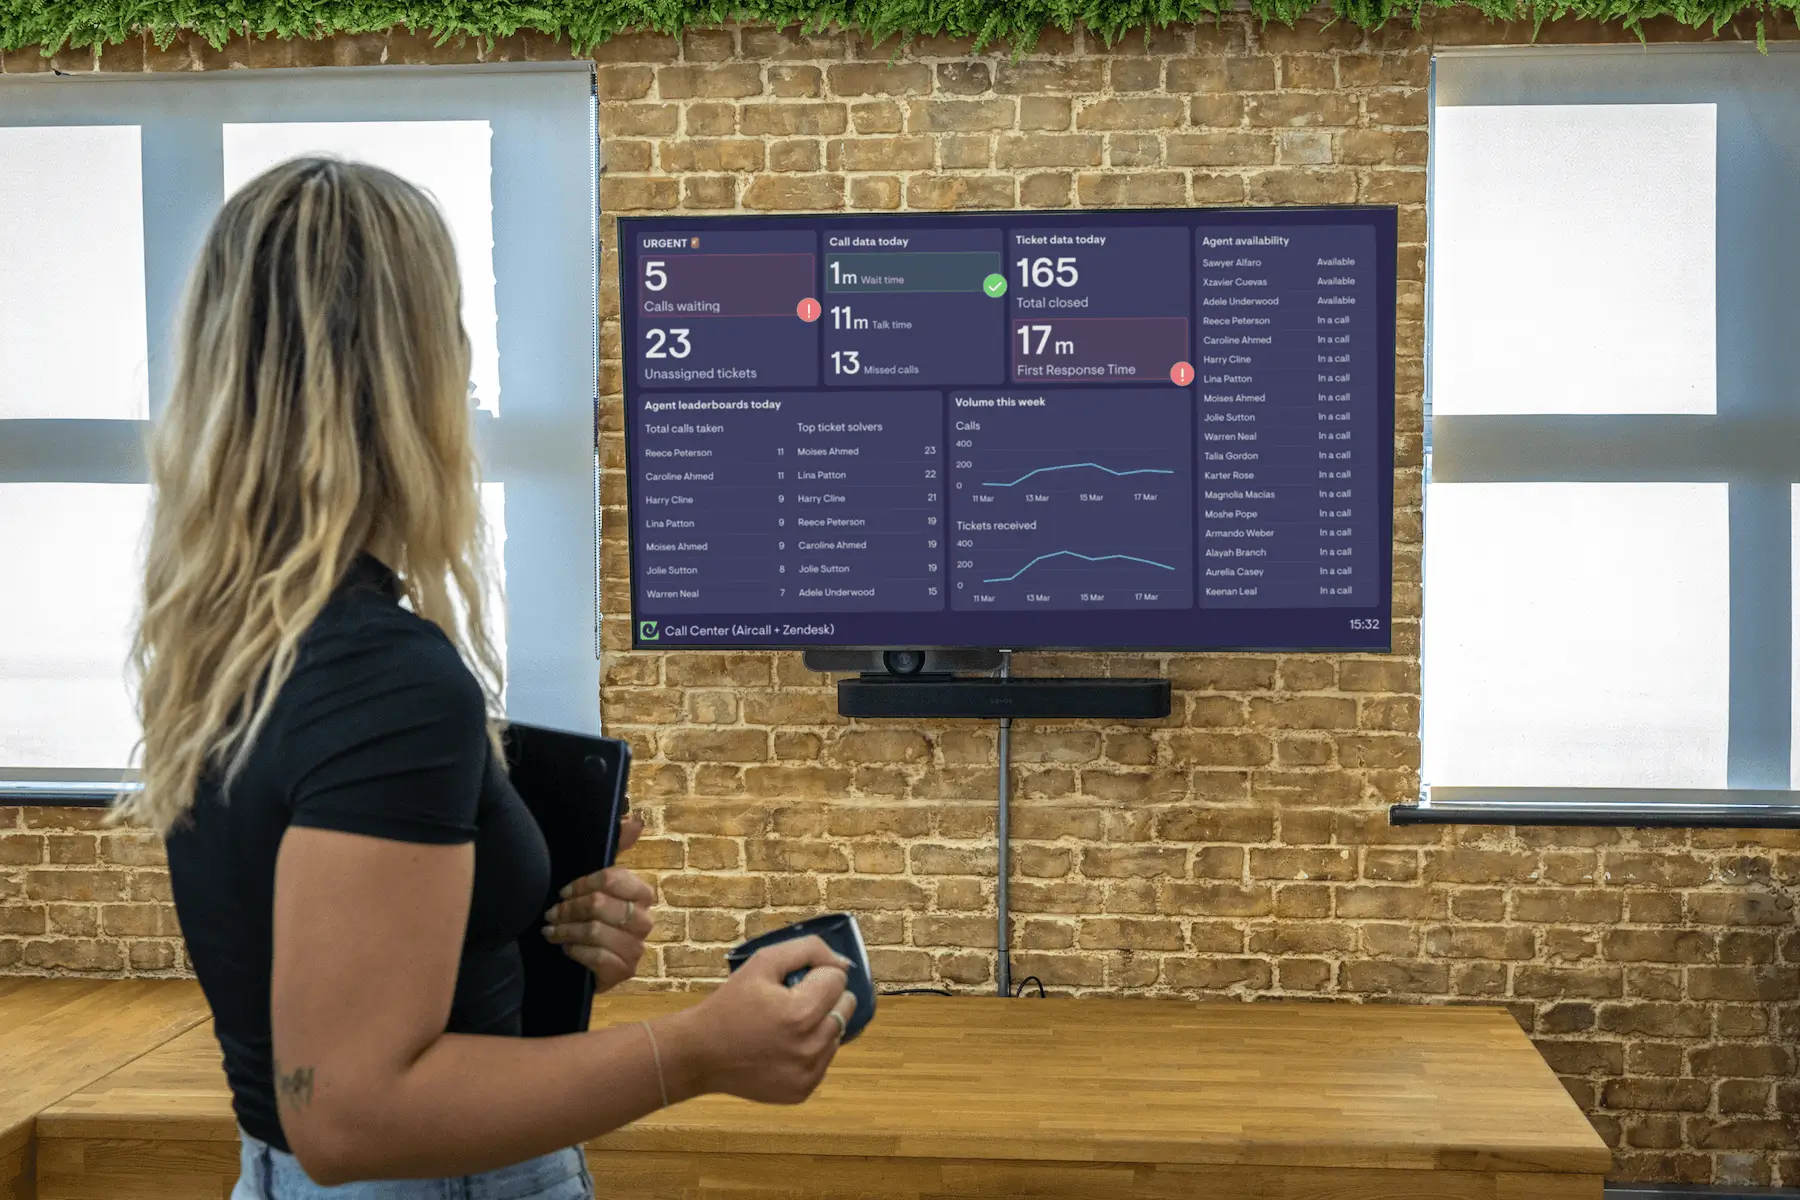
Step 3: Share
Put it where your team will see it, on an office TV, via a shared link your remote team bookmarks, on mobile, or pushed to Slack and Teams.
Works for every layer of the team
They see the numbers. They act on the numbers.
When agents and reps have a live view of queue depth, response times, and workload, they stop waiting for direction. They see the signal and respond to it, without waiting to be told. Managers describe this as the most immediate change after rolling out a live display: it’s not about the dashboards themselves, but the shift in how teams operate.
See where the backlog is forming. Move coverage before it matters.
When performance is live on a screen, team leads can see exactly where attention is needed: which queue is backing up, which channel is underserved, where an SLA is starting to drift. That is the picture they need to reallocate people and make coverage decisions in the moment — not after a CSV report lands in their inbox a day later.
Share live performance with leadership. No licence required.
Keep executives and adjacent teams in the loop, in a format anyone can read, without extra tool seats or training. When support or sales performance is visible beyond your department, leadership trusts the team more and needs fewer status updates.
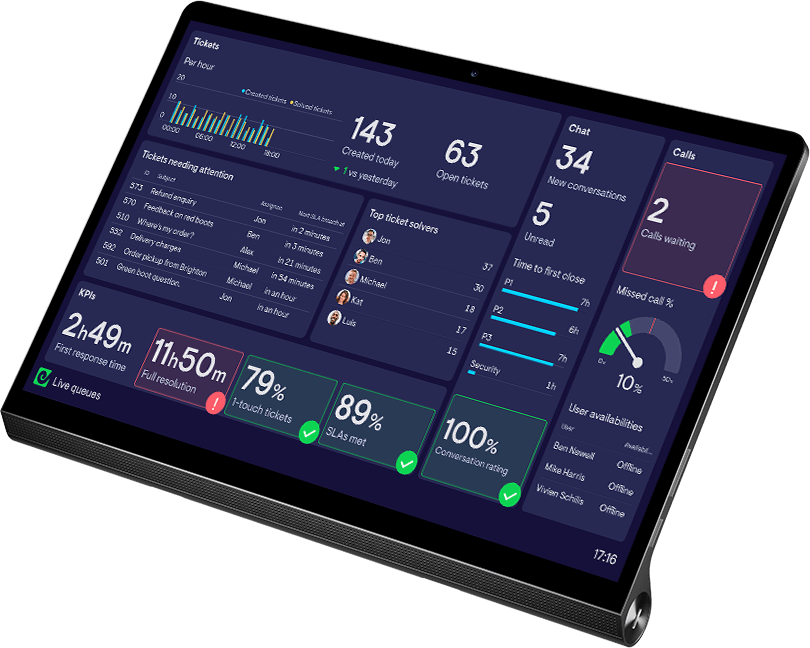
Example team dashboards
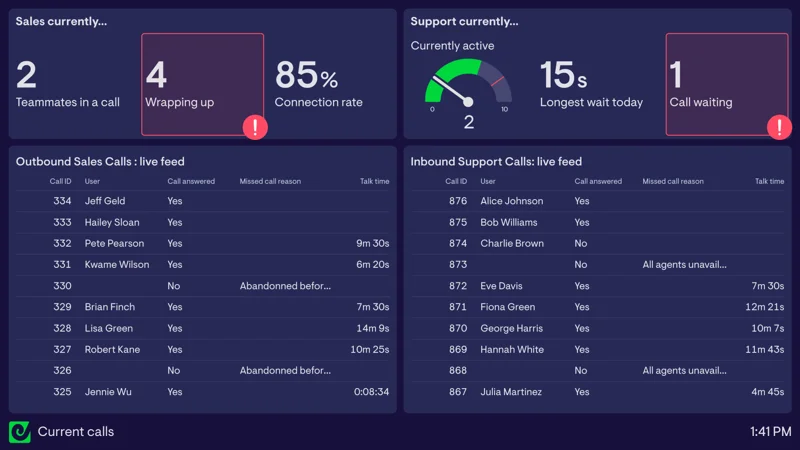
Live call monitoring dashboard
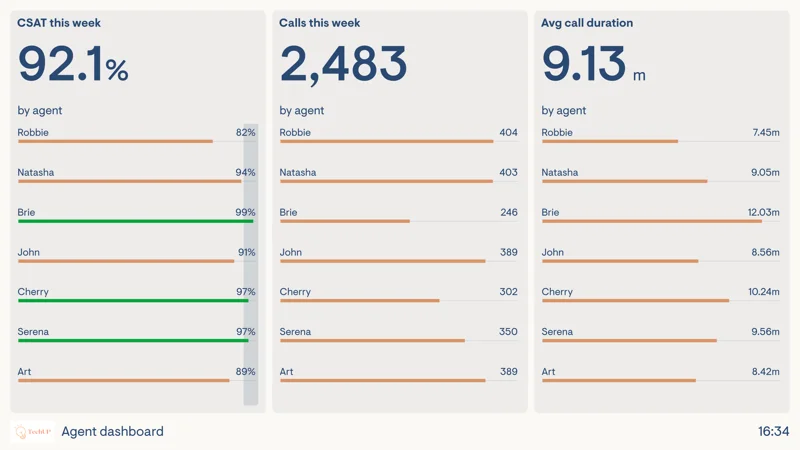
Agent performance dashboard
SLA tracking dashboard
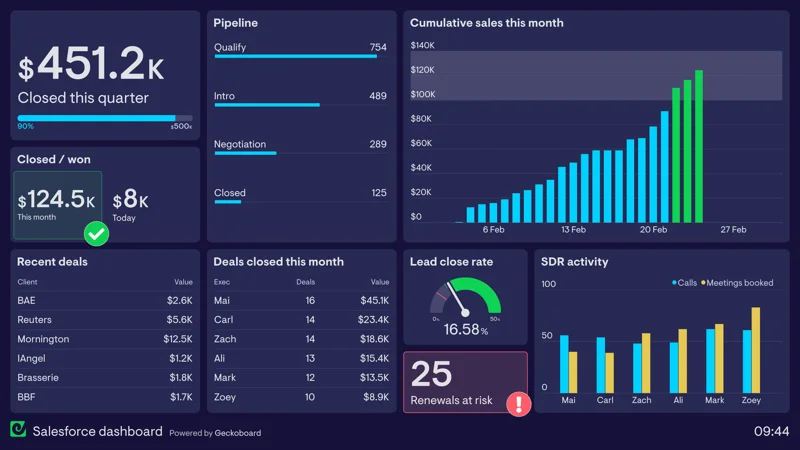
Salesforce dashboard
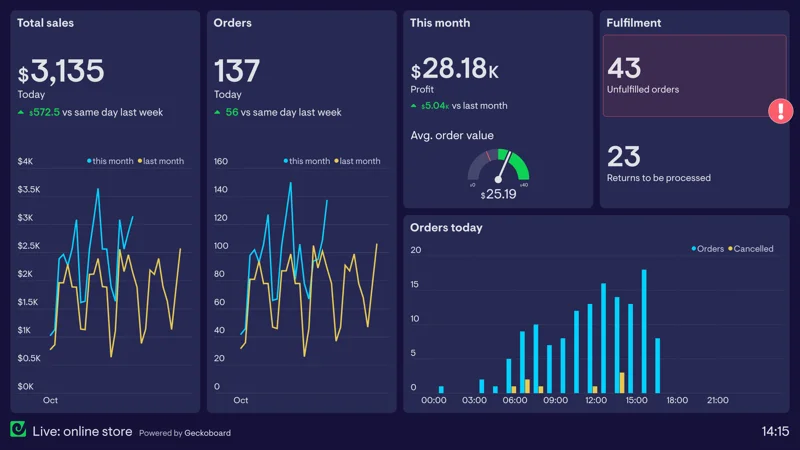
Live online store dashboard
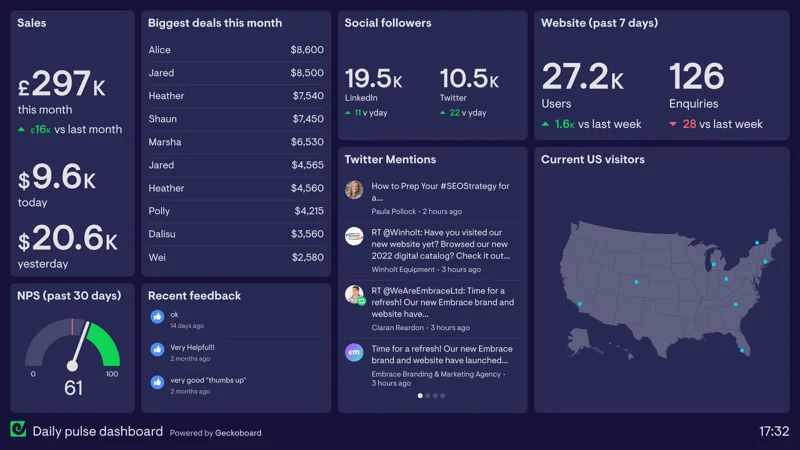
Company digital dashboard
Built to drive performance, not just display it.
Automatic real-time updates
Data pulls from your tools and stays current throughout the day. No exports, no refresh, no one needs to remember to update it. The numbers are always what’s happening now.
Live leaderboards
Show individual or team performance side by side in real time. Teams perform better when they can see how they’re contributing, and a little friendly competition goes a long way.
KPI alerts
Get notified the moment a metric crosses a threshold. A queue spiking, a target slipping, an SLA drifting — alerts reach you in Slack, Teams, or email before the situation gets worse.
Performance comparisons
Compare performance over time, between team members, or across teams. Understand direction of travel for any metric at a glance, and make decisions based on more than a single number.
Visible everywhere your team works
A shared screen on the support floor, a link your remote team has bookmarked, a live view on mobile. TV, desktop, Slack, and Teams. Everyone sees the same numbers, wherever they’re working from.
No extra seats in your source tools
Anyone can view a Geckoboard dashboard without a Zendesk, Salesforce, or HubSpot licence. Share a link or a TV display and the whole team has visibility — no upgrades, no permissions required.


Our first response times dropped by about 40%. Our resolution times dropped by about 30%. Having that data at our fingertips of what’s happening right now changed how we coach and how we operate.

The dashboard creates transparency for the team and autonomy for the agents. It helps them to figure things out by themselves, removes unnecessary communication and avoids micromanagement.
How Geckoboard compares

Built for analysis or reporting — not for team display
Built for team display. Anyone can view without logging in.
Requires paid seats, permissions, or a data team to maintain
No extra seats needed. No login required for viewers.
Each person sees a different filtered view — or nothing at all
One shared live view for the whole team, always the same
Data arrives late — daily exports, hourly syncs, or manual sends
Updates automatically. No one needs to export or send it.
Desktop and inbox only — not visible on a team floor
Display on a TV, desktop, mobile, Slack, and Microsoft Teams
Locked to one tool, or too complex for day-to-day operational use
Connects to 90+ tools including Zendesk, Salesforce, and HubSpot
Frequently asked questions
Give your team access to the numbers that drive their day.