SQL dashboard examples
Connect your SQL databases to Geckoboard and build live dashboards that keep your whole team informed — no manual reporting required.
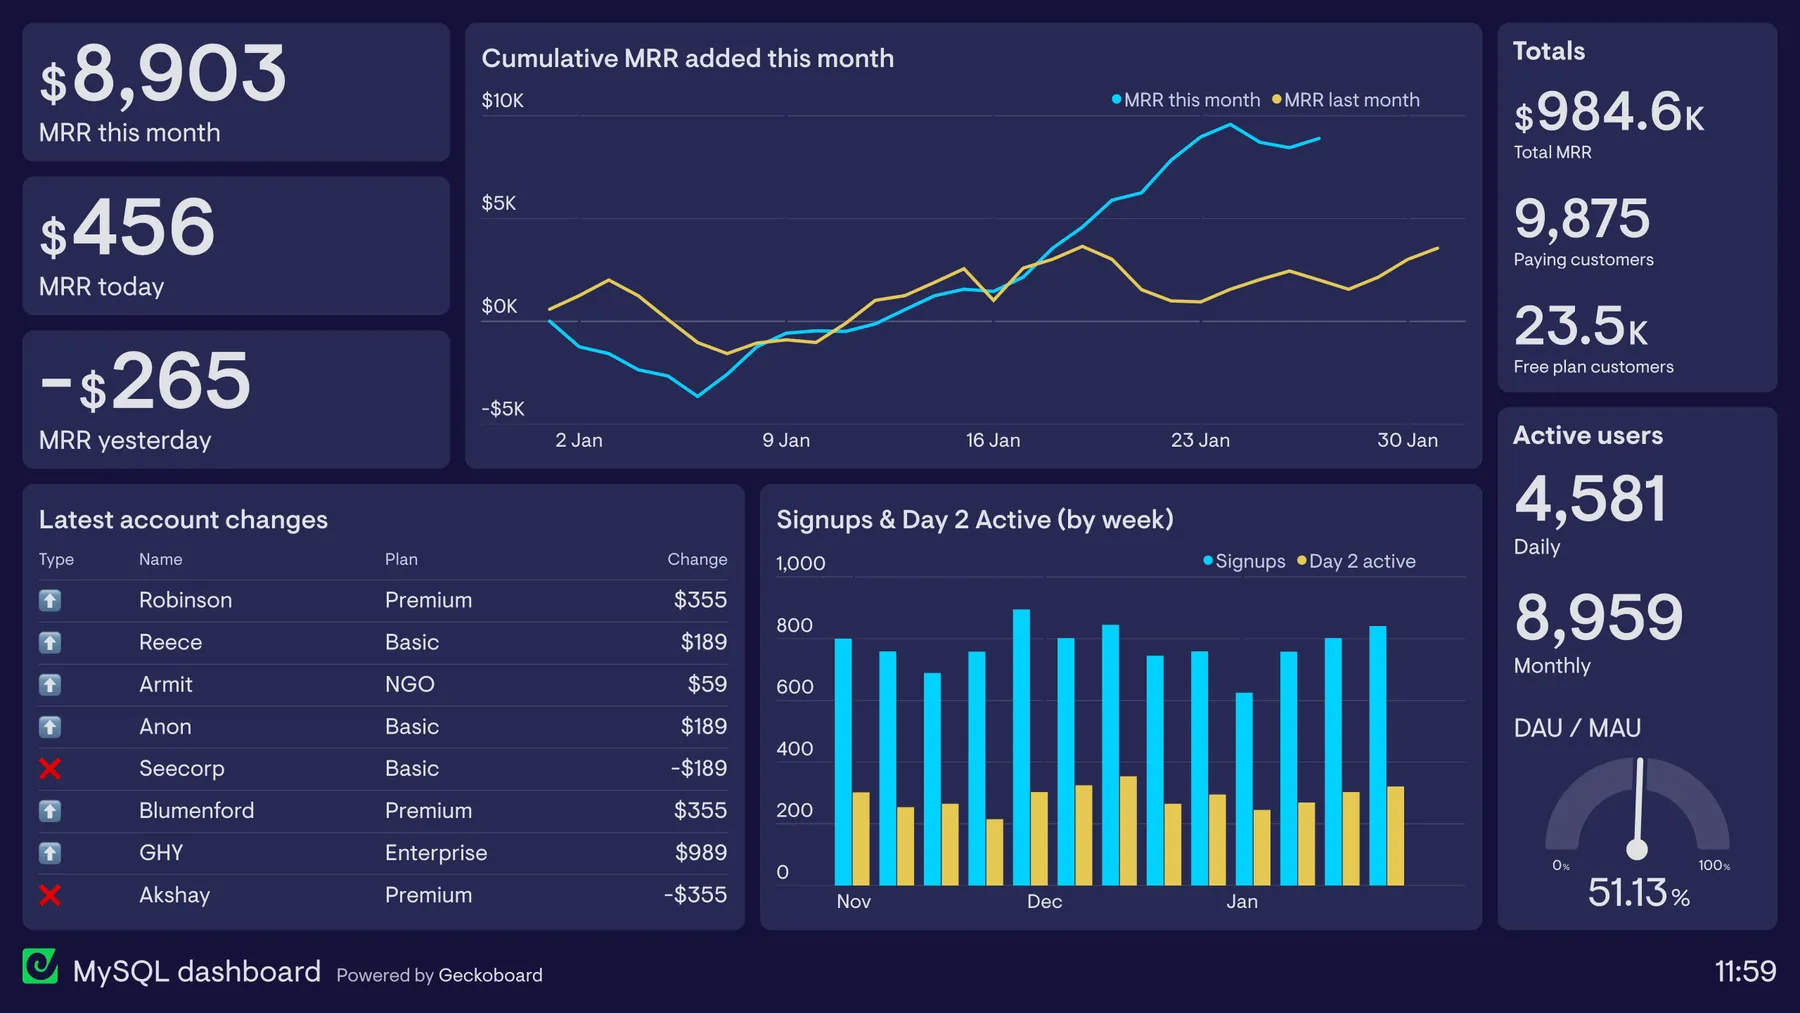
MySQL dashboard
With a dashboard tool like Geckoboard, you can use SQL to select and visualize metrics and KPIs from databases like MySQL, Amazon Redshift and MariaDB, and display them in one place on a live dashboard. A single dashboard can display metrics from multiple databases, and even display metrics from other data sources like Google Analytics, Salesforce and Shopify.
SQL dashboards are used by many different teams, across many different industries, to display key metrics so the entire team stays on the same page. The only barrier to creating an SQL dashboard is that you must be able to write Structured Query Language (SQL) to query data held in a database. For those who can write SQL, creating a live dashboard with Geckoboard is a simple, straightforward process.
This dashboard has been created with data from a MySQL database, alongside data from Mixpanel and Google Sheets. It’s been designed by a member of the company leadership team to keep the organization informed about the company’s growth and financial performance. Primarily the dashboard focuses on Monthly Recurring Revenue (MRR), including how much MRR has changed recently and which account changes have driven it. The dashboard also includes non-financial health metrics associated with company growth, including new signups and daily active users as a proportion of monthly active users.
PostgreSQL dashboard
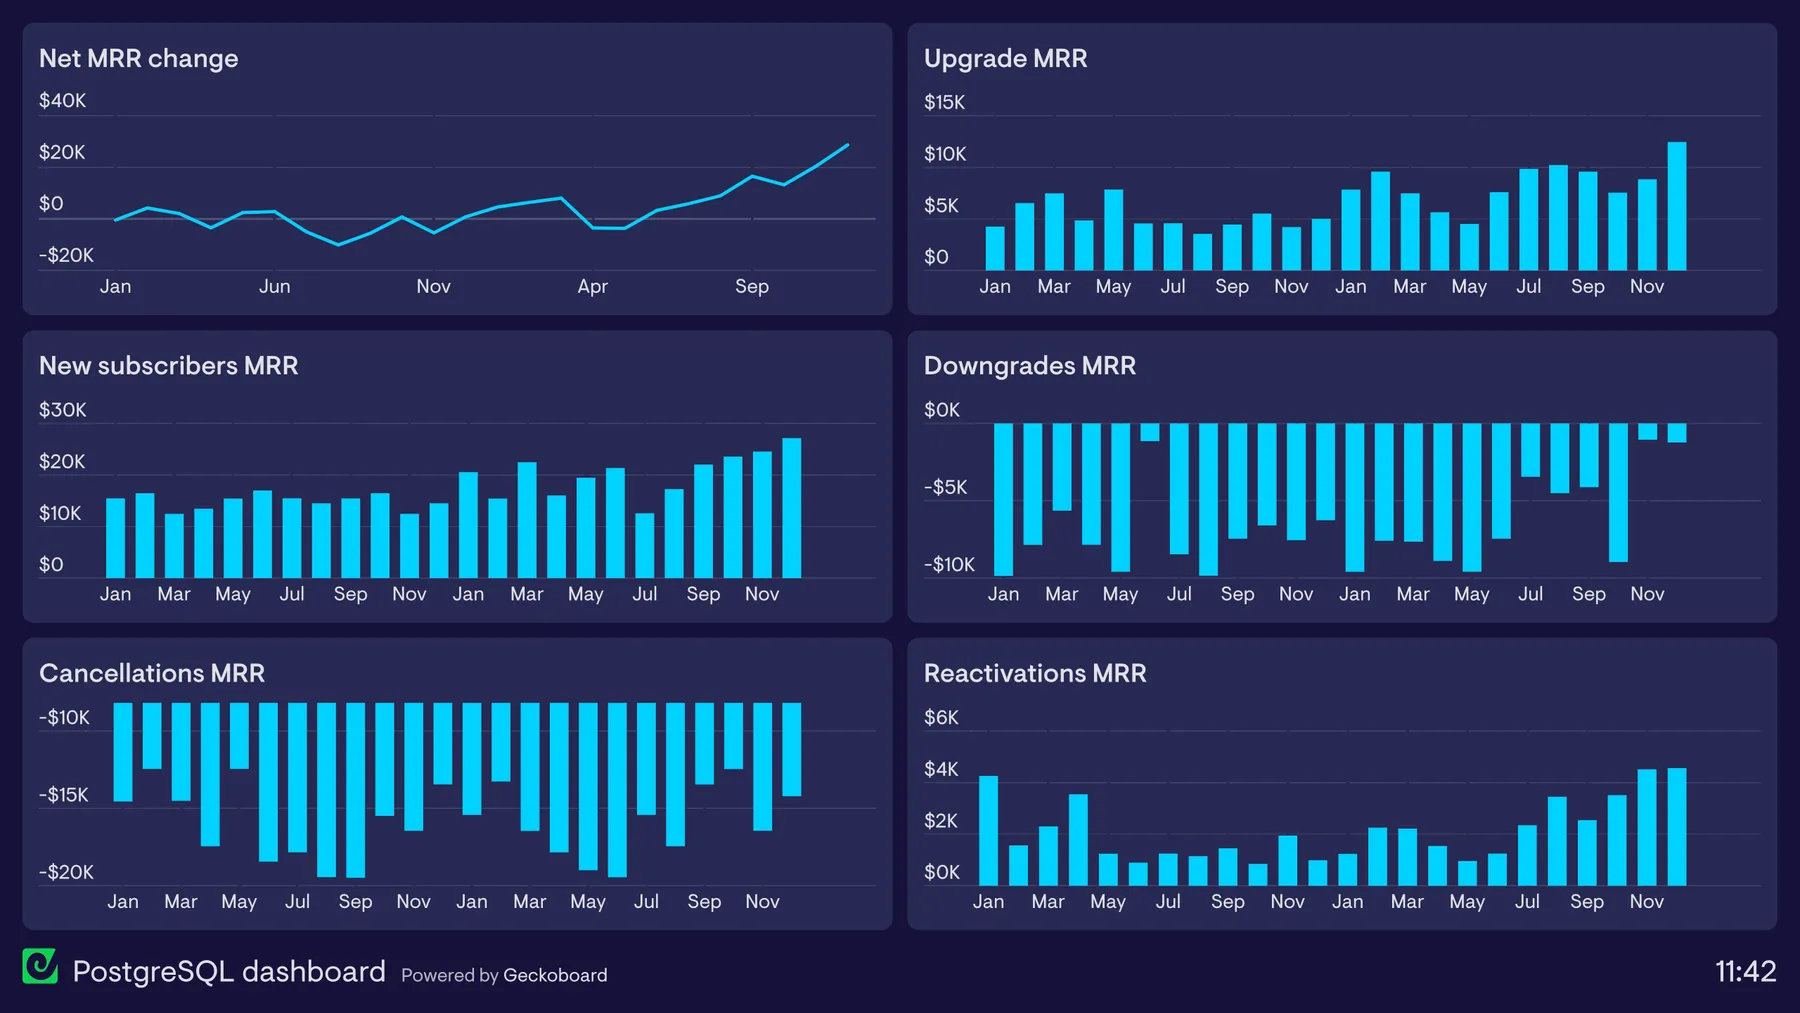
This dashboard has been built with financial data from PostgreSQL, though it could easily be built in the same way with data from Amazon Redshift, Snowflake or MariaDB. It’s designed to provide a SaaS company with a long-term view of their financial performance. Primarily it tracks the net MRR change each month, showing whether the value of the subscription base is growing or shrinking. The dashboard also breaks this figure down into its constituent parts — MRR gained from new subscribers, upgrades and reactivations, as well as MRR lost from cancellations and downgrades.
Microsoft SQL Server dashboard
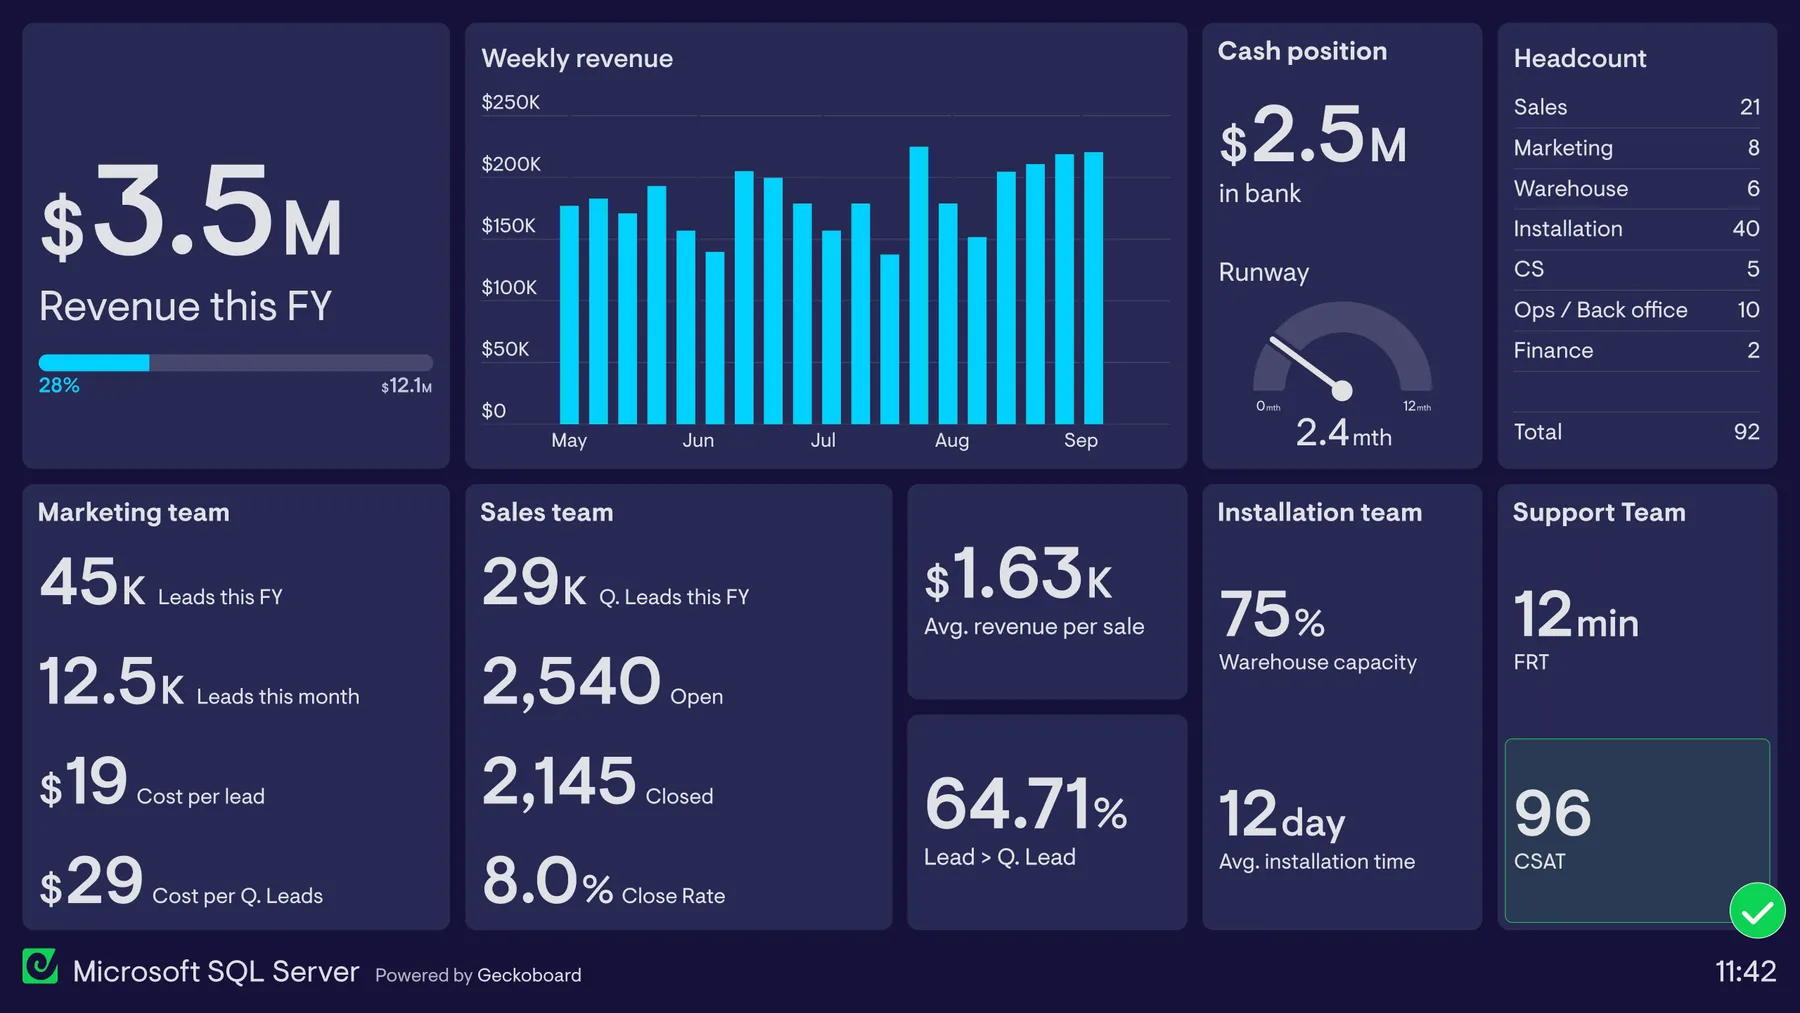
This dashboard is built with live data from Microsoft SQL Server and also incorporates data from Salesforce and Microsoft Excel. It’s designed to provide a view of entire organizational performance, including key metrics from the marketing, sales, installation and customer support teams. This helps not only the CEO understand how her organization is performing overall, but also helps individual team members understand how their performance contributes toward the bigger picture. Company dashboards like these can be a source of day-to-day motivation and common purpose.