Startup dashboard examples
With limited resources and a lot to prove, startups can't afford to track the wrong things. A startup dashboard forces the focus — a small set of metrics that actually show whether the business is growing, visible to the whole team.
Early-stage SaaS startup dashboard
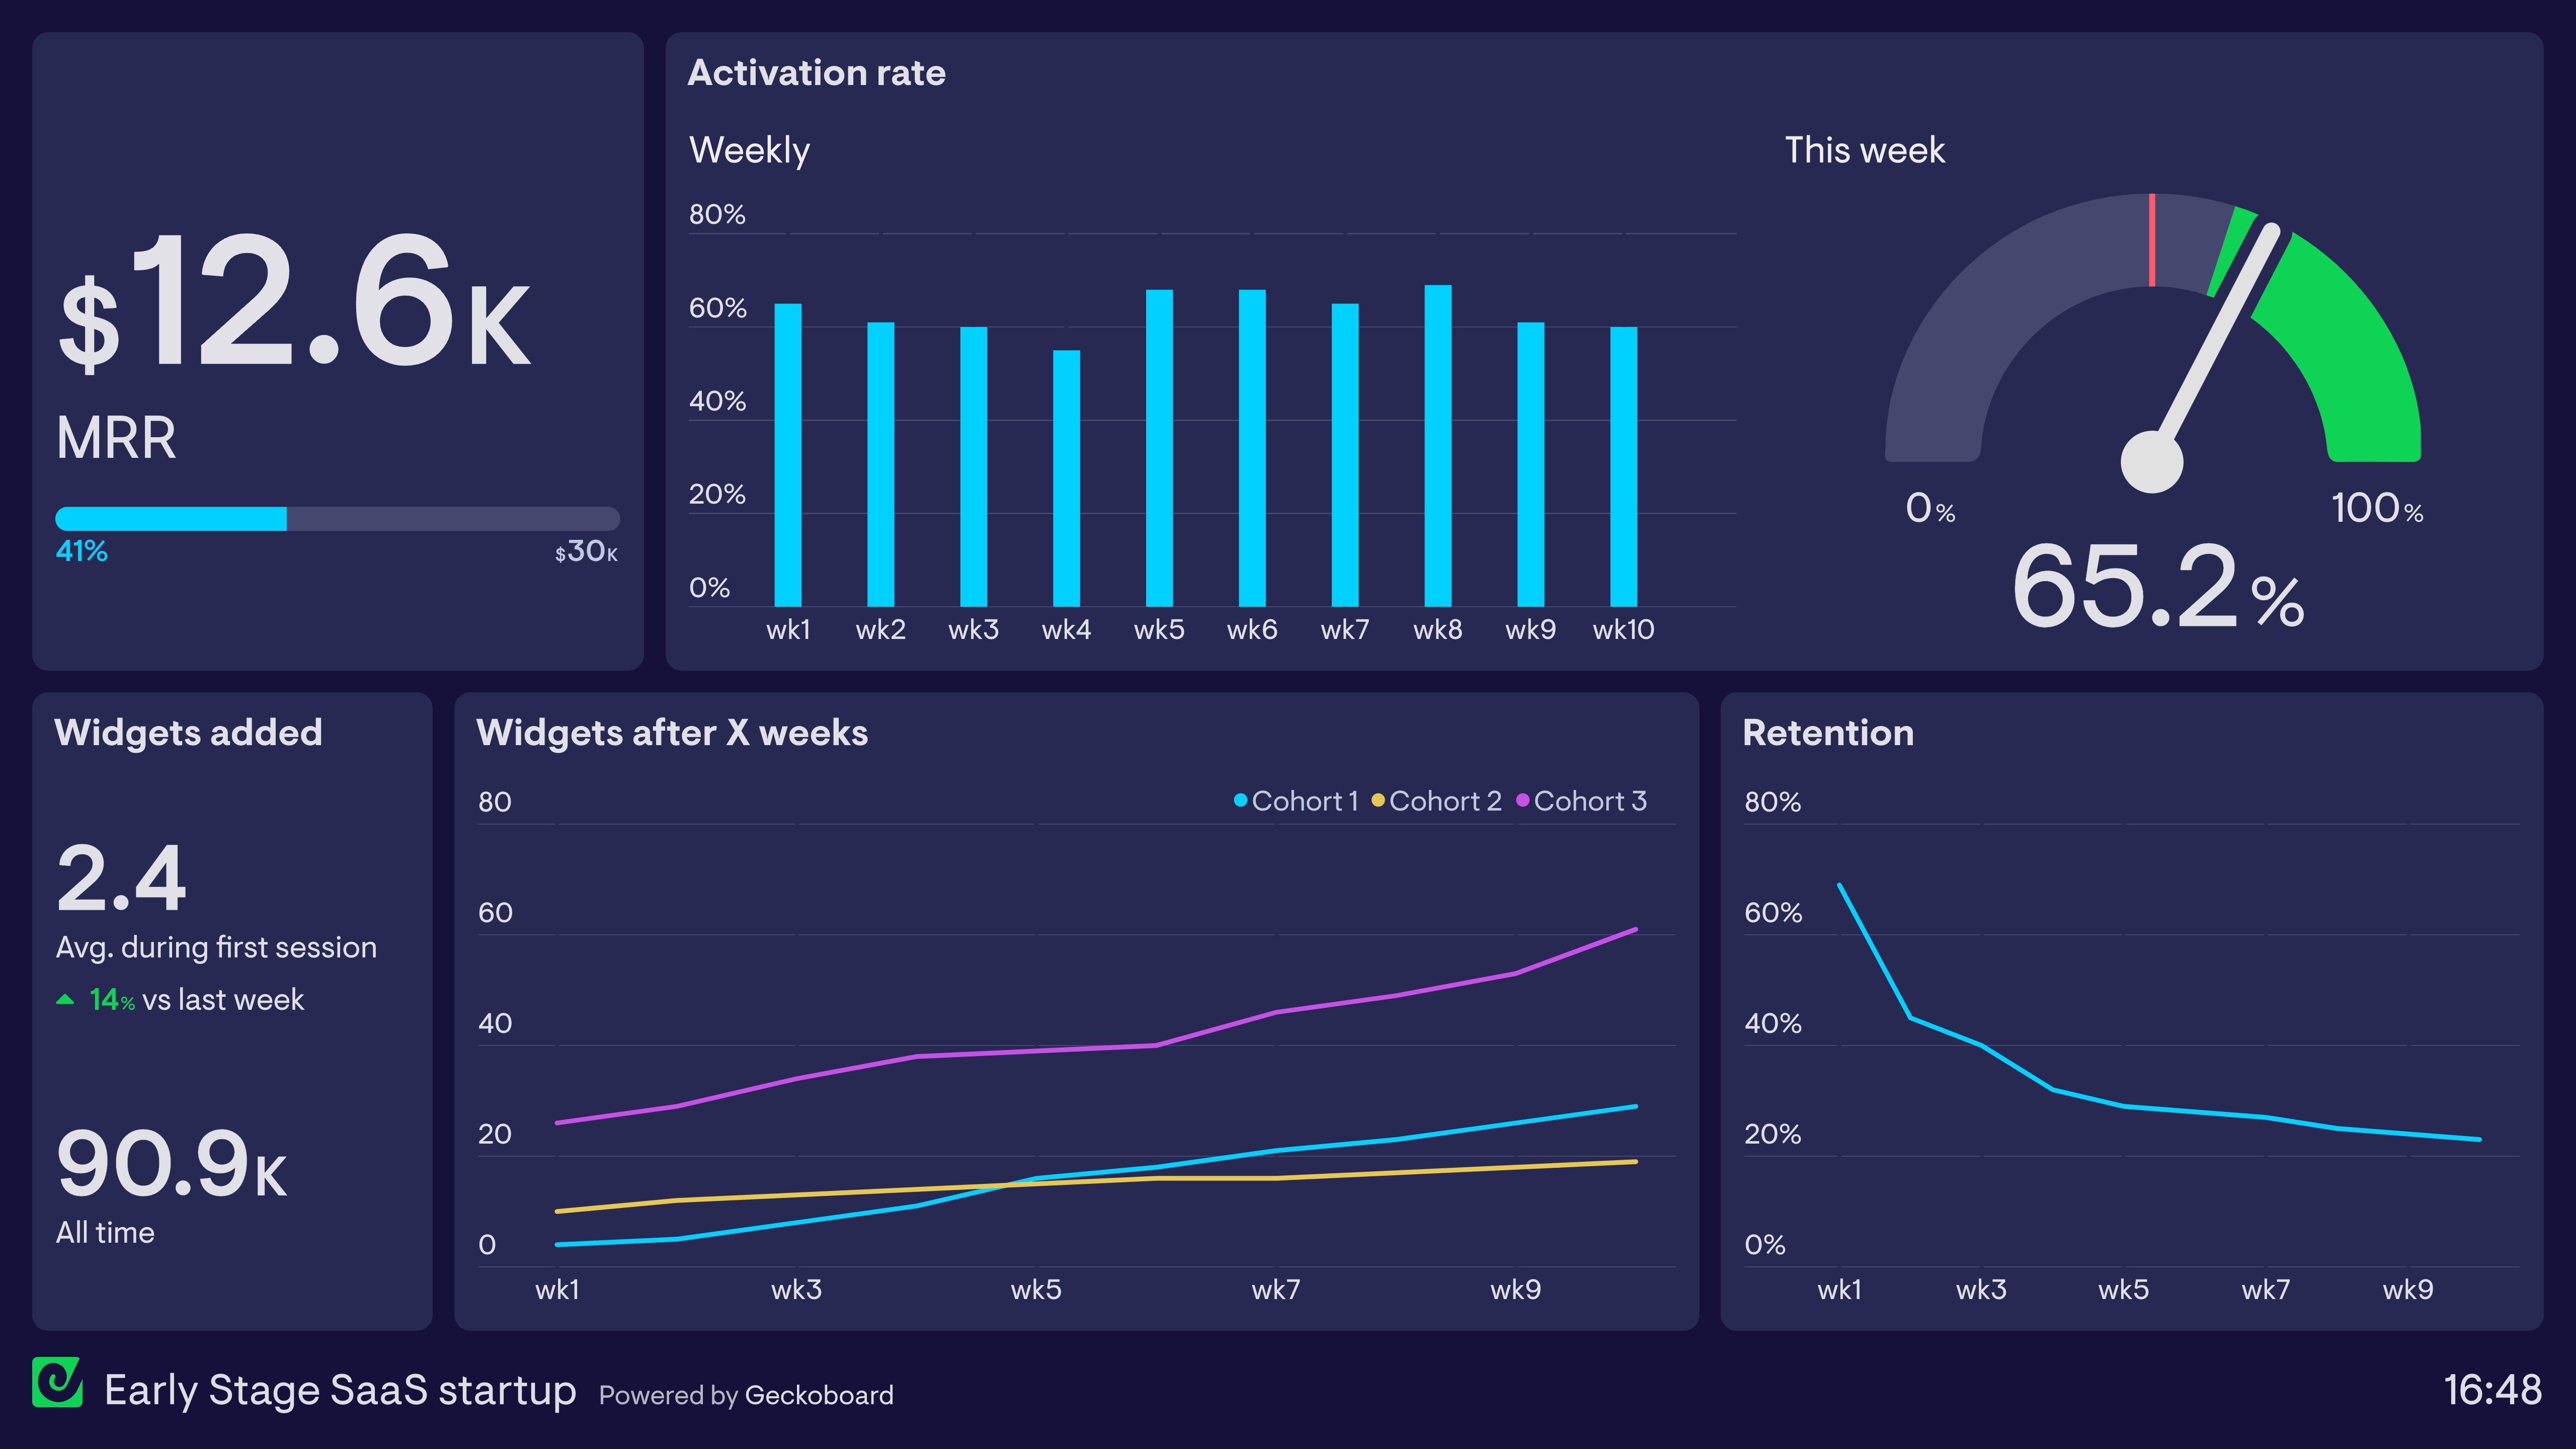
This dashboard is used by an early-stage SaaS company. It’s there to focus everyone’s efforts on what’s most valuable to the business, early on.
For many new businesses, it can be tricky to choose metrics at this early stage, as they are unlikely to have many active customers generating lots of data. Qualitative data from conversations with users and potential users takes priority – listening to feedback and understanding their niggles helps to refine the product.
However, the problem is that this qualitative data can often produce a long list of areas to focus on, not all of which are equally important. This is where quantitative data and KPIs can help. By deciding on the changes they want to see, tracking a select number of KPIs helps the team stay focused on creating maximum value for their business and their customers.
By asking the question: “what do we most need to influence?”, this startup has settled on revenue (MRR), product usage and retention. Essentially, they want to know, out of the people who are using the product, how much are they using it?
They know that, simply, if they develop the product so that customers want to use it more, they will improve retention, and eventually improve revenue, as more people learn about their fantastic new product. The dashboard keeps them focused on this aim.
Browse other popular examples
A startup dashboard gives early-stage founders and leadership teams a single view of the metrics that matter most for a growing SaaS business — revenue, growth, product engagement, and churn. It's designed to be quick to set up and focused on the KPIs that determine whether a startup is on a healthy trajectory.
Geckoboard is a live dashboard tool used by startups to track the metrics that show whether the business is growing. It connects to billing tools, product analytics, and databases to give founders and early teams a clear, current view of performance — without the manual reporting overhead.
Core metrics include MRR, new MRR, churned MRR, MRR growth rate, daily and monthly active users, trial-to-paid conversion rate, and cash runway. Early-stage SaaS startups focus on the metrics that signal product-market fit and sustainable growth.
Building a custom startup dashboard is straightforward with Geckoboard's dashboard builder. Connect Baremetrics, Stripe, and Mixpanel to pull subscription revenue and product engagement data into one view, then pick your metrics and build the view you need. Share with your team as a TV dashboard, shared link, or scheduled snapshot. Start a free trial or learn more about how Geckoboard works.
Use it to bring data together from billing, product, and analytics tools into one place the whole founding team checks every day. It also helps deliver executive visibility for investor updates — giving a clear, current snapshot of growth metrics without compiling a deck from multiple data sources.