SaaS company dashboard examples
A SaaS company dashboard tracks the metrics that matter most to a SaaS business's health — MRR, churn, growth rate, customer counts, and cash — in one view for leadership and investors. It gives a fast read on whether the business is on track across the dimensions that matter.
SaaS daily snapshot dashboard
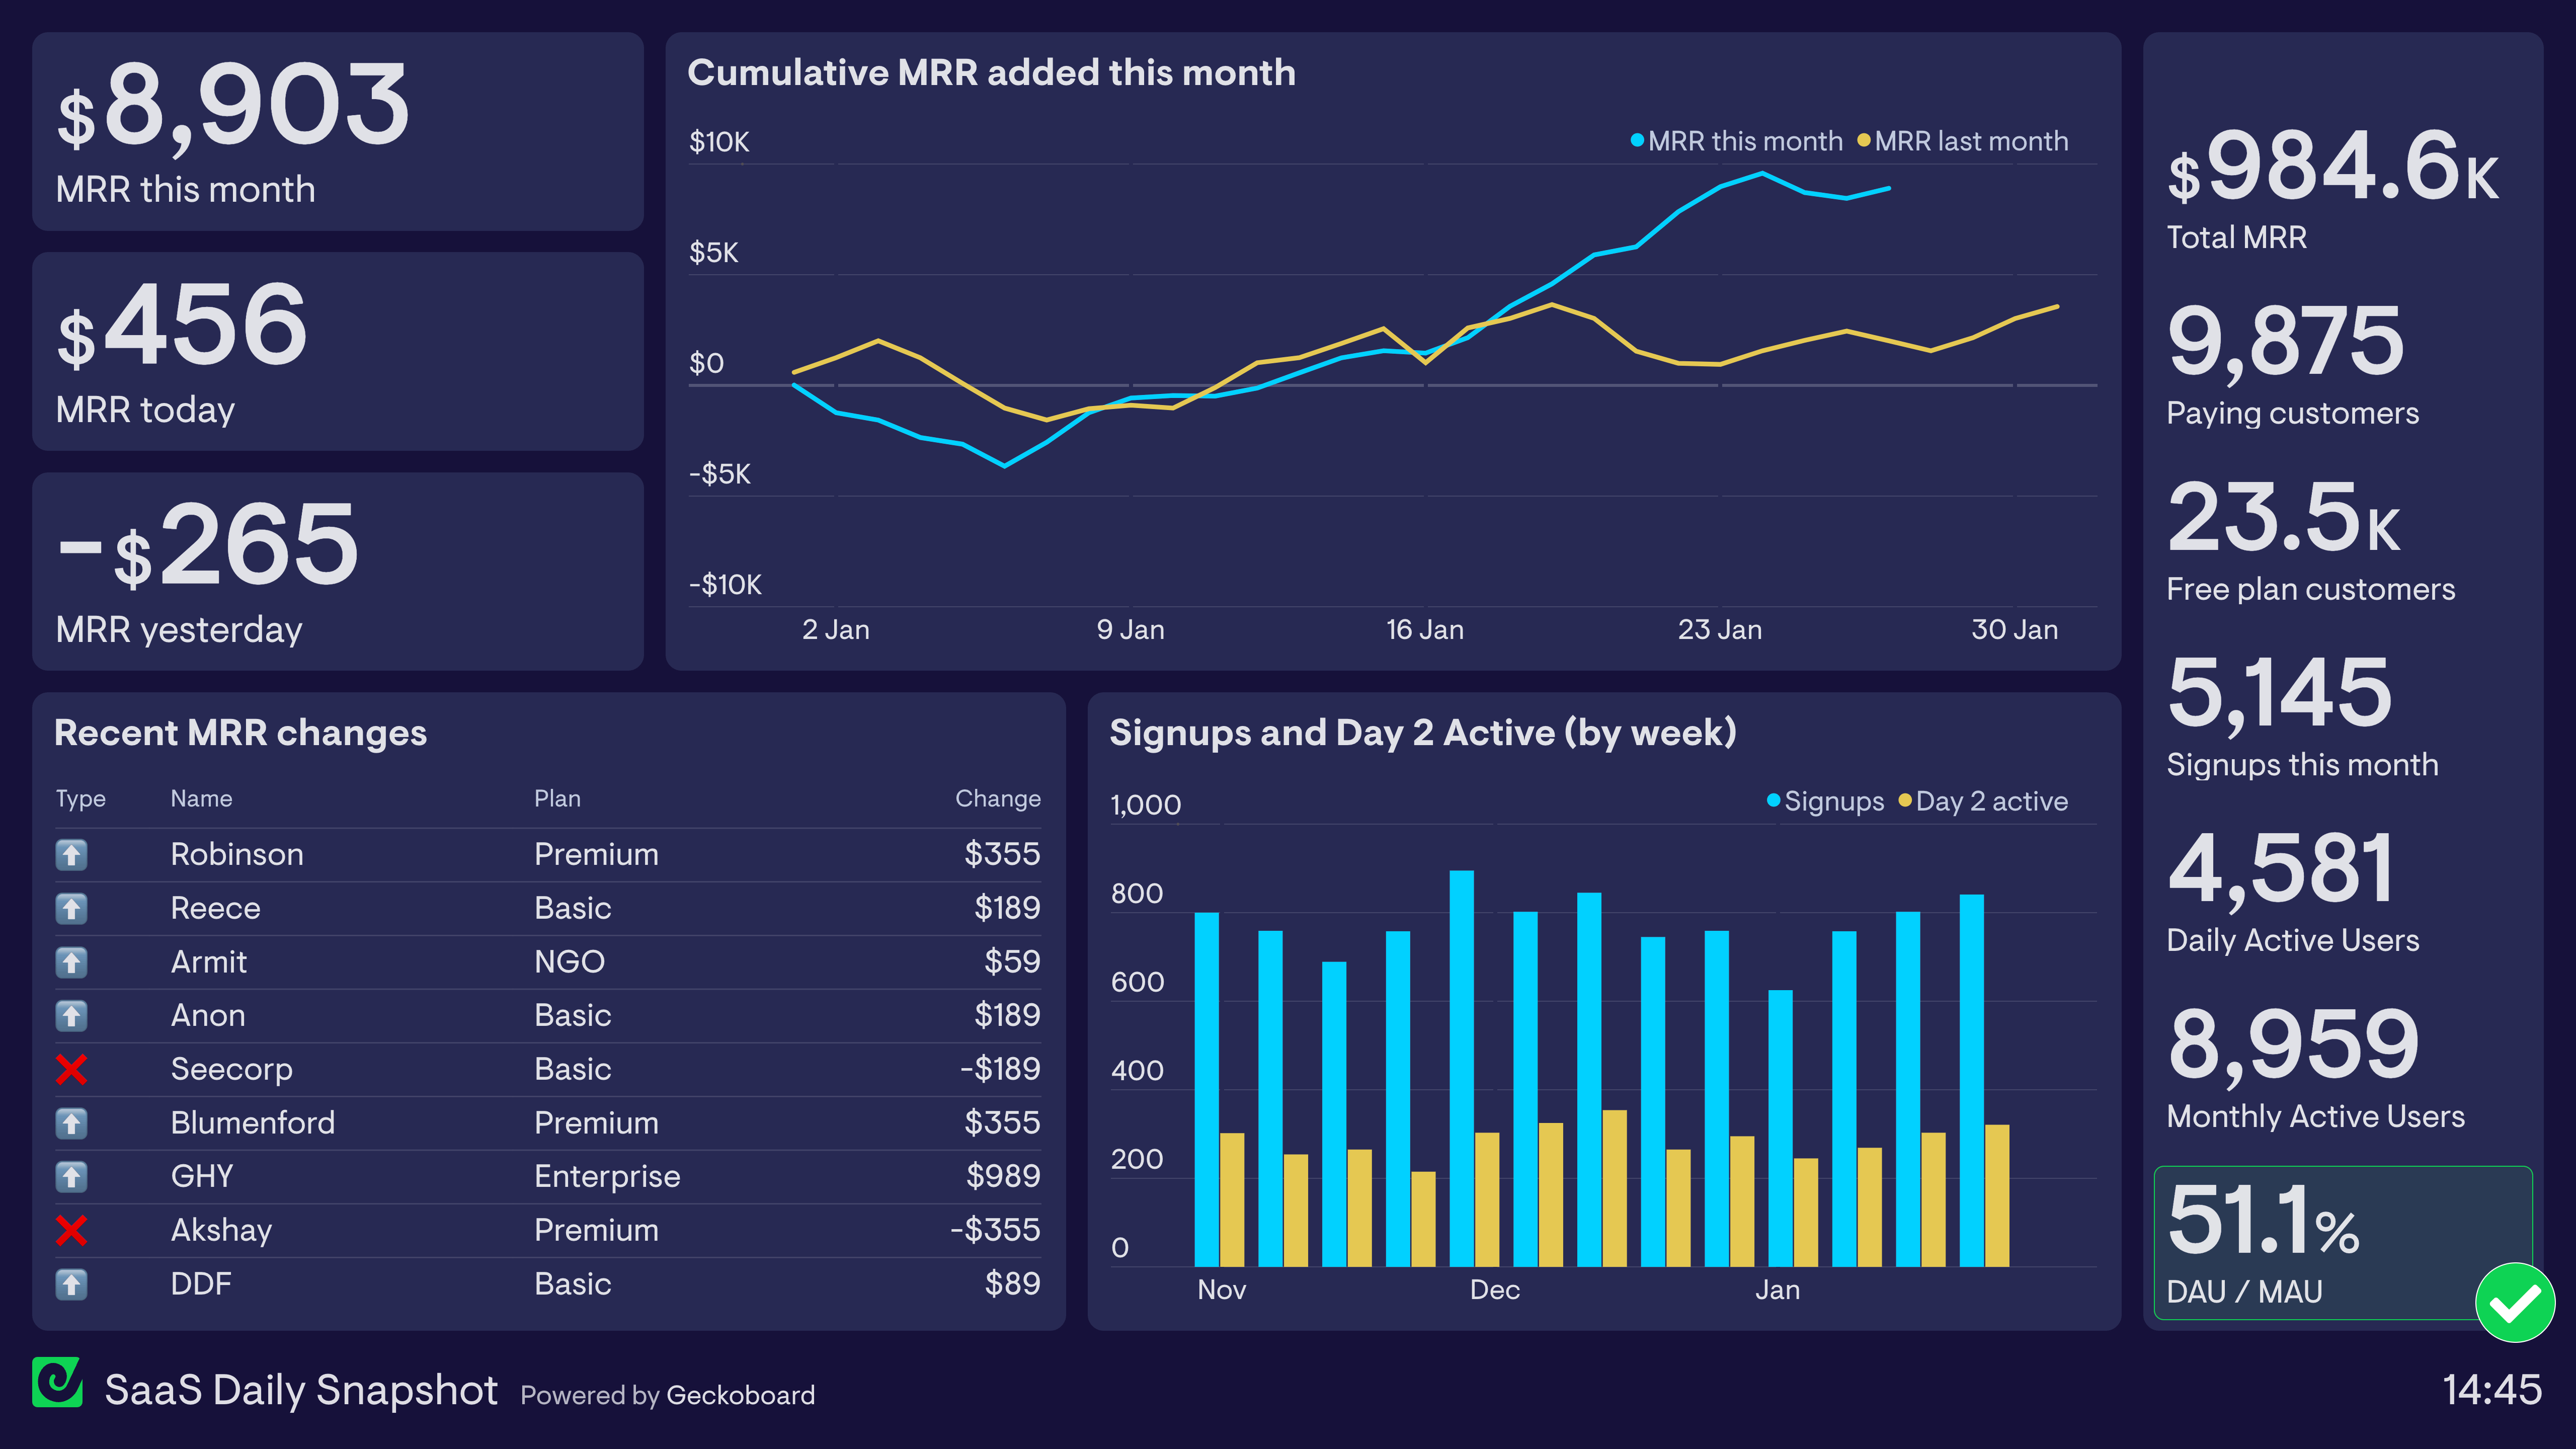
This SaaS dashboard is designed to give all employees a high-level overview of company performance, each day.
Chiefly, this dashboard focuses on MRR (Monthly Recurring Revenue). We can clearly see the amount of new MRR this month, as well as the overall MRR figure. Furthermore we can see more recent MRR changes. Even though you should expect natural variance in your MRR in the short term, these metrics are helpful because sometimes, sudden changes in MRR require further investigation (for example: a big customer churns, a payment page breaks, or there is a fault in ppc advertising.)
The other main focus of this dashboard is customers. Not only does this dashboard track potential new customers who are taking part in the free trial (signups), it also tracks the number of these trialists who are still active on Day 2. This metric helps us to understand if these new trialists are as engaged as previous customers, therefore helping us to qualify their potential.
Finally, we can see that this dashboard is also tracking DAU / MAU Ratio (Daily Active Users / Monthly Active Users) in order to see how active current customers are. A drop in DAU/MAU would indicate that customers are using the product less frequently and may be more likely to churn.
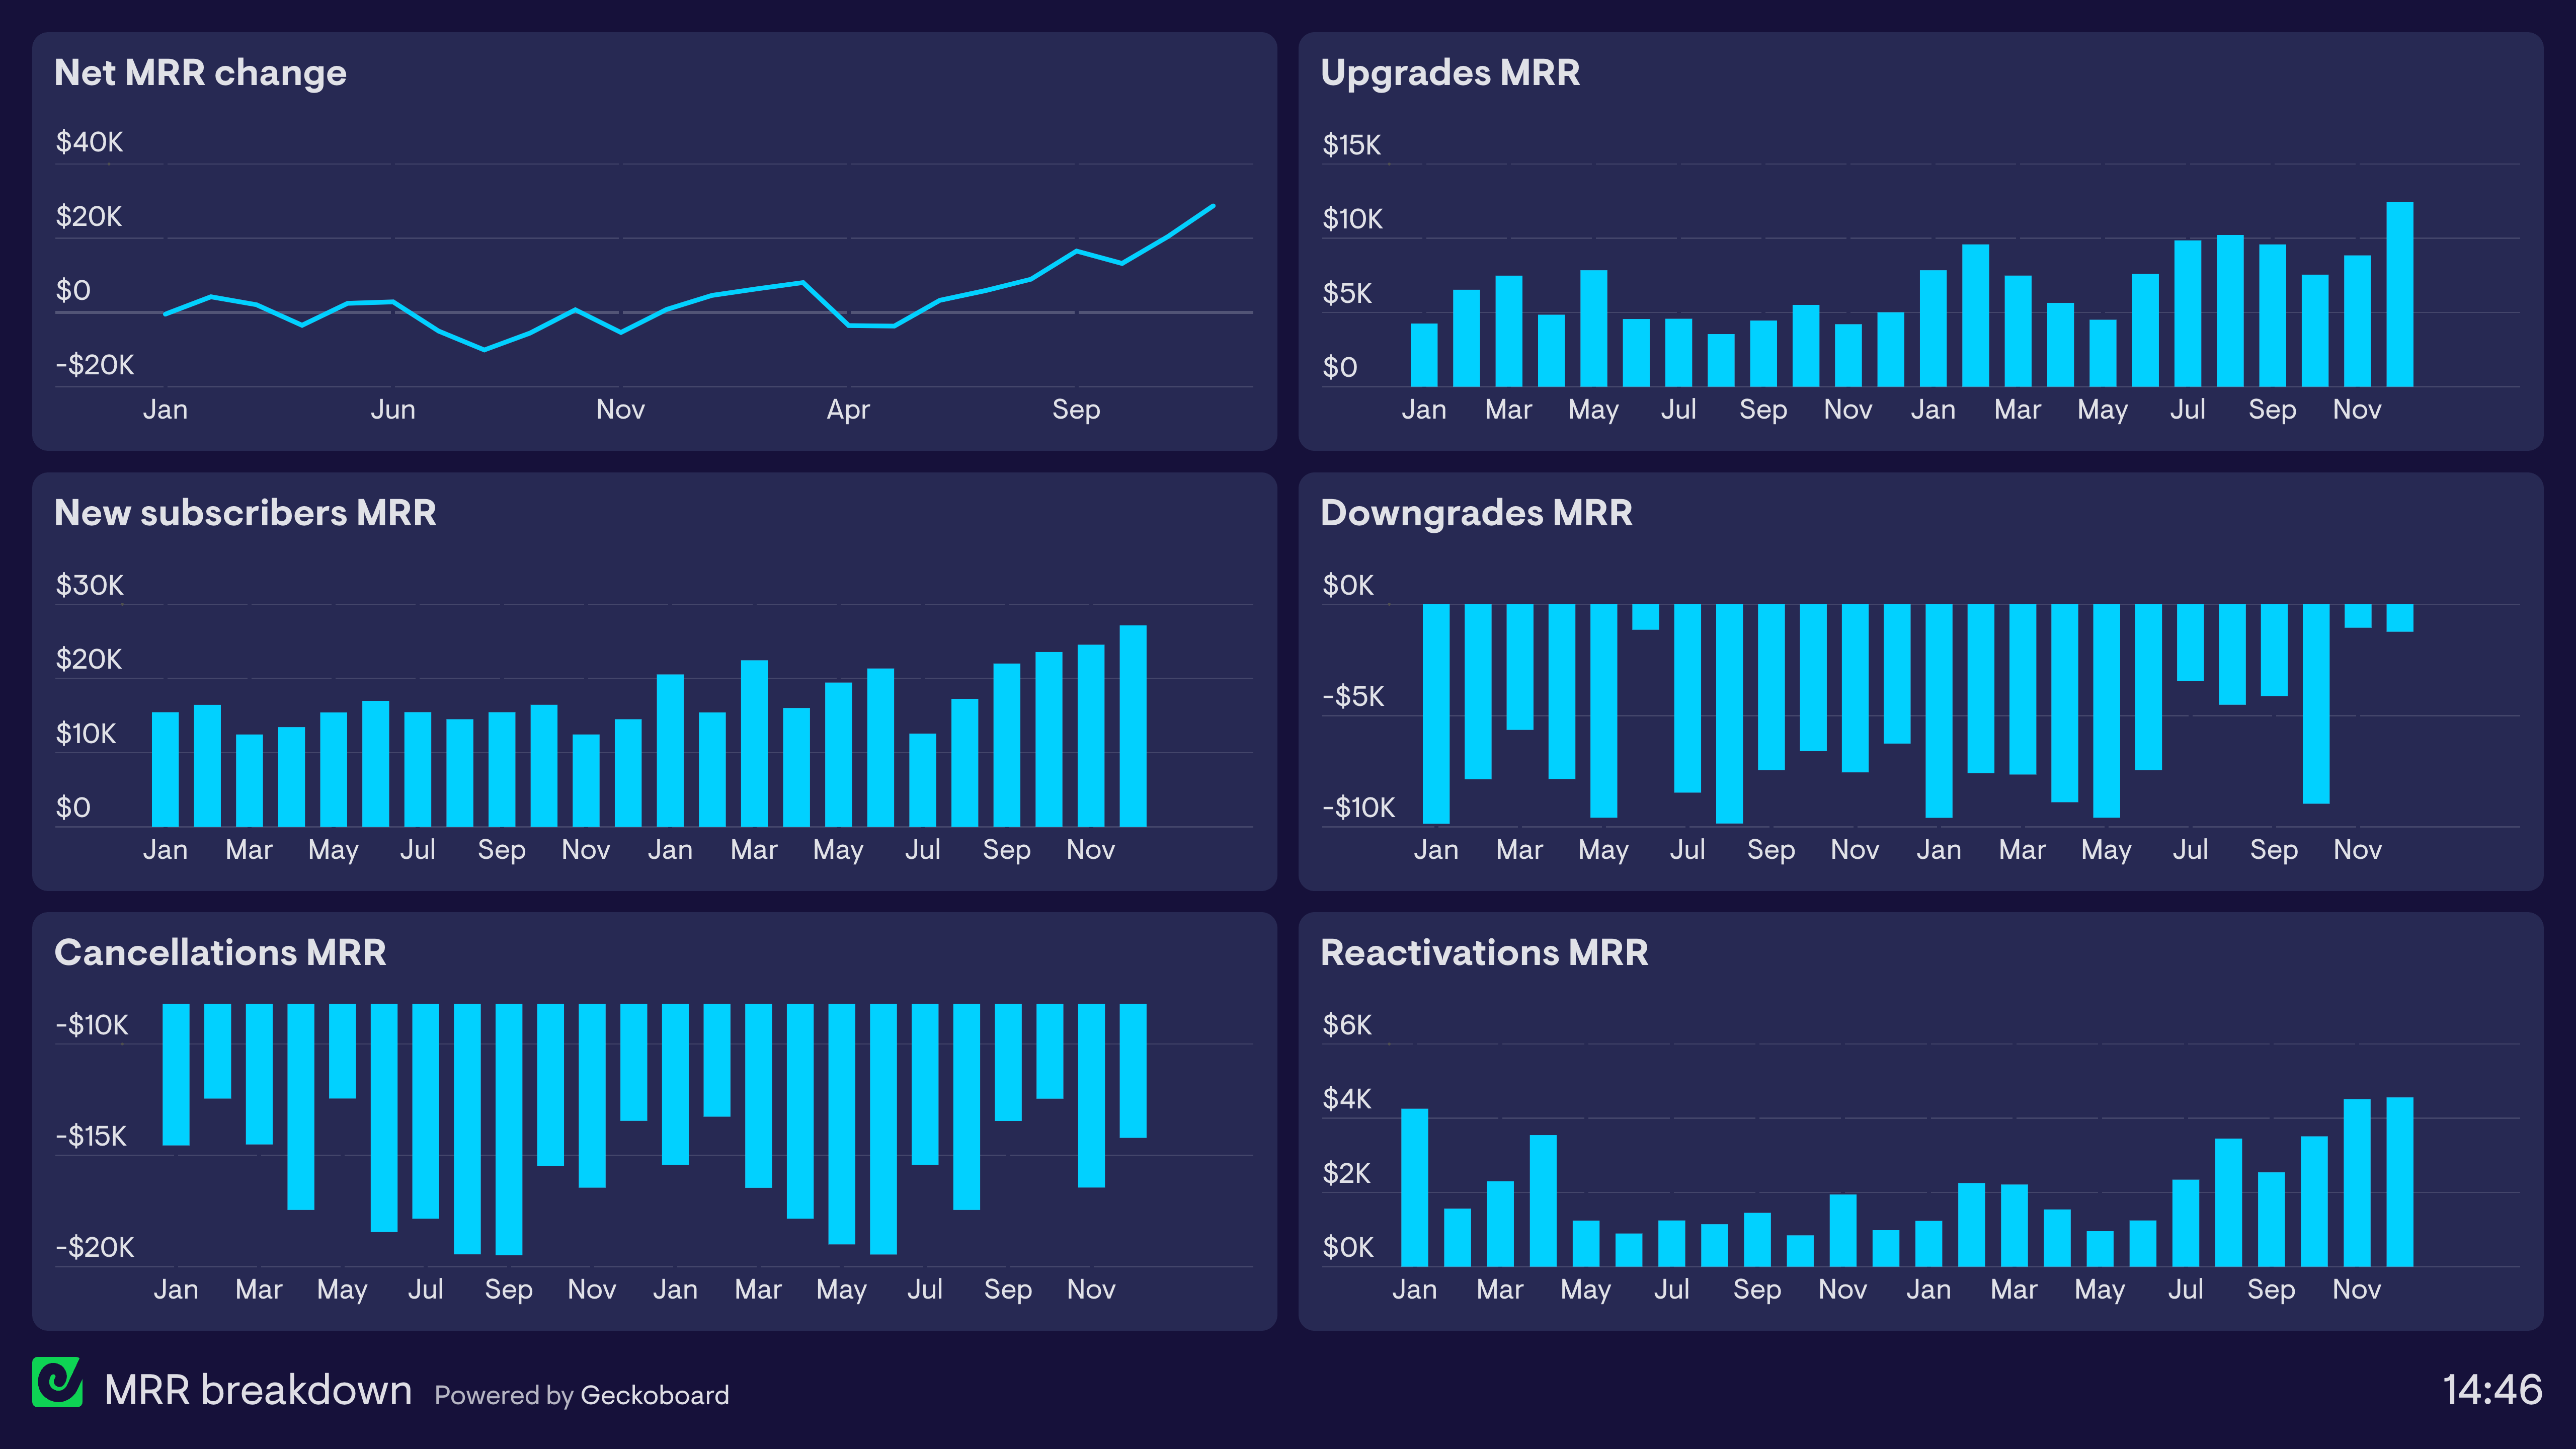
SaaS financial dashboard
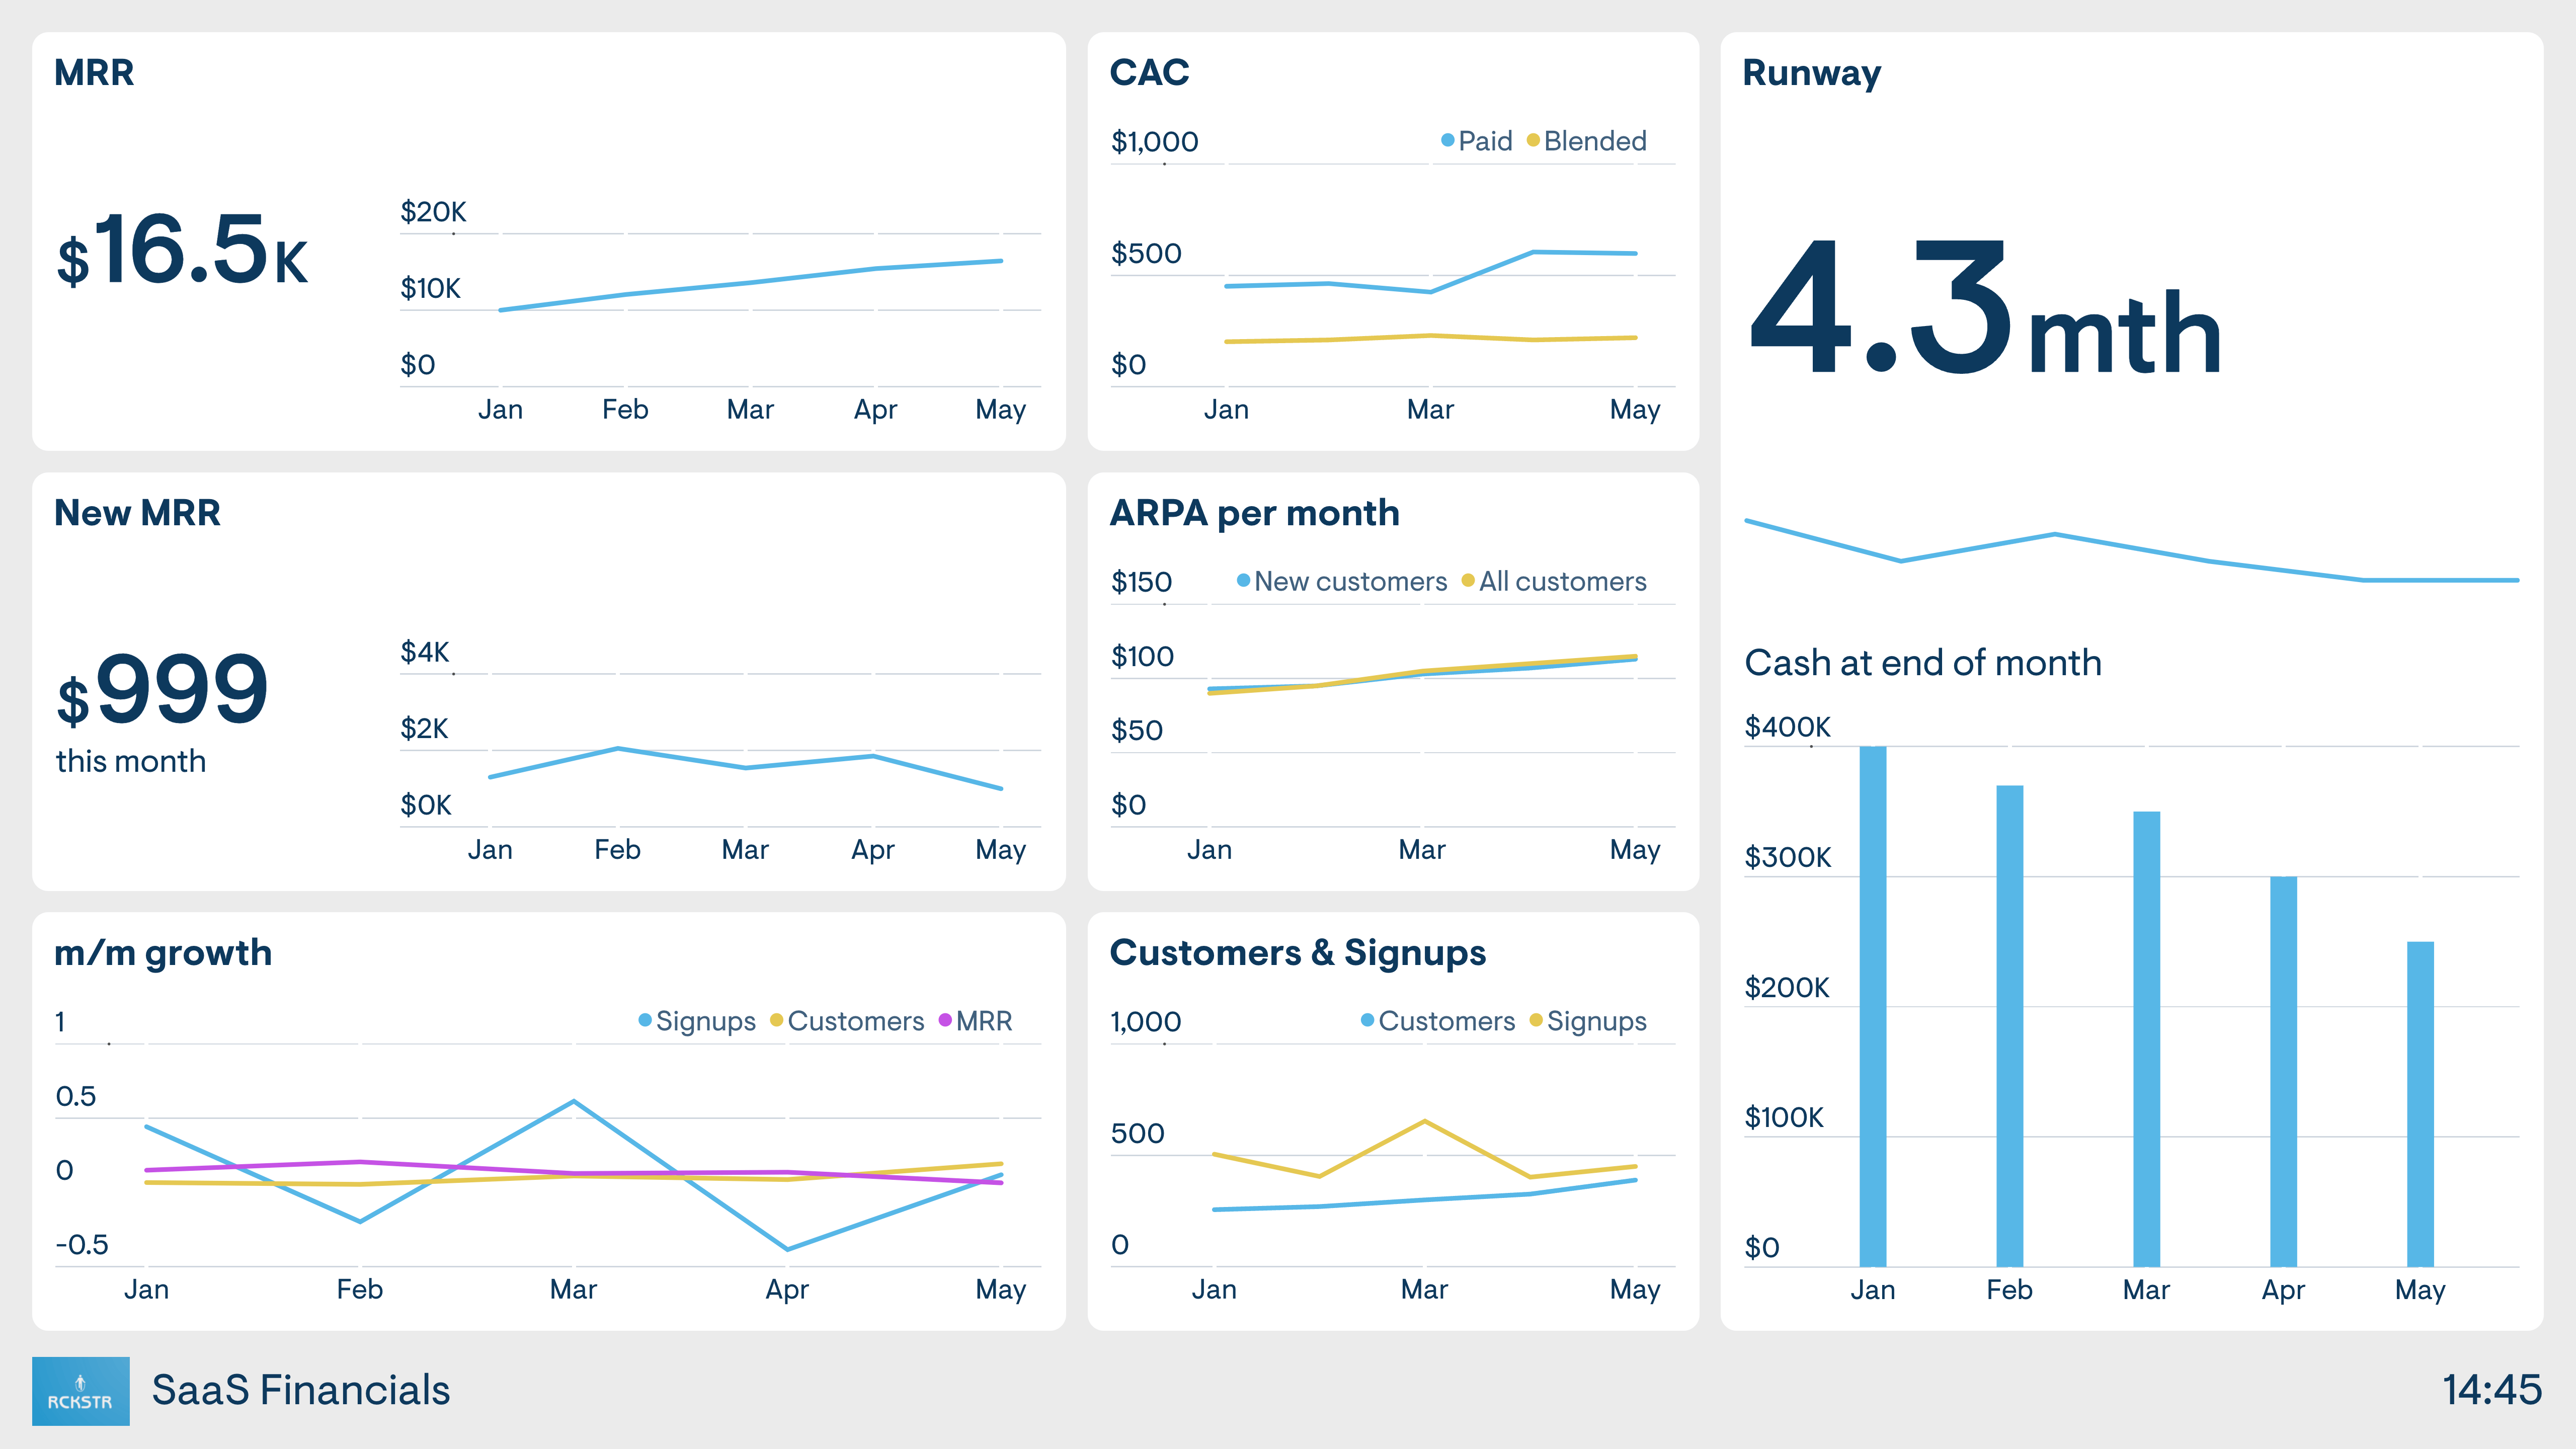
This dashboard focuses more exclusively on the SaaS company’s financial KPIs. As with the previous dashboard, this company’s main priority is MRR, which they are using to track the overall growth of the business.
However, this dashboard also tracks cash flow, which is not always in line with revenue figures. The Cash Runway is a health metric that shows how long a company can continue operating based on its current Burn Rate. Furthermore, this dashboard also tracks ARPA (Average Revenue per Account) and CAC (Customer Acquisition Cost).
A SaaS company dashboard gives founders, operators, and finance teams a daily snapshot of the metrics that define SaaS business health — revenue, growth, churn, and product engagement. It replaces scattered tool-checking with one always-current view of how the business is performing.
Geckoboard is a live dashboard tool built for SaaS teams that need a clear view of financial health, growth, and customer metrics in one place. It connects to billing platforms, product analytics, and databases — keeping the metrics that matter to SaaS leadership always current and visible.
Key metrics include MRR, churn rate, LTV, CAC, DAU/MAU ratio, trial conversions, and cash position. Daily snapshots surface any significant overnight changes so teams can act before small issues compound.
Building a custom SaaS company dashboard is straightforward with Geckoboard's dashboard builder. Connect Baremetrics, Stripe, Mixpanel, and SQL databases and custom data sources to bring billing, product, and custom data together, then pick your metrics and build the view you need. Share with your team as a TV dashboard, shared link, or scheduled snapshot. Start a free trial or learn more about how Geckoboard works.
Use it to bring data together from billing, product analytics, and CRM into one daily view of the business. It also helps deliver executive visibility — giving founders and investors a current picture of growth, retention, and product engagement without a manual reporting cycle.