Company dashboard examples
A company dashboard brings the metrics that represent the business's priorities into one view the whole organisation can see — on a screen in the office, as a shared link, or both. When everyone is working from the same picture of performance, it's easier to stay aligned on what matters.
Daily pulse dashboard
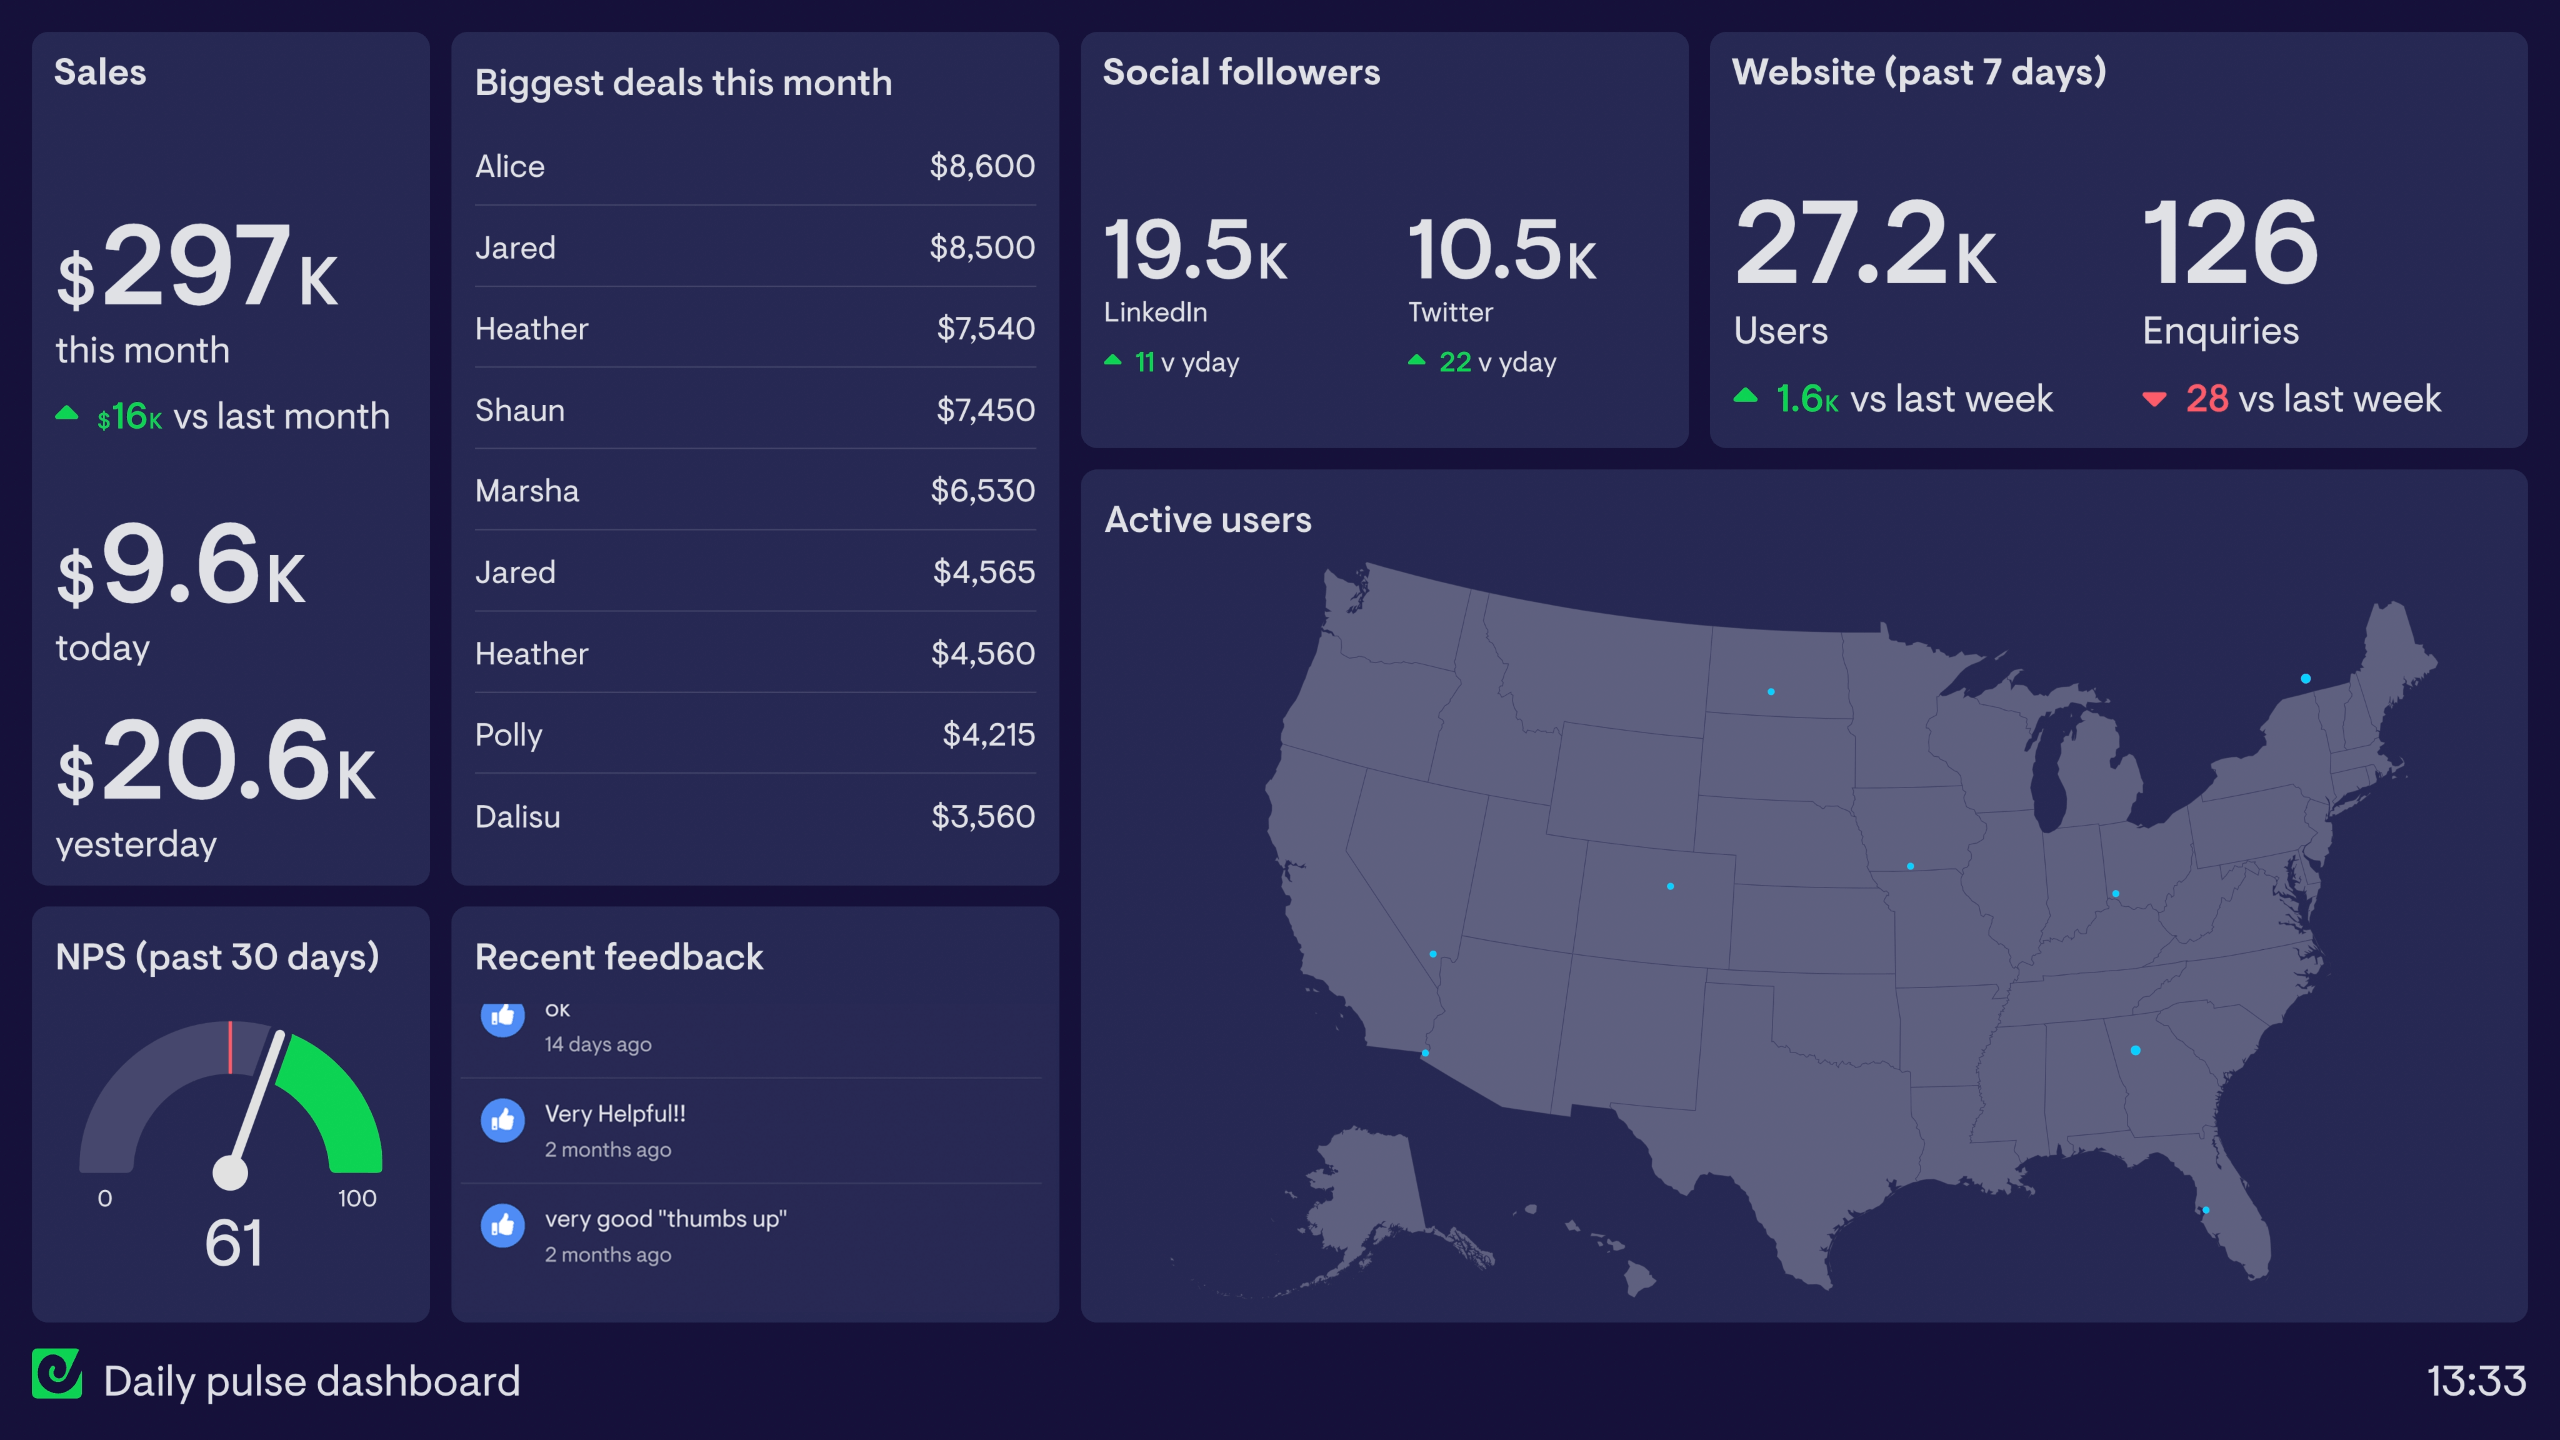
This daily pulse dashboard is designed to be placed in a prominent part of the office where everyone can see it. Remote workers are also sent a daily snapshot of this dashboard via Slack, Microsoft Teams and/or email. It focuses the company's attention on important developments in sales and customer satisfaction.
In addition, many elements of this dashboard are designed with the watercooler effect in mind. In other words, it’s a conversation starter. This includes recent social media mentions and customer feedback. The ‘biggest deals’ leaderboard is also a nice way of recognizing great performance, and encouraging friendly competition.
Vision dashboard
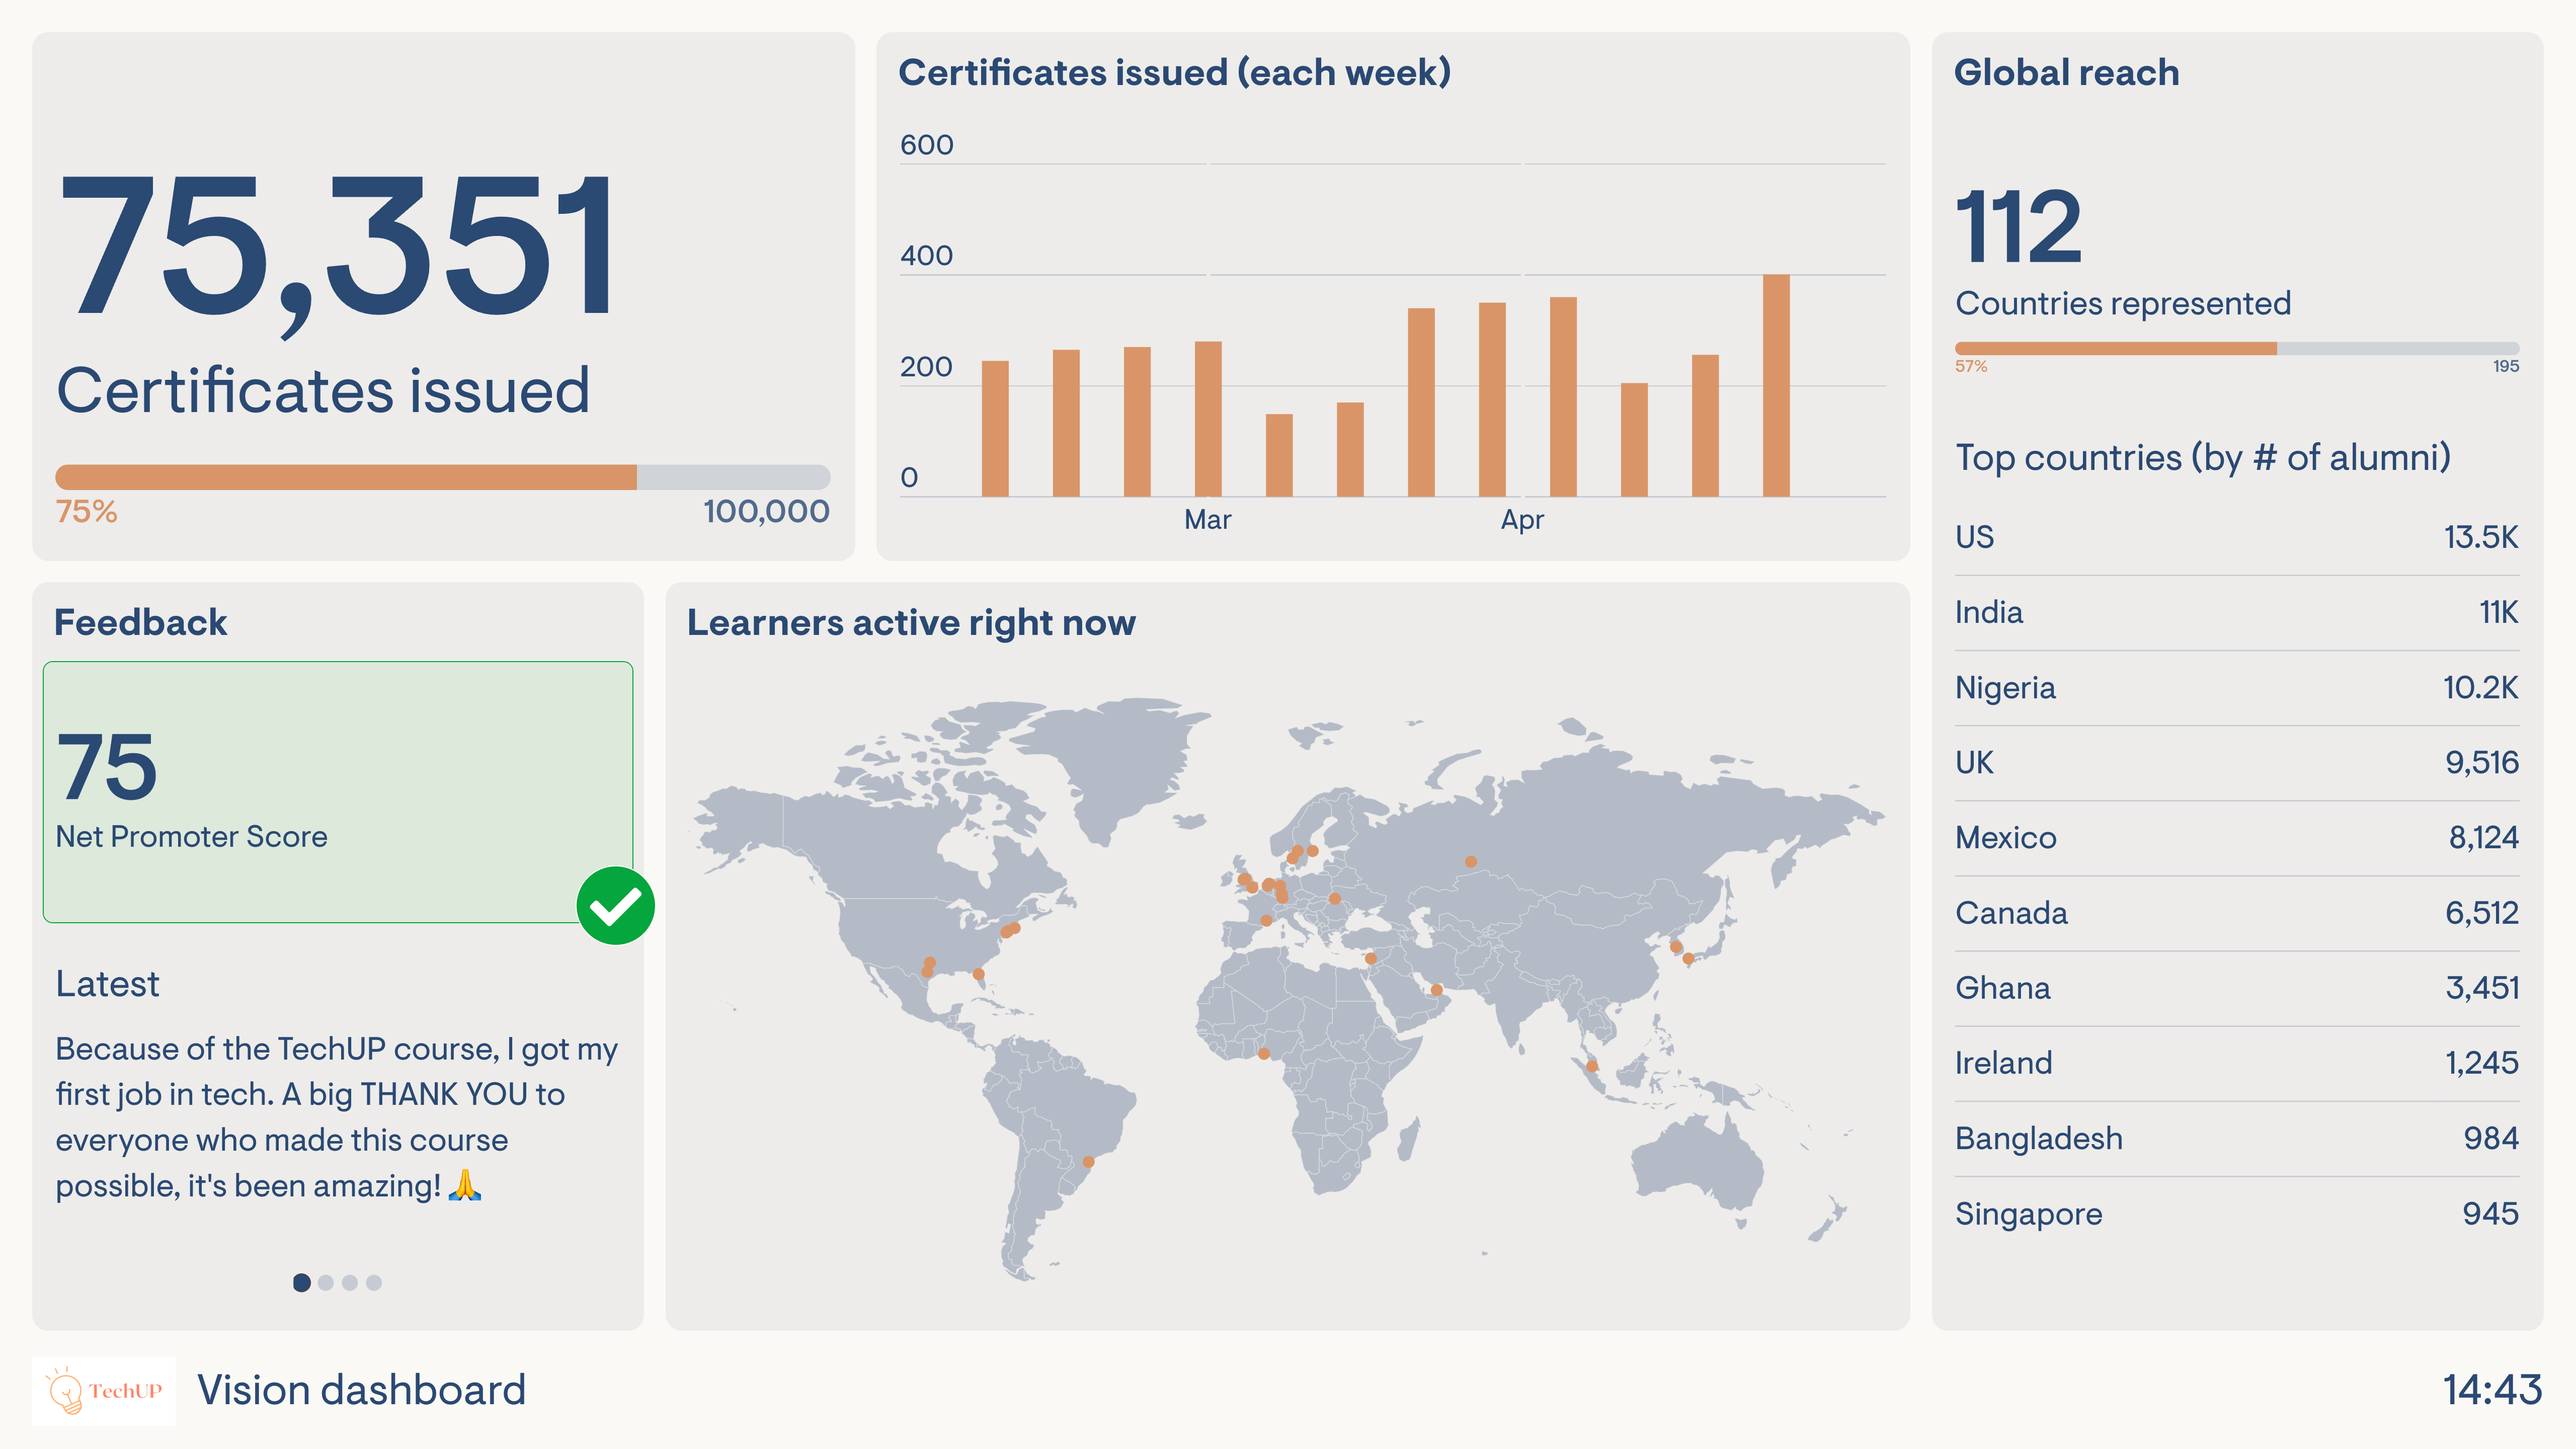
This dashboard is used by an EdTech company whose mission is to train as many young people as possible, via their online course. It goes to show that not all company KPIs need to be financial. This dashboard focuses on the number of certificates issued (the goal is to achieve 100,000) and their global reach (the goal is create alumni representing every country of the world).
By aligning their dashboard with the company mission and purpose, it creates a motivational effect. It’s a constant reminder of why team members do what they do, regardless of which team they’re in. This is further helped by the stream of recent customer feedback.
A company dashboard gives everyone in the business — from frontline staff to leadership — a shared view of the most important performance metrics across departments. Teams use it to align around common goals, make progress visible, and create a culture where data drives daily decisions.
Geckoboard is a dashboard tool built to keep performance visible across an entire organisation. Dashboards connect to the tools your business runs on and display live metrics on office screens, shared links, or automated snapshots — so everyone stays aligned without needing to ask for updates.
Common metrics span revenue, new customers, churn, website traffic, social engagement, and support ticket volume. A "daily pulse" dashboard focuses on the metrics that change every day and tell the team how the business is performing right now.
Building a custom company dashboard is straightforward with Geckoboard's dashboard builder. Connect Salesforce, Google Analytics, Zendesk Support, and spreadsheets to surface data from across the business, then pick your metrics and build the view you need. Share with your team as a TV dashboard, shared link, or scheduled snapshot. Start a free trial or learn more about how Geckoboard works.
Use it to make team performance visible by displaying live company metrics on a shared screen everyone can see. It also helps bring data together from sales, marketing, support, and finance into a single view that aligns the whole organisation.