Cash flow dashboard examples
A cash flow dashboard tracks a company's actual spending power, not just revenue. Because the timing of income and outgoings can look very different from the revenue picture, finance teams use it to stay on top of what's actually in the bank — and what's coming.
Cash flow dashboard
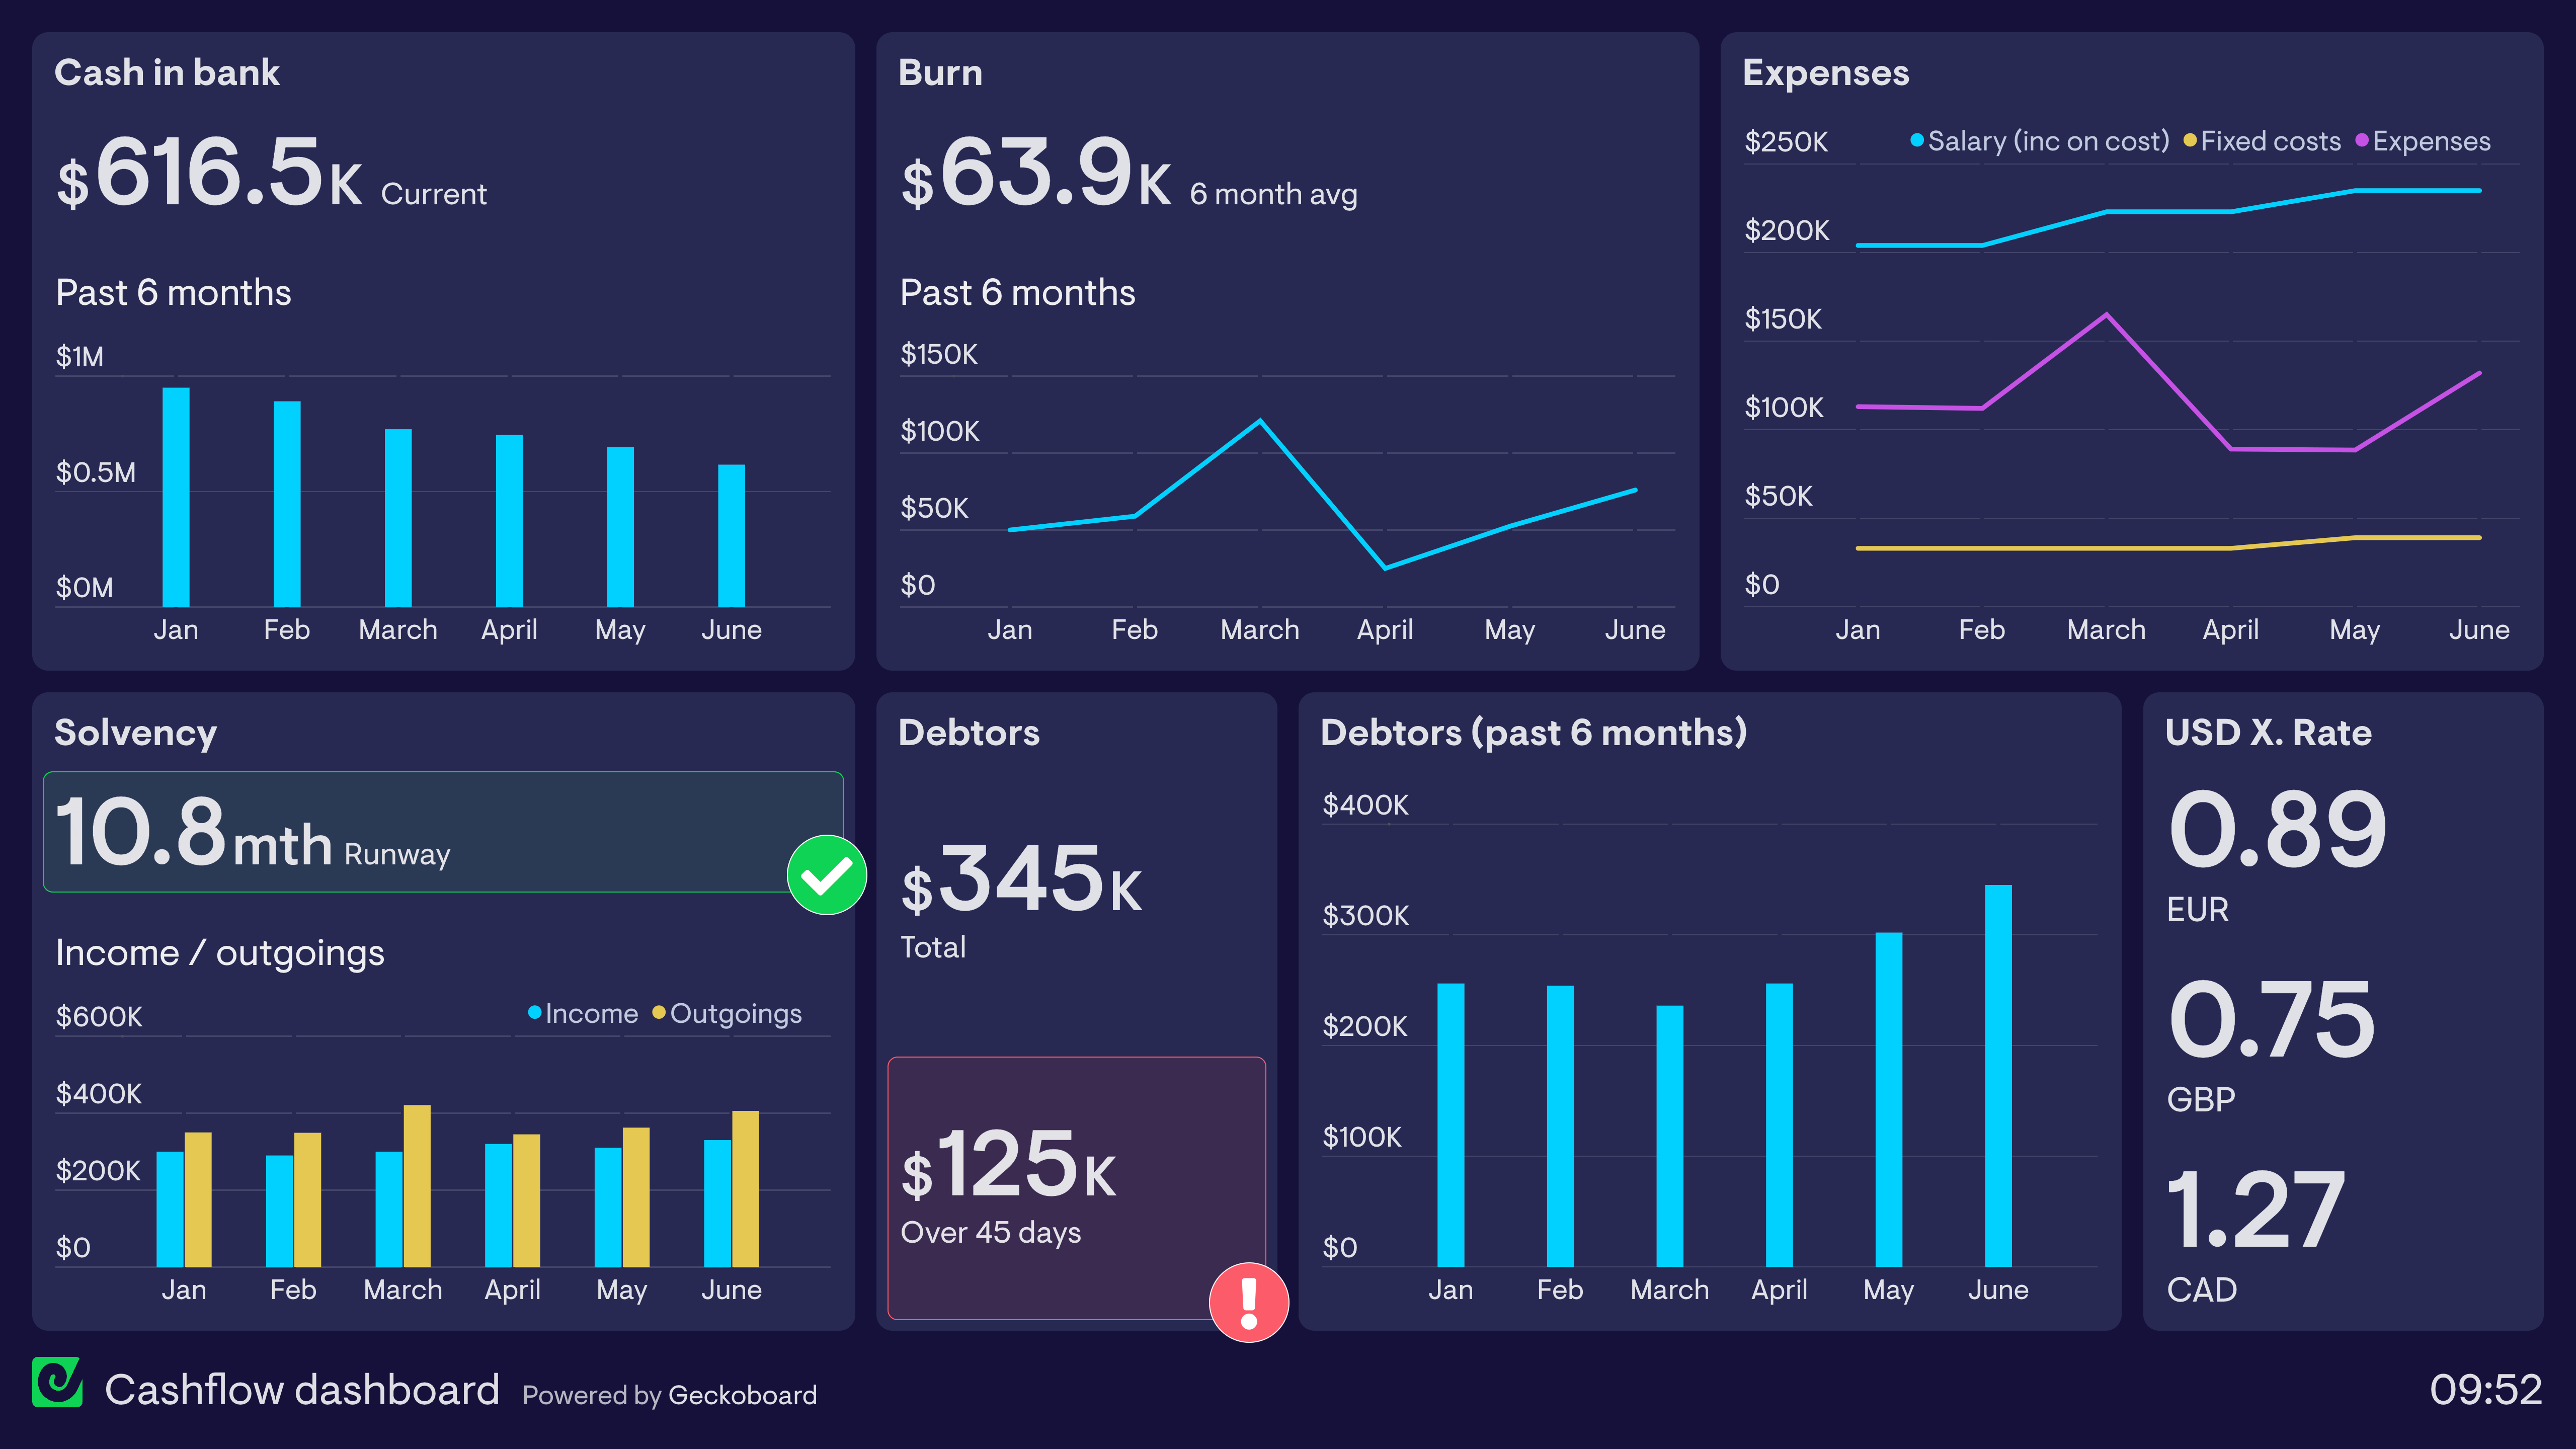
This dashboard tracks several metrics related to cash flow. Firstly the user is tracking total cash in the bank and how this has changed over the past month. Sometimes, companies refer to the difference in cash month-to-month as the Burn Rate, which is also being tracked in the next section of the dashboard. Related to this is the Cash Runway which shows how long the company would be able to operate at its current Burn Rate. The dashboard user has also broken down expenses by type so they can better understand what contributes to expenses.
A significant portion of the dashboard is devoted to debtors. Having debtors is not necessarily a bad thing, and is common in industries which issue invoices. However, companies need to monitor, carefully, debts that have not been paid within the agreed terms, as there is always a risk debtors will not pay. That’s why this dashboard has created a status indicator for unpaid debts longer than 45 days. If this gets too high, the Finance Director will likely need to investigate.
Finally, because the company trades internationally, they have included current exchange rates against the US Dollar.
Browse other popular examples
A cash flow dashboard gives finance teams and business owners a live view of money coming in and going out of the business. It replaces manual spreadsheet updates with an always-current picture of operating cash, outstanding payments, and burn rate — so finance teams can catch problems before they become crises.
Geckoboard is a dashboard tool that connects to accounting platforms, payment processors, and spreadsheets to give finance teams a live view of financial performance. It replaces the manual work of pulling figures from multiple sources with a single view that stays up to date automatically.
Key metrics include net cash flow, operating expenses, accounts receivable, accounts payable, cash on hand, MRR, and runway. SaaS businesses often add subscription revenue breakdowns to understand recurring vs. one-time cash movements.
Building a custom cash flow dashboard is straightforward with Geckoboard's dashboard builder. Connect QuickBooks Online, Stripe, and spreadsheets to pull in real transaction and accounting data automatically, then pick your metrics and build the view you need. Share with your team as a TV dashboard, shared link, or scheduled snapshot. Start a free trial or learn more about how Geckoboard works.
Use it to bring data from your accounting, payment, and billing tools into one current view. It also lets you share a live view with founders and CFOs so they get an instant read on financial health without waiting for month-end reports.