Revenue dashboard examples
A revenue dashboard breaks company revenue down by the factors driving it — product, channel, region, or customer type — so teams can see what's contributing to changes rather than just the headline number. It turns a single metric into something you can actually act on.
MRR breakdown dashboard
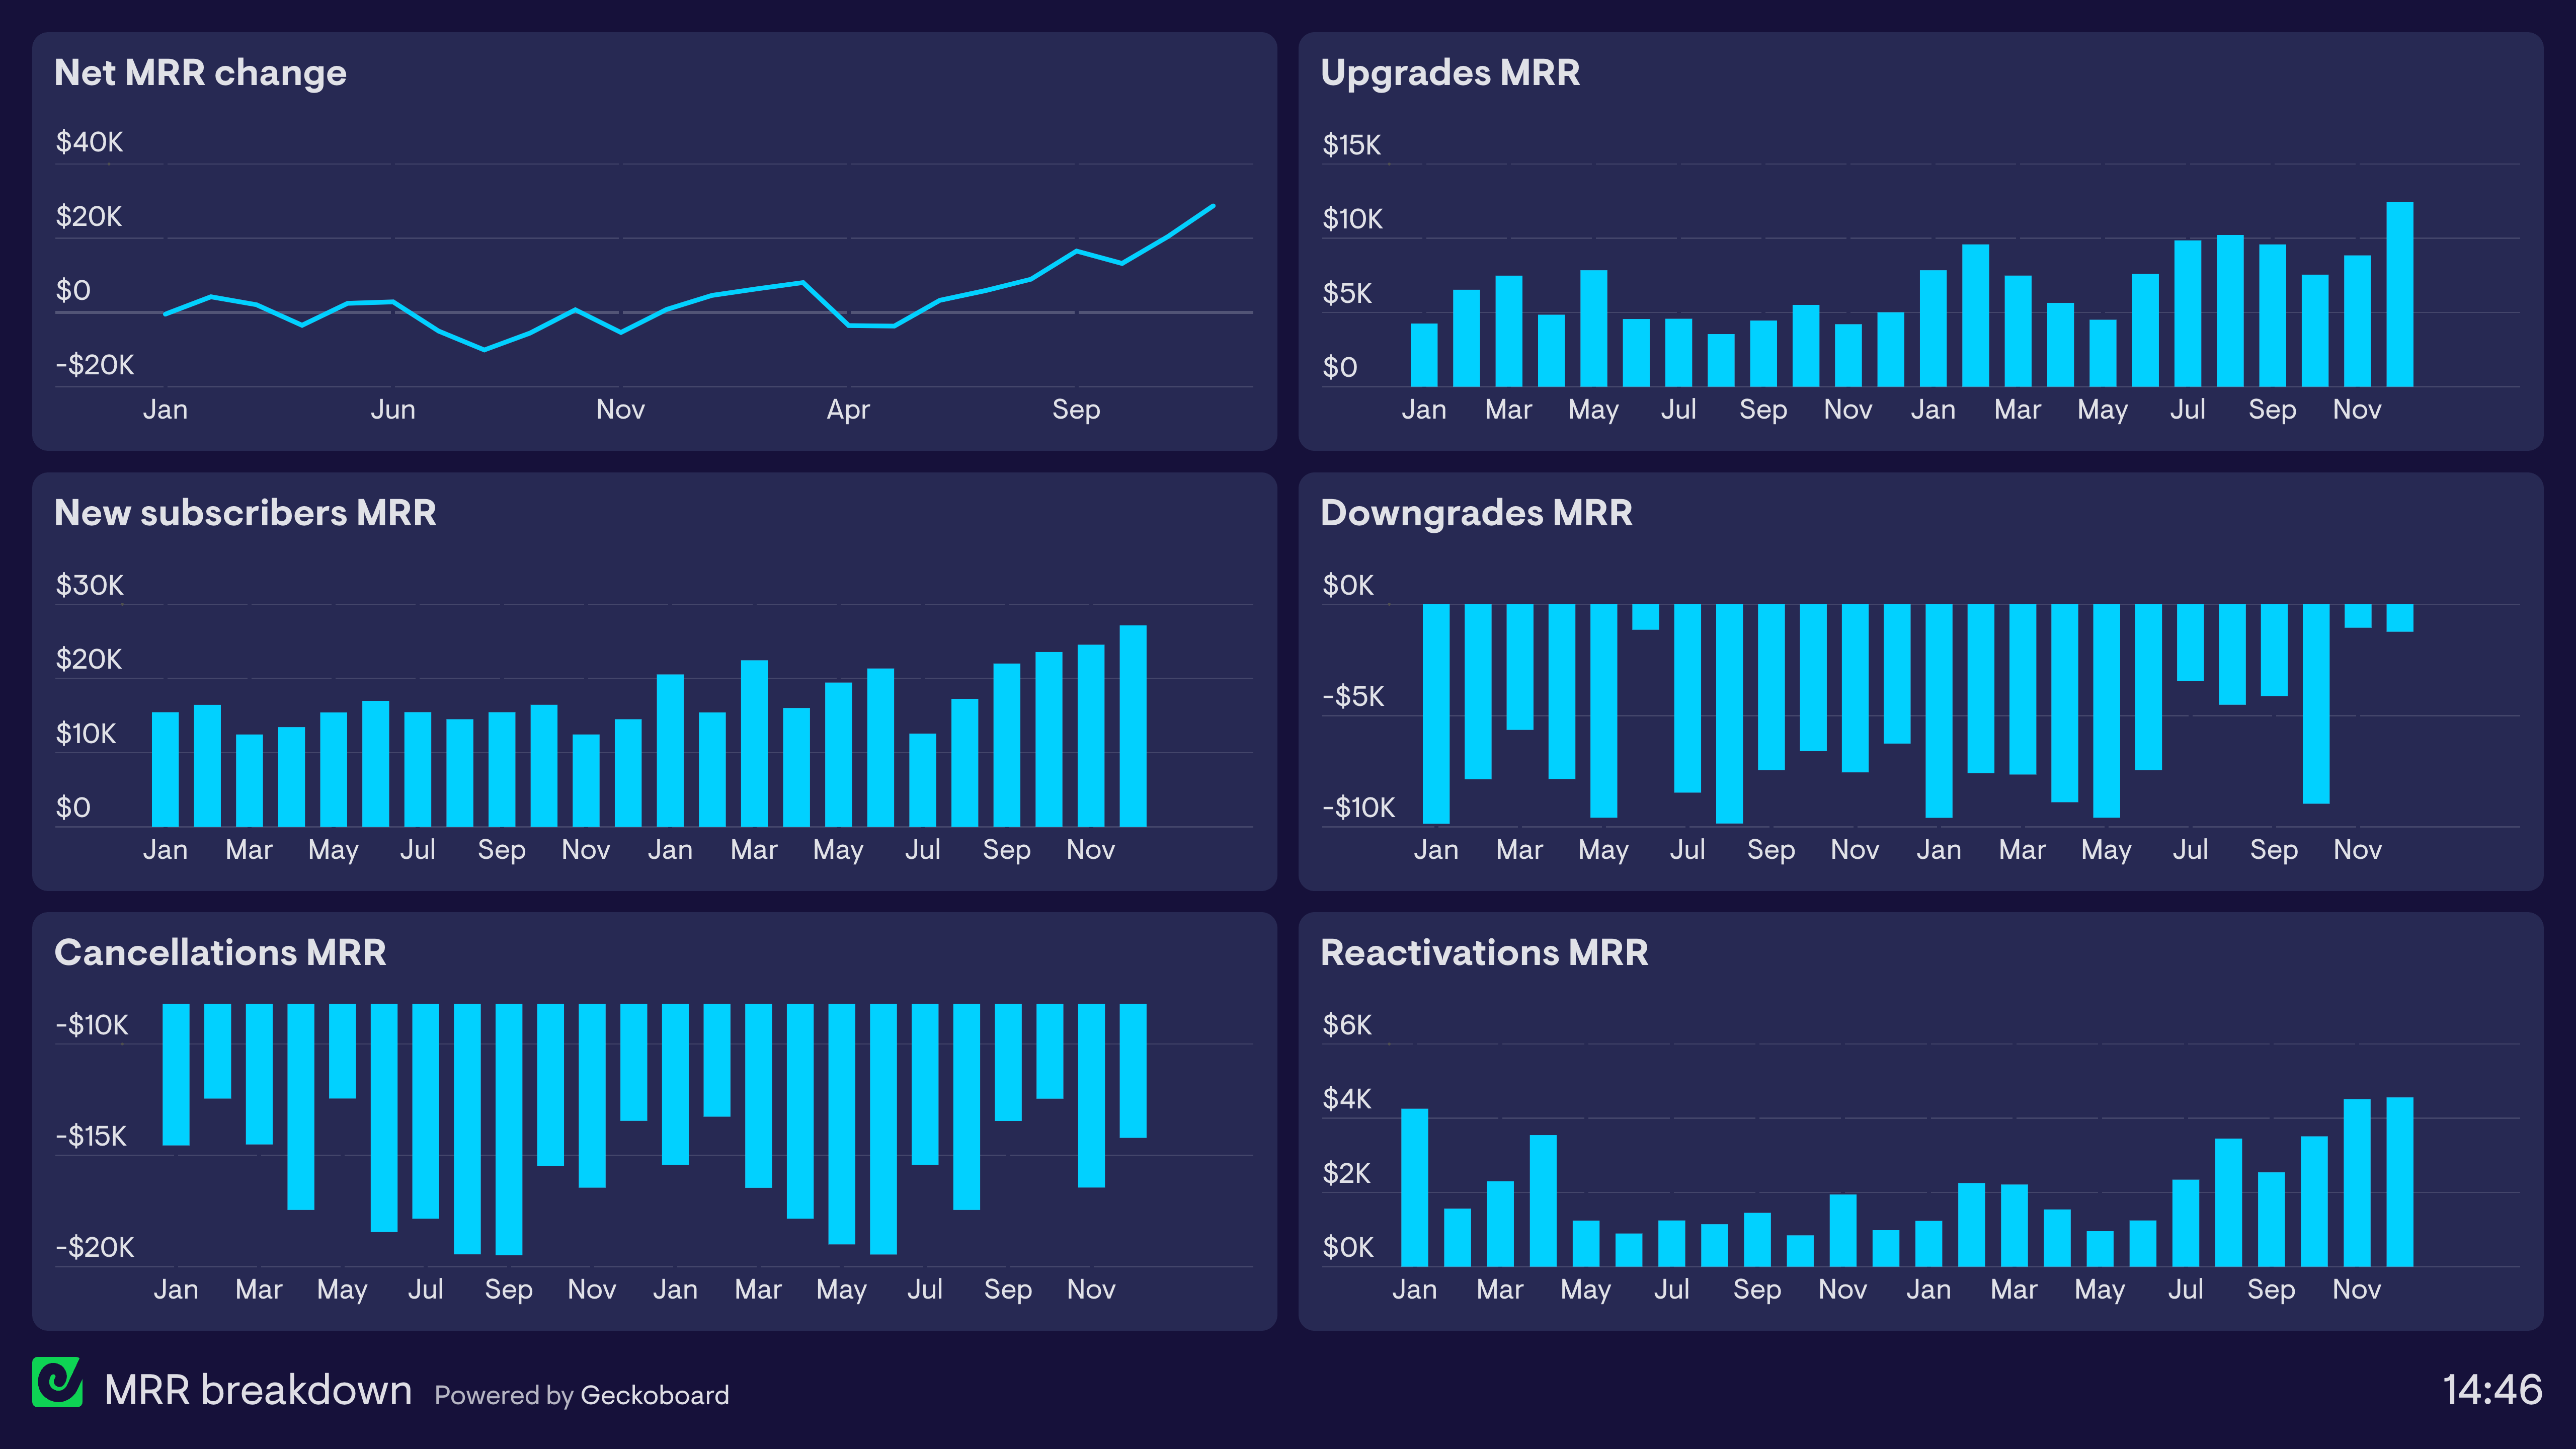
This dashboard is tracking MRR (Monthly Recurring Revenue), a metric which many subscription-based businesses use to provide a normalized, high-level view of their revenue performance. On the line chart in the top left hand corner, we can see the net change to MRR – anything greater than $0 shows growth, whereas anything lower than $0 indicates a shrinkage in overall MRR that month.
Particularly in SaaS companies, there are many factors that can drive revenue change. This includes acquiring new customers, cancellations, upgrades to a higher-priced plan, downgrades to a lower-priced plan and dormant customers who have reactivated their account. Alongside the Net MRR change figure, this dashboard shows each of these metrics separately, so users are aware of the context behind changes to the primary KPI.
Browse other popular examples
A revenue dashboard gives finance and leadership teams a live view of MRR, ARR, and the key subscription metrics that determine revenue health. It's used by SaaS businesses to track how revenue is growing, contracting, and churning — without waiting for monthly billing reports to be compiled manually.
Geckoboard is a dashboard tool that connects to billing platforms, databases, and spreadsheets to give finance and leadership teams a live breakdown of revenue. It keeps the numbers current without requiring someone to pull and format the data each time a stakeholder needs an update.
Core metrics include MRR, new MRR, expansion MRR, churned MRR, net revenue retention, ARR, and MRR by plan tier. Teams often display an MRR breakdown showing exactly where growth is coming from and where it's being lost.
Building a custom revenue dashboard is straightforward with Geckoboard's dashboard builder. Connect Baremetrics, Stripe, or SQL databases and custom data sources to pull subscription and billing data automatically, then pick your metrics and build the view you need. Share with your team as a TV dashboard, shared link, or scheduled snapshot. Start a free trial or learn more about how Geckoboard works.
Use it to monitor performance in real time so finance teams and founders can see how MRR is moving day by day — not just at month end. It also helps deliver executive visibility into subscription health, giving leadership a live read on growth, churn, and net revenue retention without a manual report.