Lead generation dashboard examples
A lead generation dashboard tracks how each part of the demand generation funnel is performing — from traffic and form fills to MQLs and conversion rates. It tells marketing teams which channels are working and where in the funnel things are slowing down.
Lead capture - 7 day performance dashboard
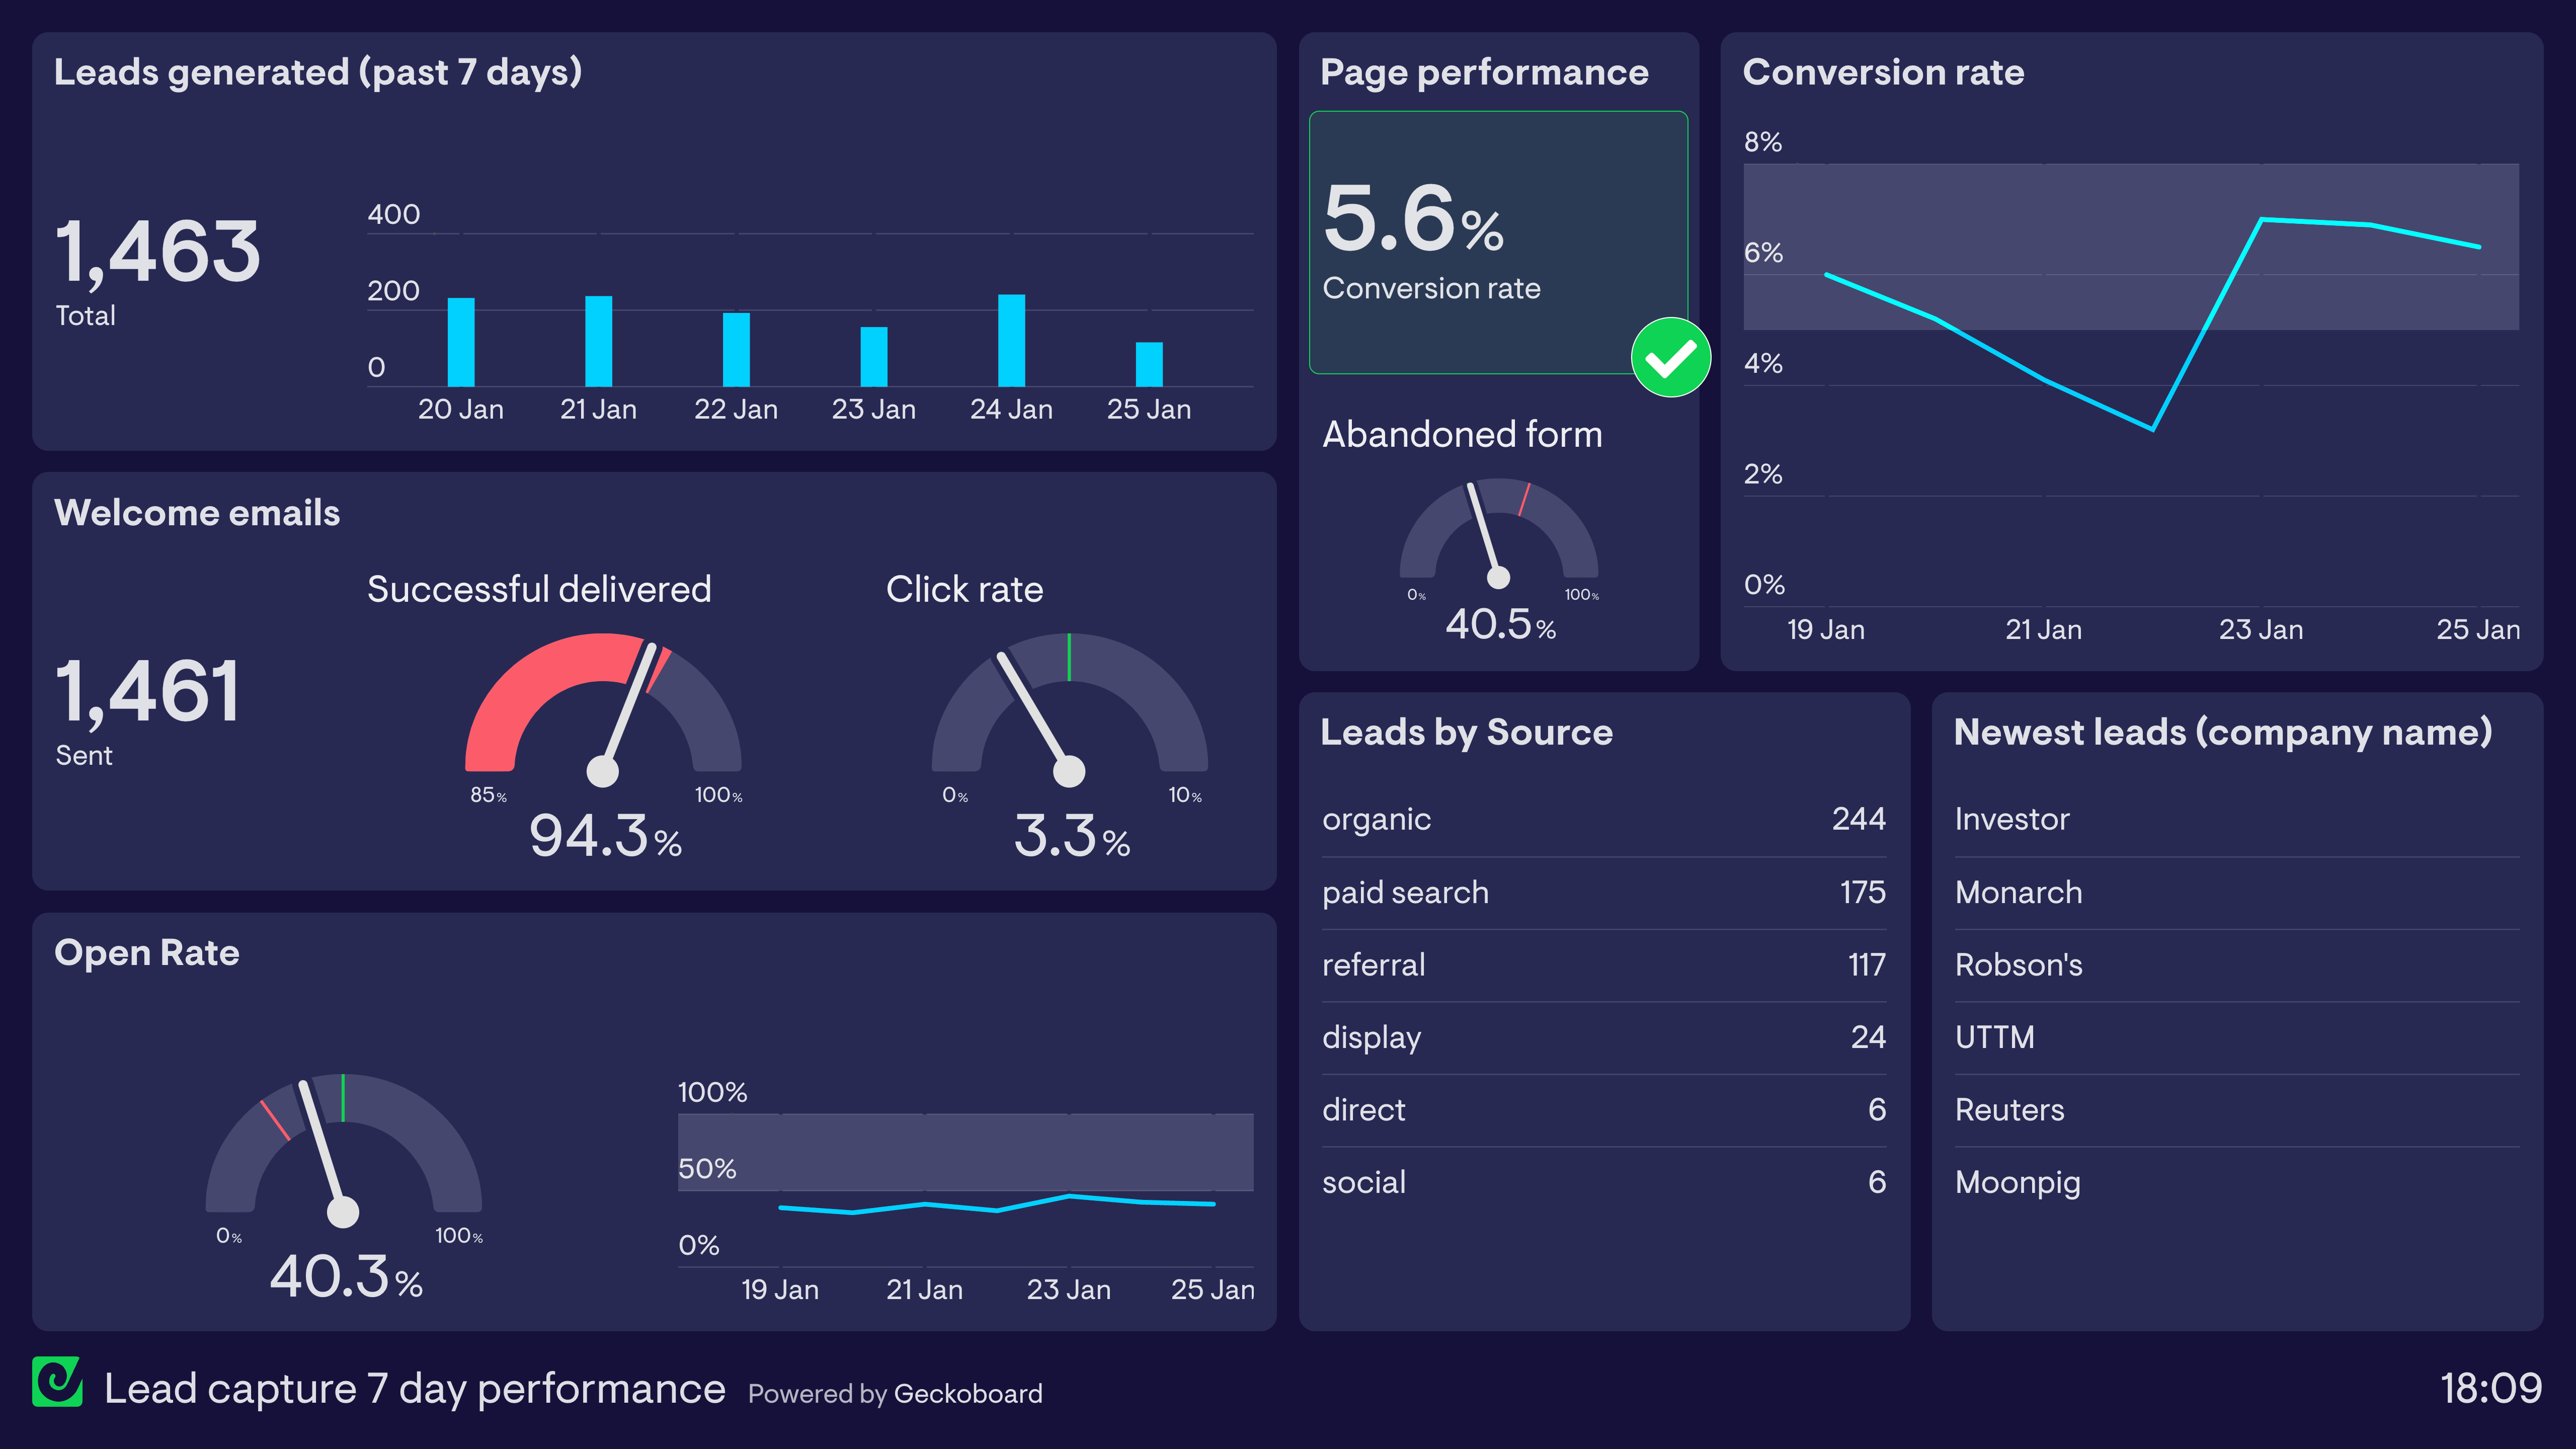
This dashboard provides a snapshot of the company’s lead generation performance over the past seven days. We can see how many leads have been generated each day.
Furthermore, the dashboard sets parameters for when different aspects of the funnel are performing above or below a set threshold. We can see, for example, the landing page is converting leads at a rate above the 5% goal. However, we can also see that the welcome email has dropped below the 95% target for successful deliveries. This might require further attention.
Browse other popular examples
A lead generation dashboard gives marketing and demand generation teams a live view of how many leads are coming in, where they're coming from, and how they're converting through the funnel. It helps teams track campaign effectiveness and optimise their mix without waiting for end-of-month reports.
Geckoboard is a live dashboard tool that connects to HubSpot, Salesforce, Google Analytics, and other lead tracking tools to give marketing teams a real-time view of funnel performance. Dashboards update automatically so the team always knows how lead generation is tracking — without waiting for a weekly report.
Key metrics include leads generated, MQLs, SQLs, lead-to-MQL conversion rate, cost per lead, lead source breakdown, and 7-day or 28-day trends. Teams connecting both HubSpot and Salesforce can track the full journey from first touch to closed deal.
Building a custom lead generation dashboard is straightforward with Geckoboard's dashboard builder. Connect HubSpot, Salesforce, and Google Analytics to pull lead and conversion data from both your CRM and your website, then pick your metrics and build the view you need. Share with your team as a TV dashboard, shared link, or scheduled snapshot. Start a free trial or learn more about how Geckoboard works.
Use it to monitor performance in real time so demand gen teams can spot a drop in lead volume from a specific channel and investigate before the pipeline is affected. It also helps automate reporting by replacing manual weekly lead reports with a dashboard that's always up to date.