Web analytics dashboard examples
A web analytics dashboard pulls the metrics that actually matter out of Google Analytics and other tools and presents them in a format that's quick to read and easy to share. It's the difference between having access to data and being able to act on it.
Website KPI dashboard
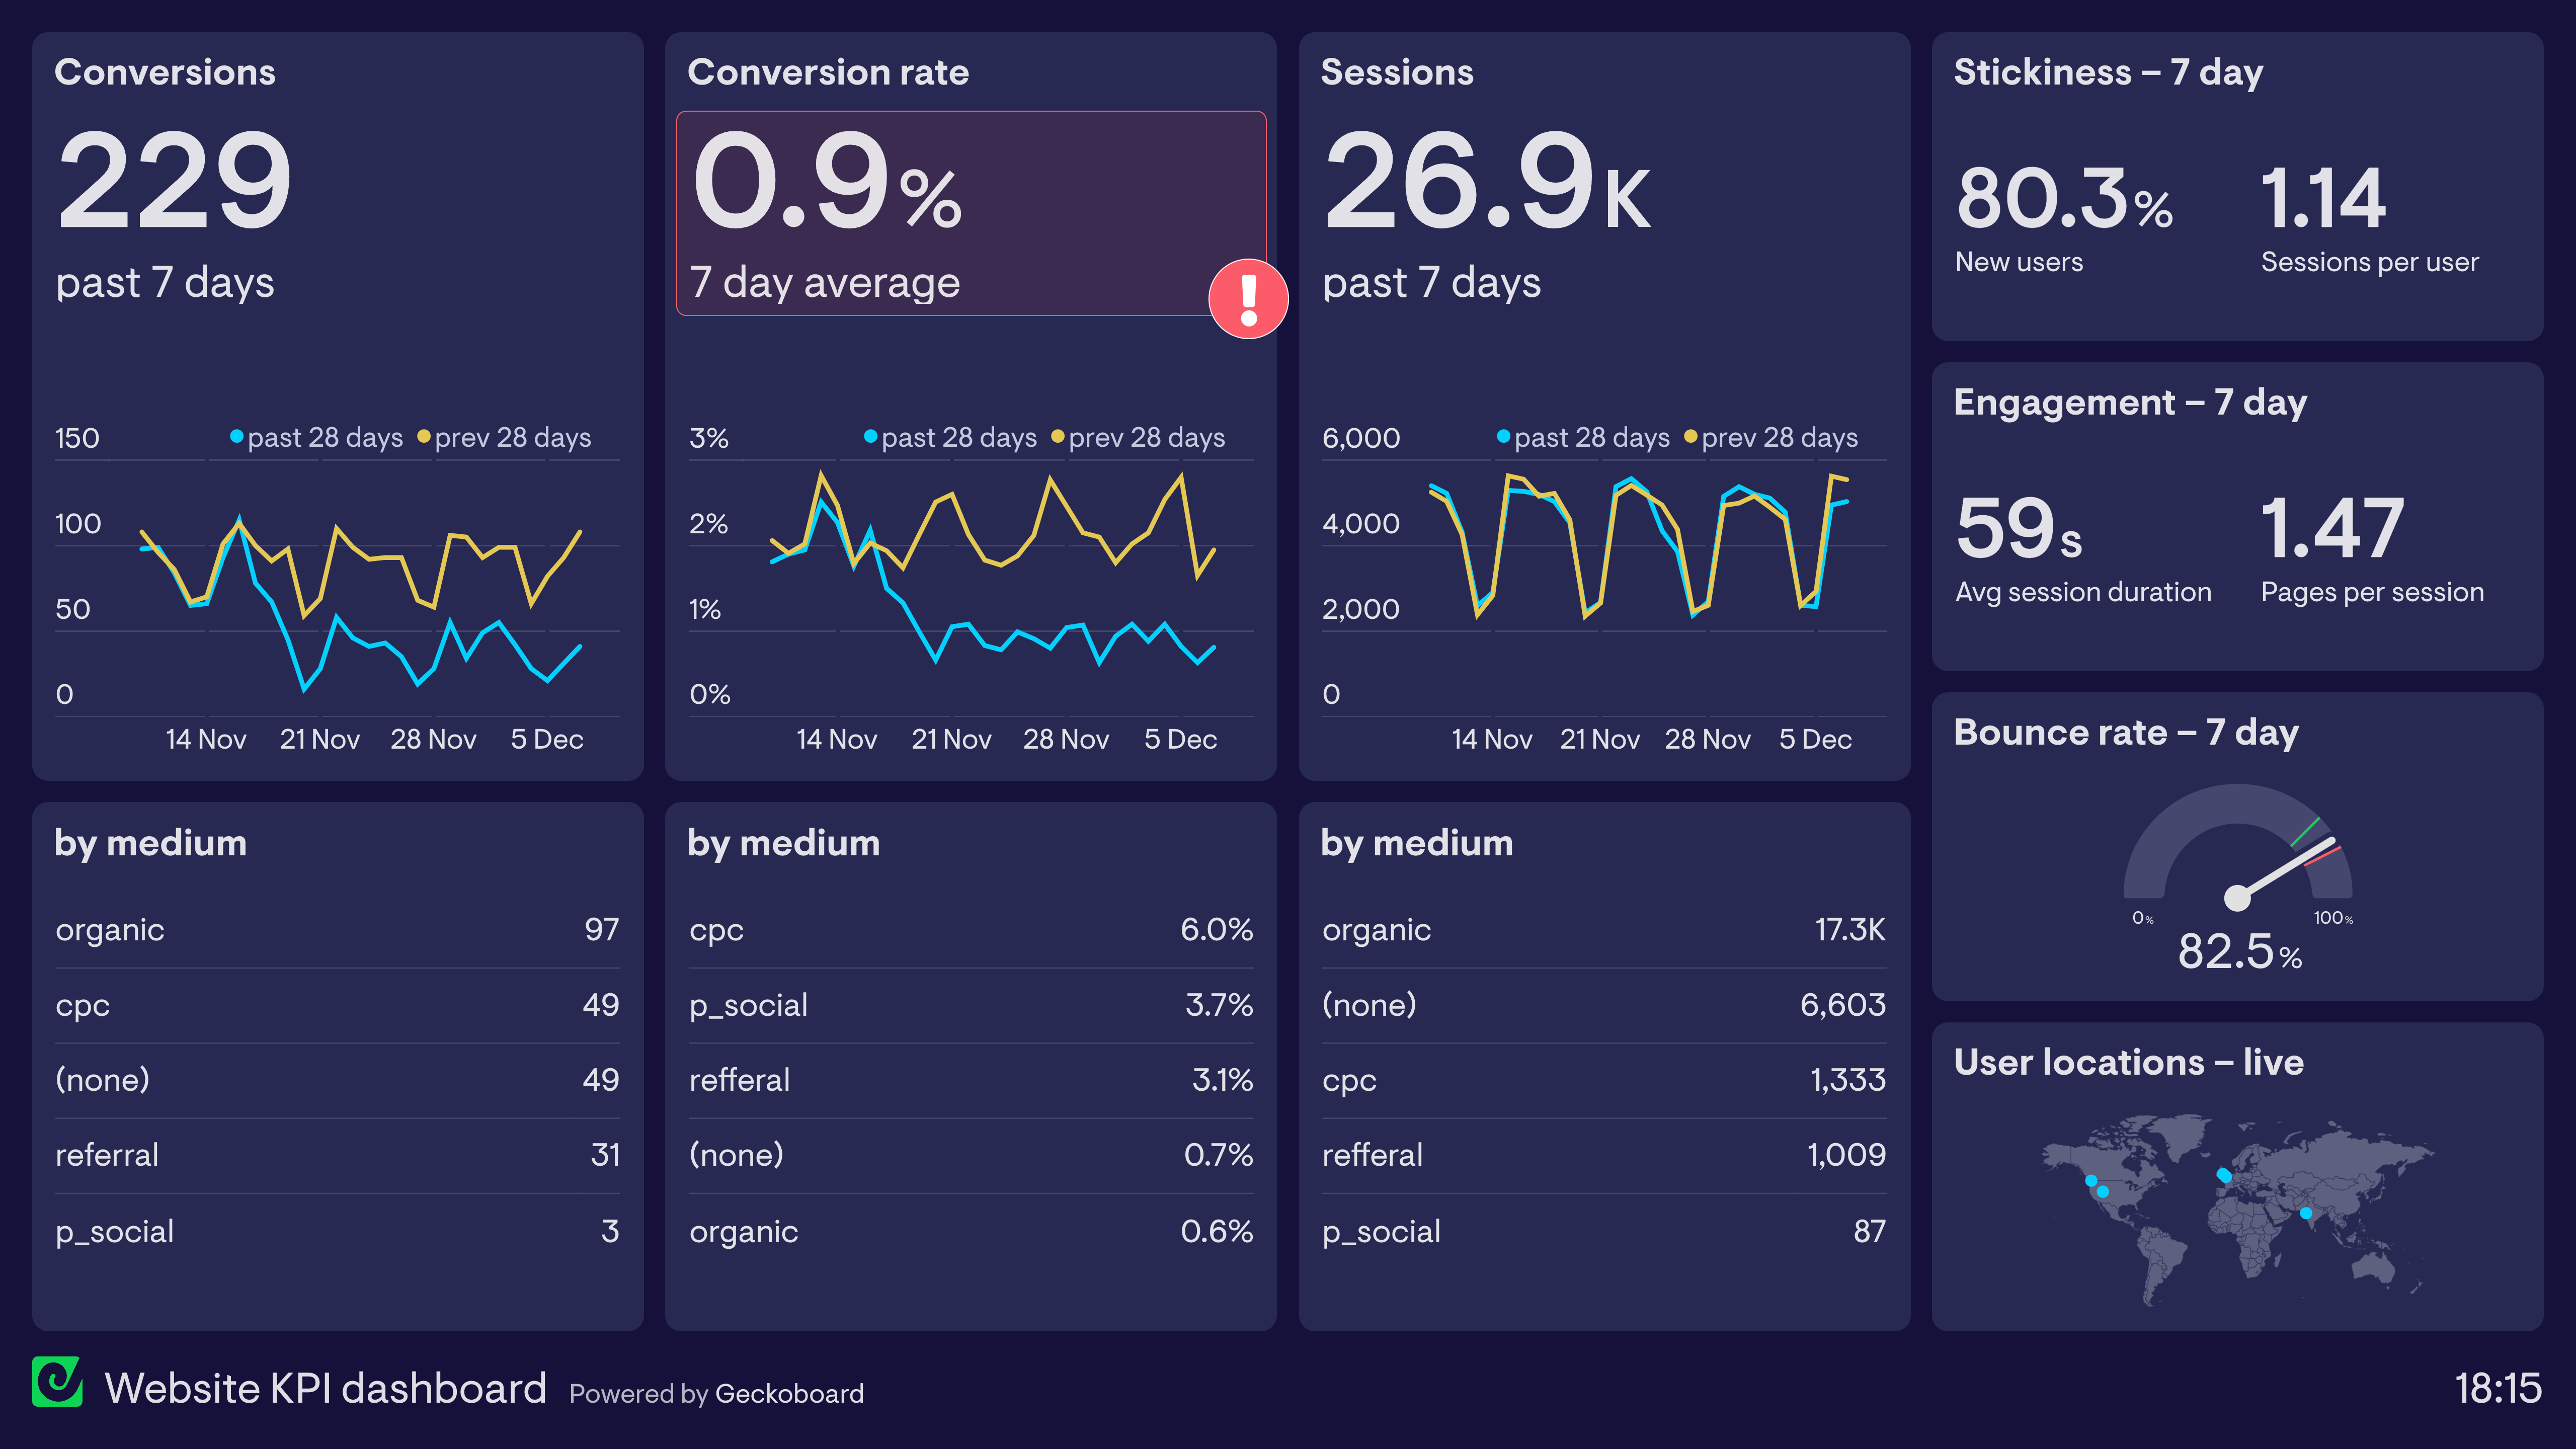
This dashboard is designed to visualize how effectively a website is converting traffic. A ‘goal completion’ occurs when a user submits a lead generation form, which is then processed by one of the Sales Managers.
In this example, the Marketing Manager can quickly and easily see that conversions have dropped significantly in the past month. This is despite the number of website sessions remaining constant. It’s possible that something on the website is preventing the users from converting, such as a slow loading landing page, or a broken form.
This dashboard is also tracking engagement metrics, such as bounce rate and session duration, in order to show how effective the site is at maintaining users’ interest and attention.
Google Analytics 4 dashboard
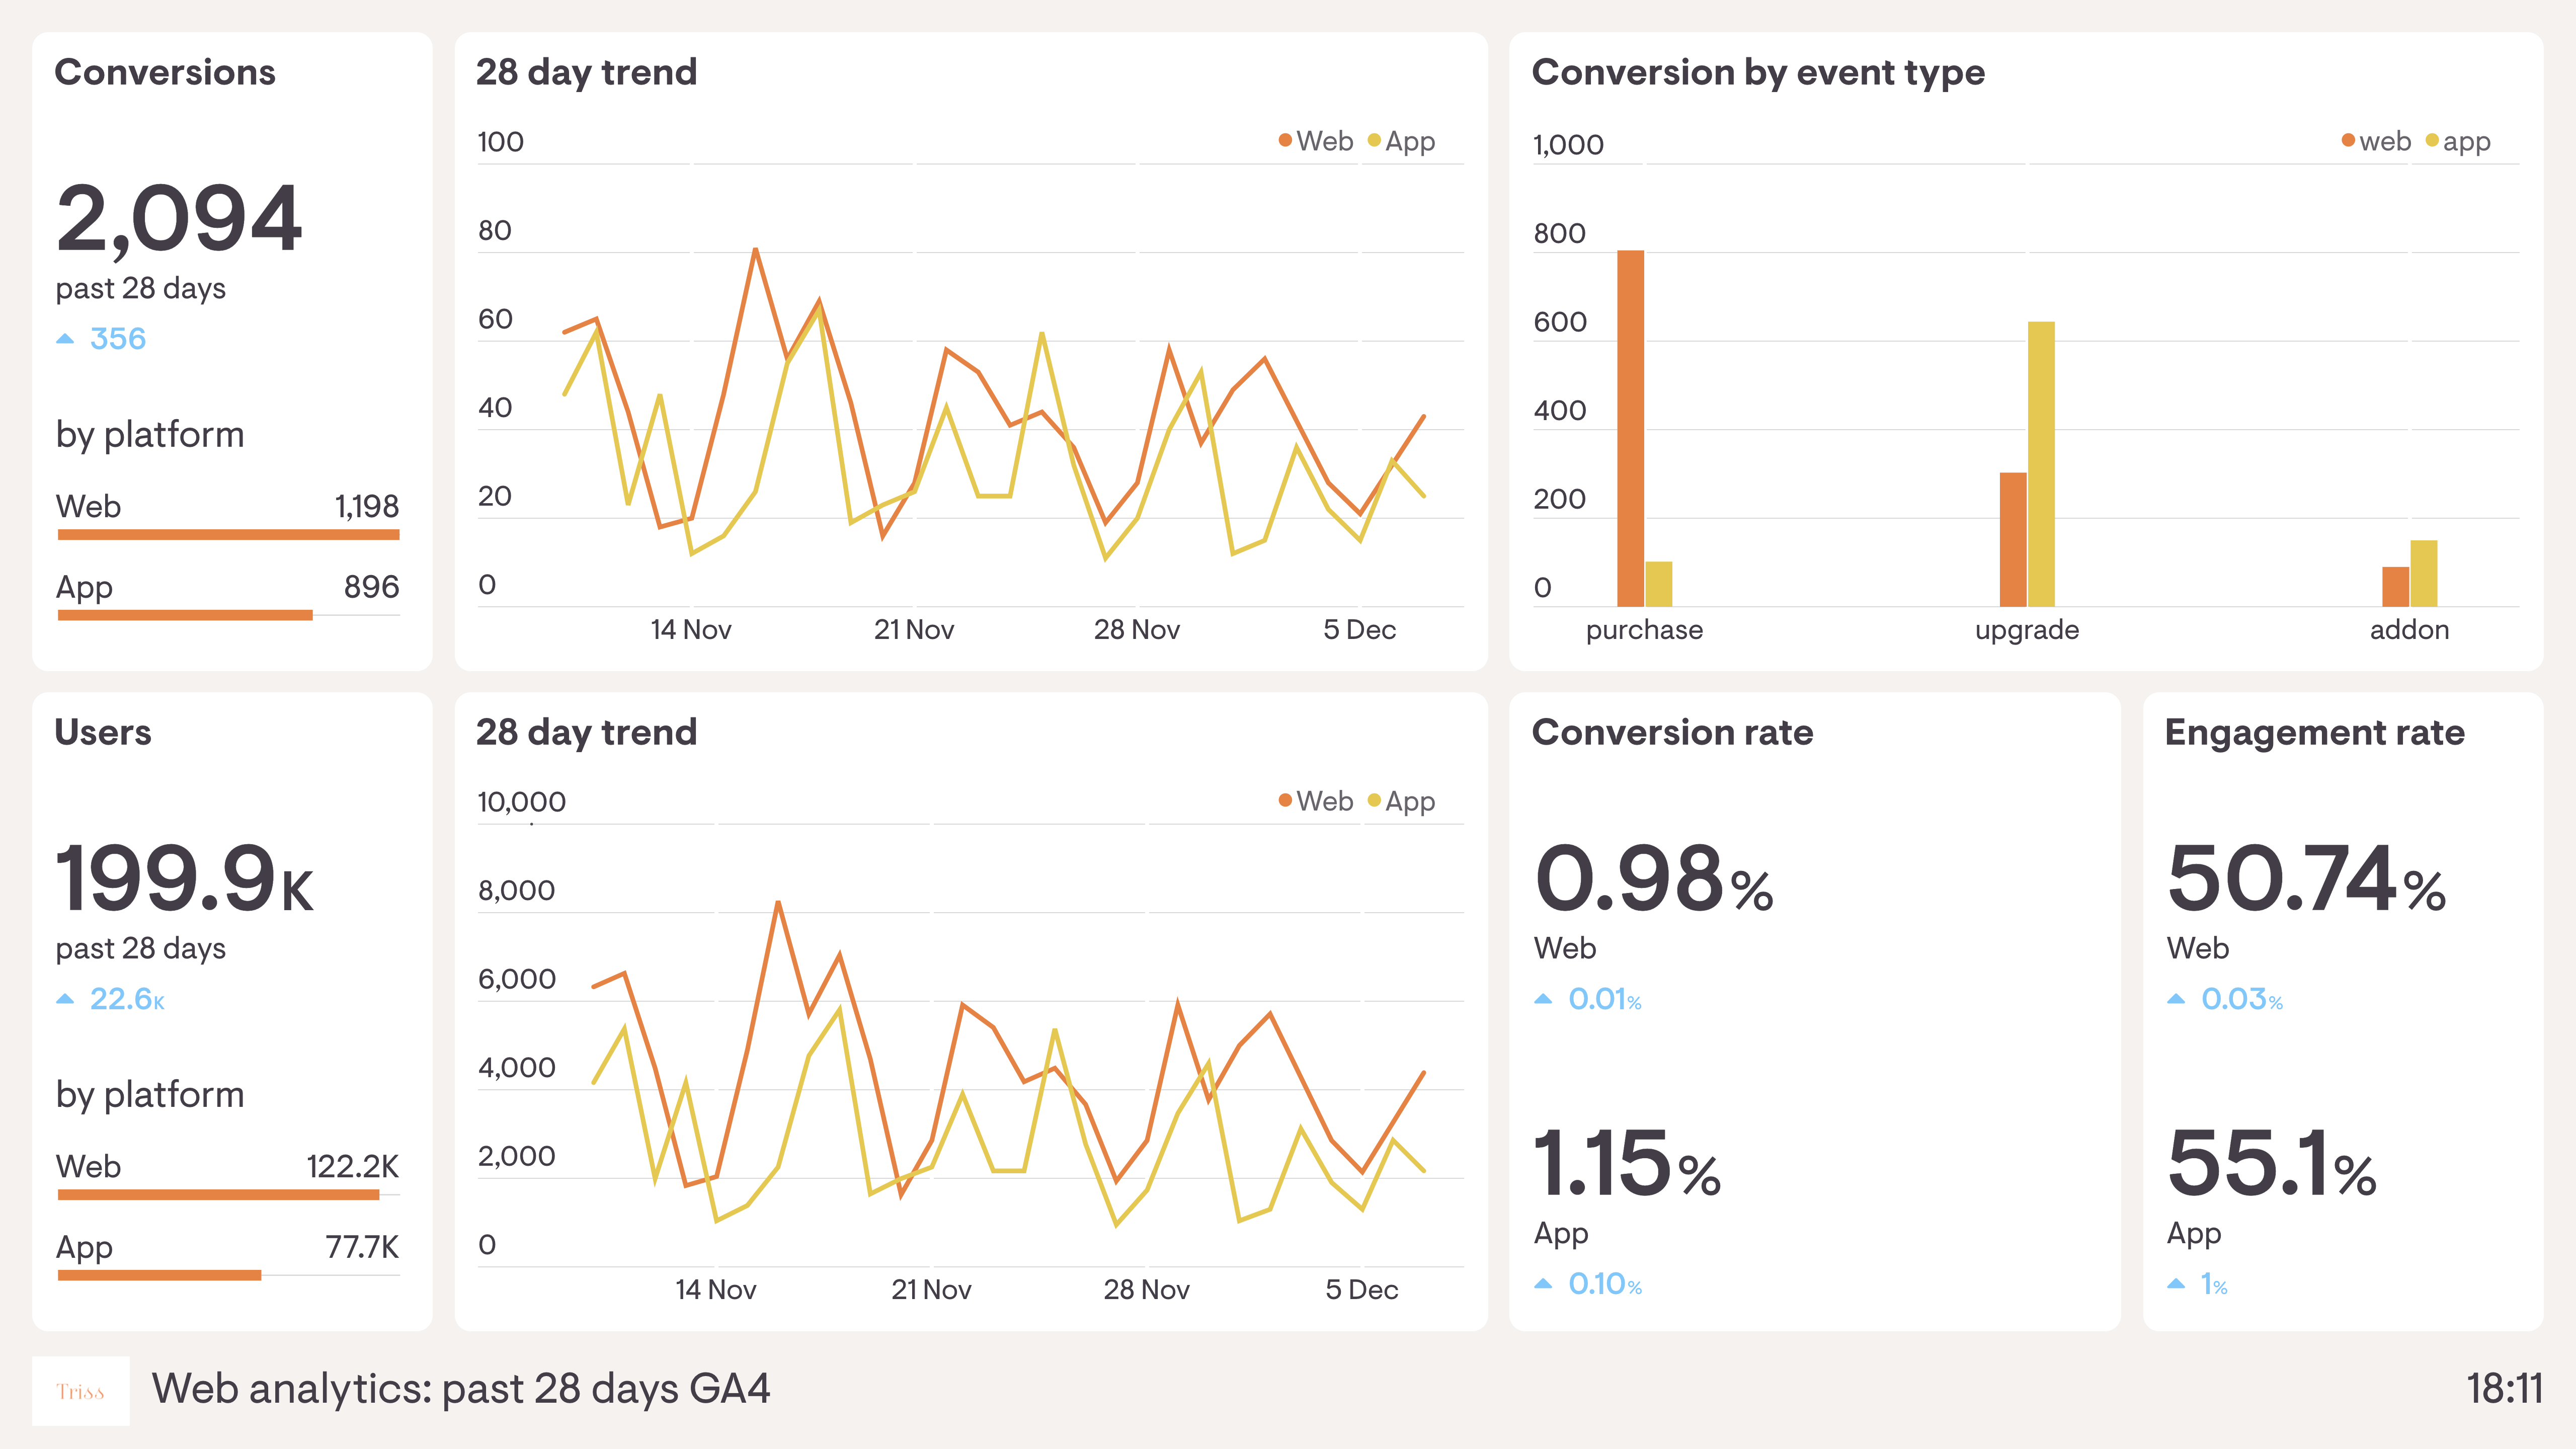
In 2020, Google released Google Analytics 4 as its default analytics platform, though many Google Analytics users can still (and often do) also choose to use the previous version – Universal Analytics.
Google Analytics 4 made sweeping changes to the data Google Analytics collects, including moving to new metrics such as Engaged Sessions and Engagement Rate. The structure of data it now collects also makes it easy to measure performance across different platforms, which is especially useful for companies who need to track user behaviour on their apps, as well as their website.
The dashboard above visualizes data collected on Google Analytics 4 so the team can quickly and easily monitor user engagement and the performance of their platforms. It tracks user metrics concurrently for both app and website.
Website launch dashboard
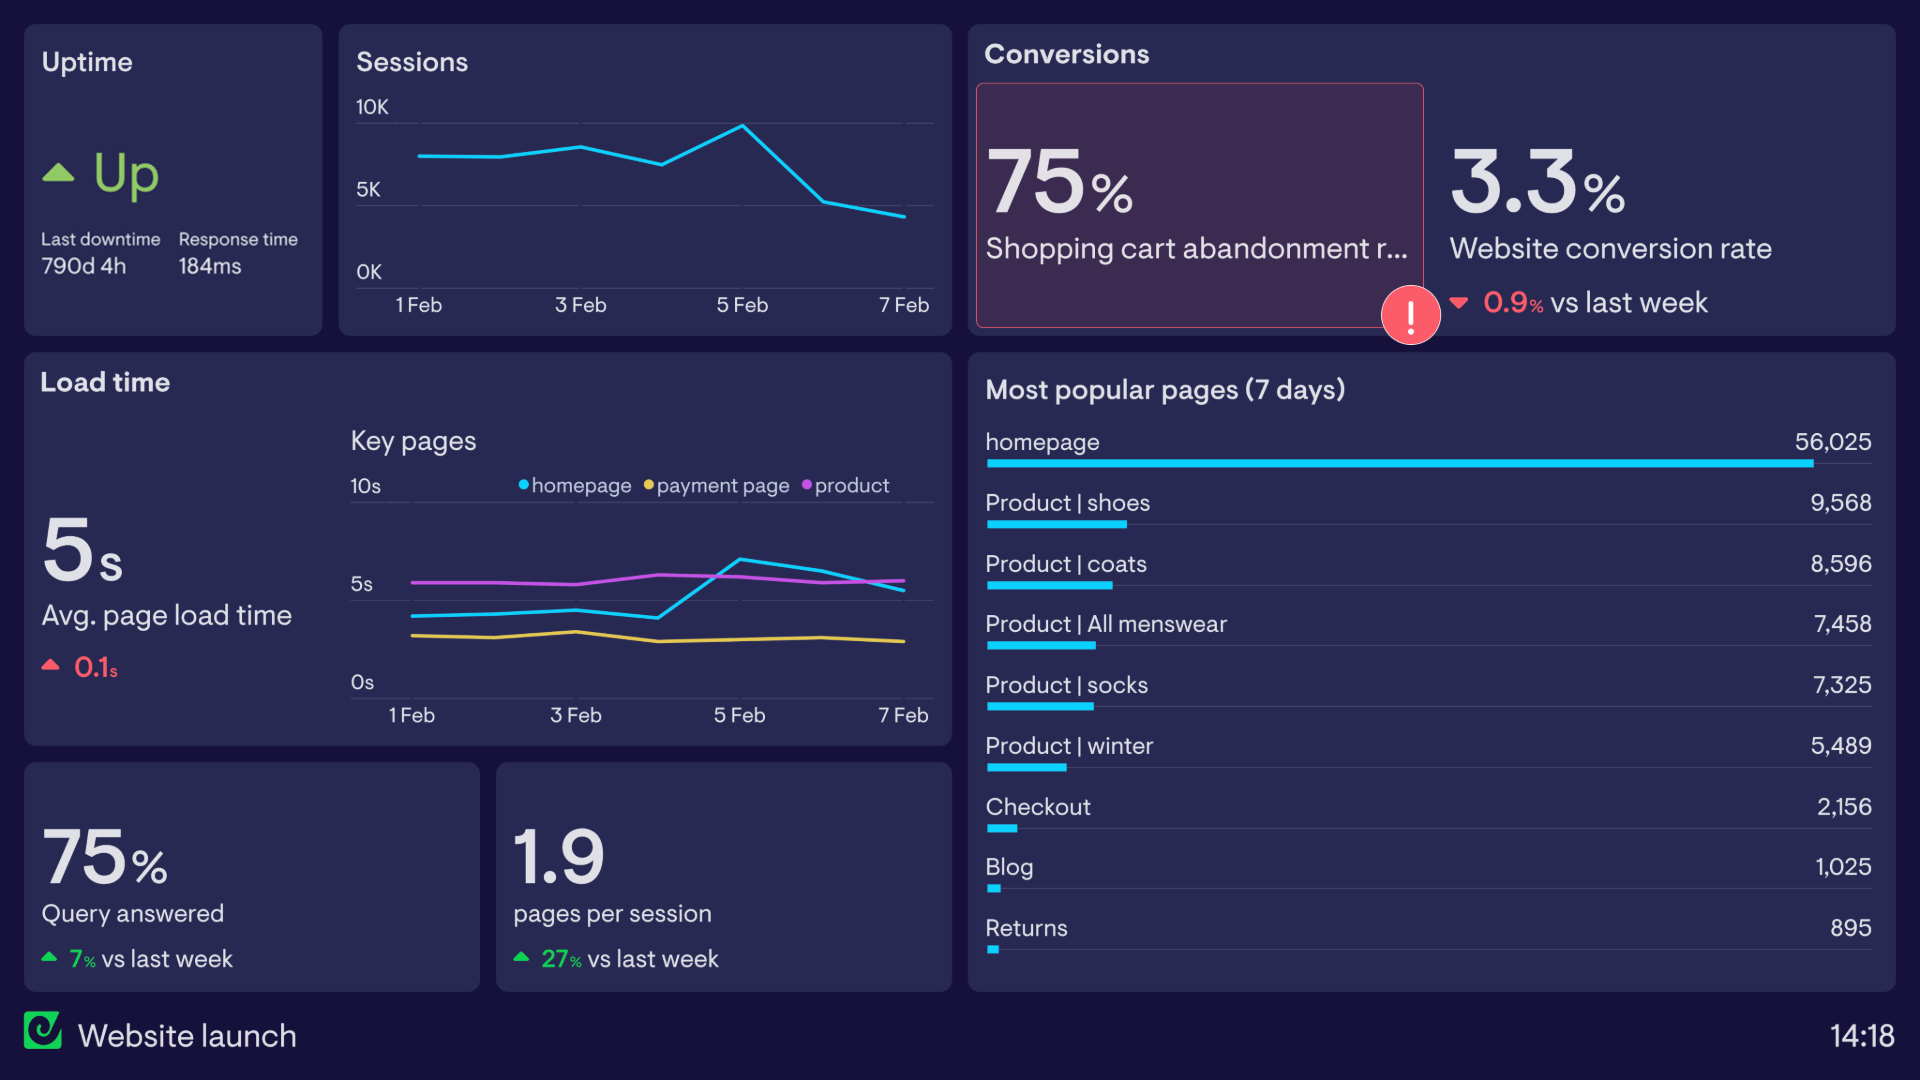
Web analytics dashboards aren’t just used for day-to-day operations. Many dashboards are set up to track one-off or time-limited events. This dashboard has been set up to track the launch of a new, refreshed website.
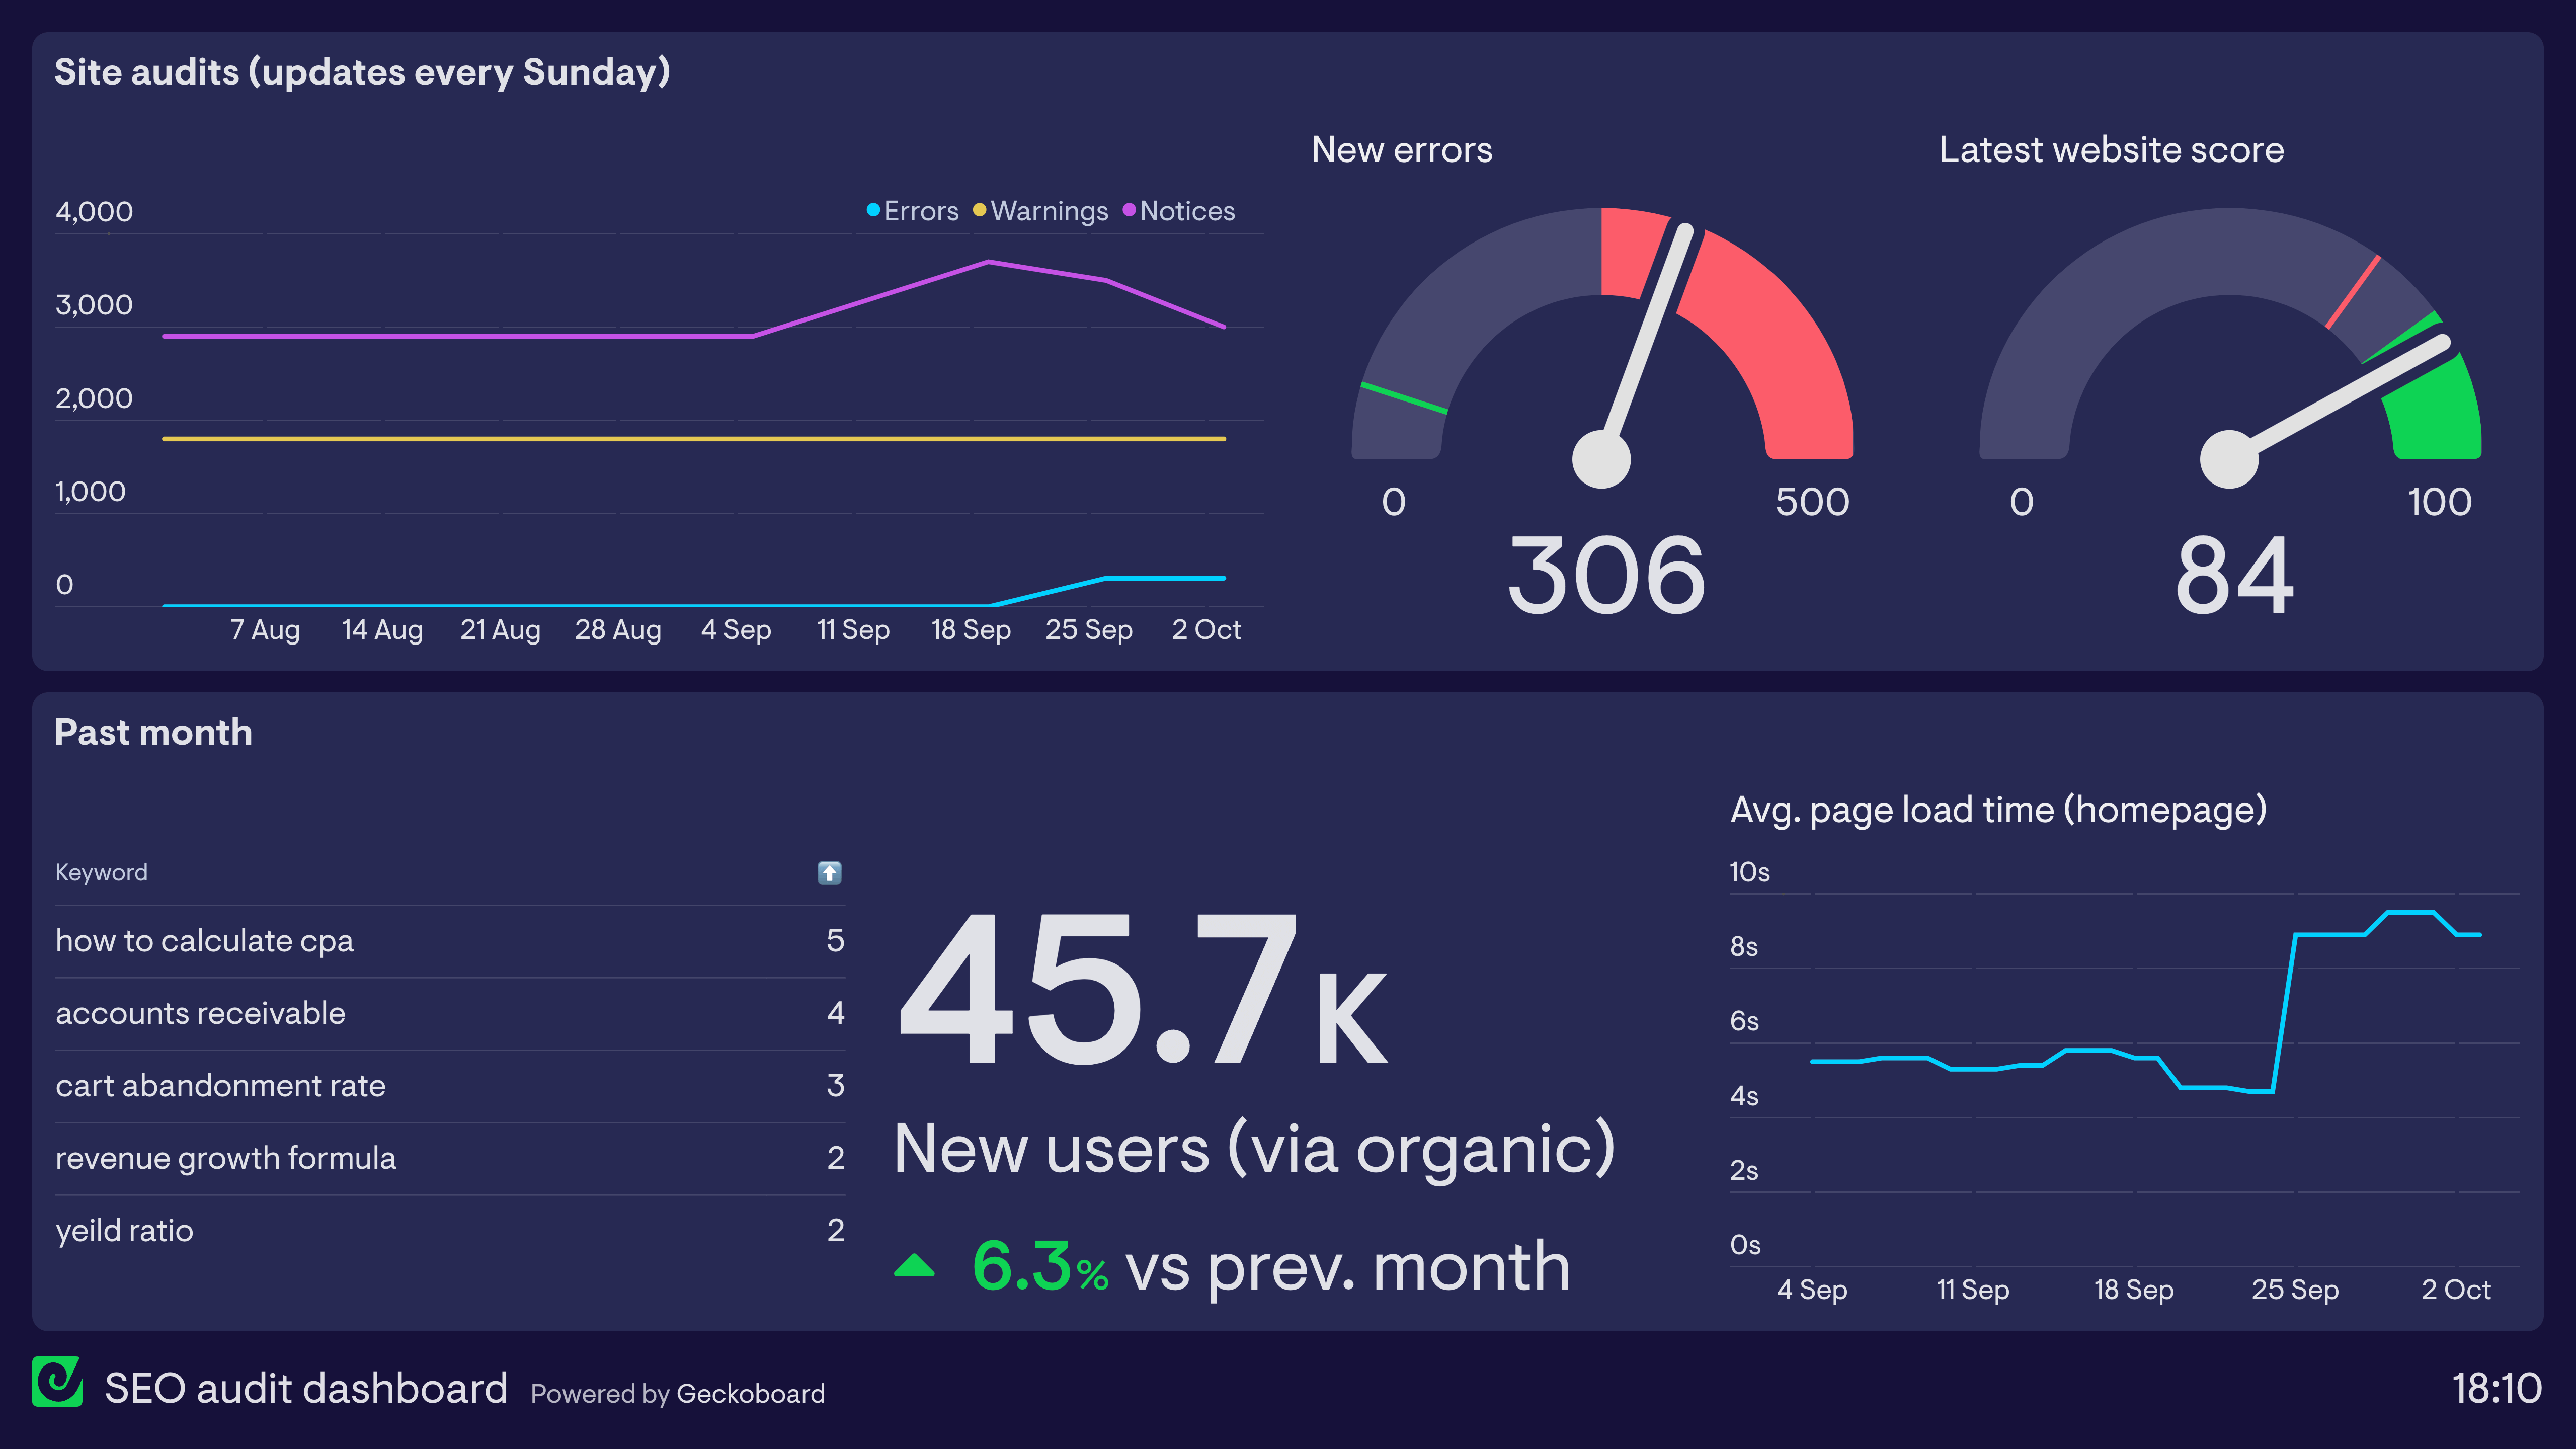
The dashboard can quickly highlight any acute problems with the new site that would affect the visitors’ experience. This includes tracking website uptime (using data from Pingdom), load time and general session metrics (using data from Google Analytics).
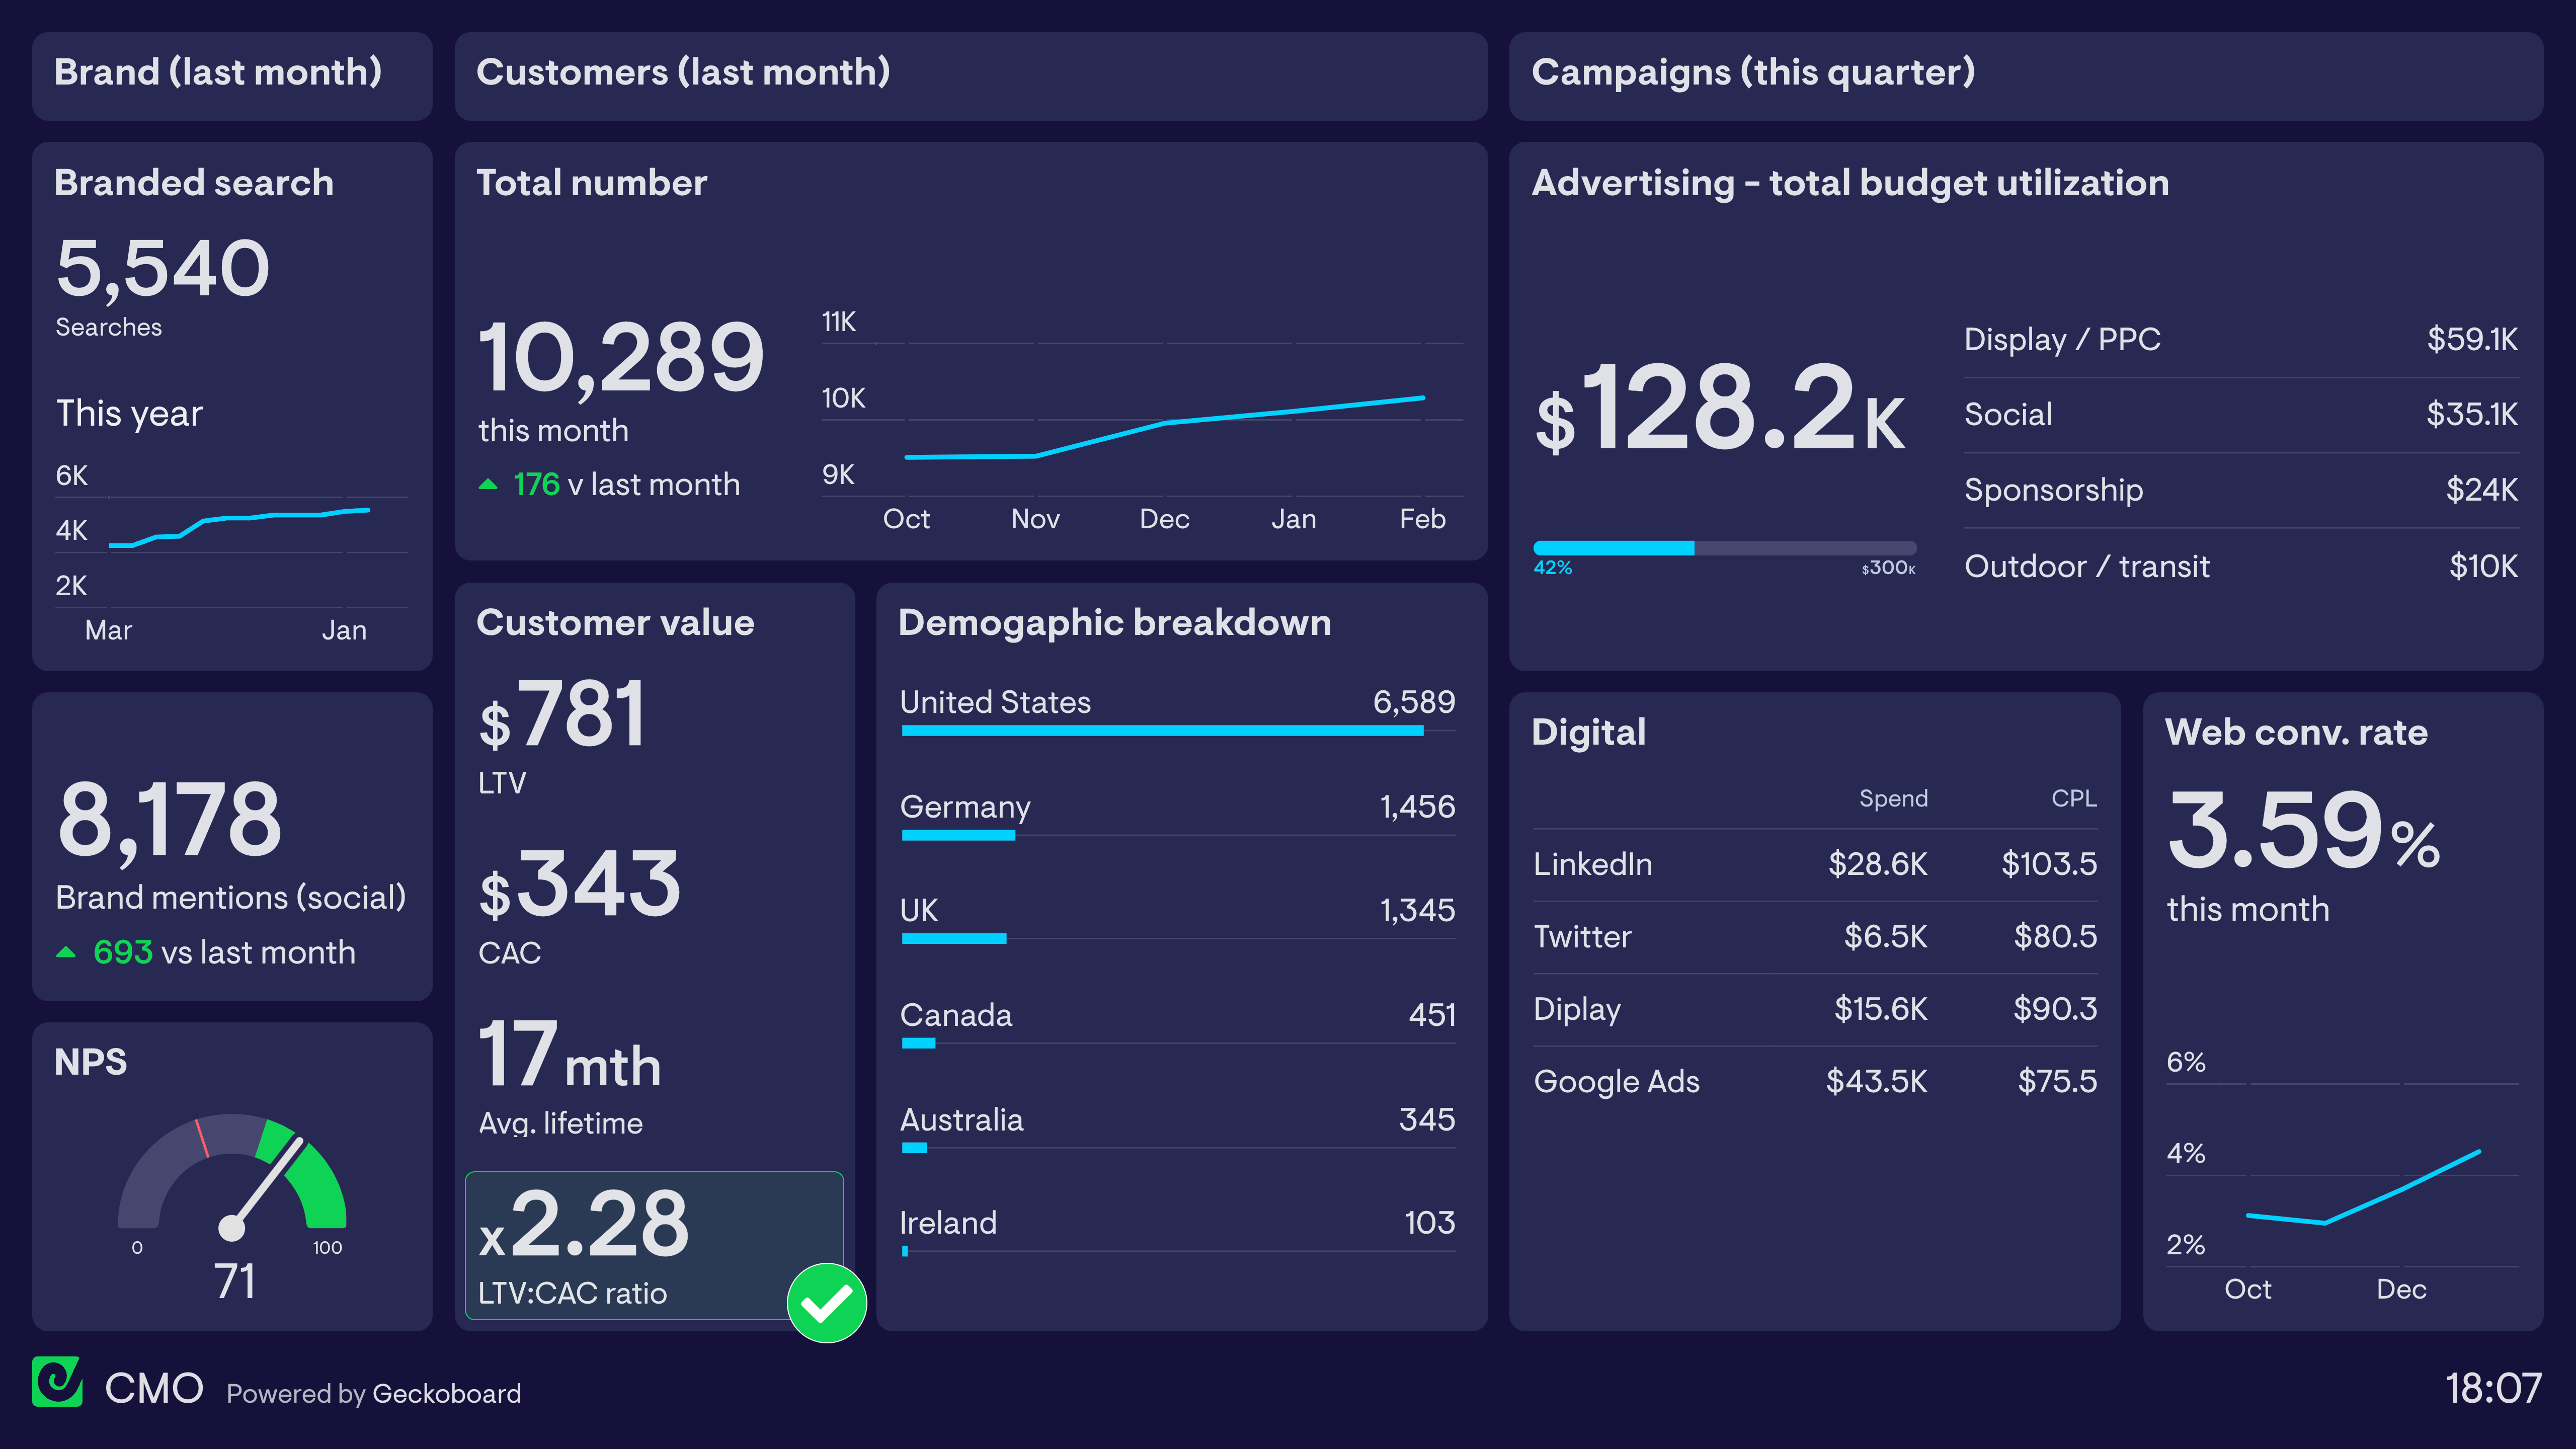
A web analytics dashboard gives marketing and digital teams a real-time view of website performance — tracking traffic, user behaviour, and conversion data in one place. It's used by teams who want to monitor their site without logging into Google Analytics every time they need a quick performance check.
Geckoboard is a dashboard tool that connects to Google Analytics and other web data sources to give marketers a live view of site performance. It's used by teams who want the most important website metrics on a shared screen or snapshot — without sending everyone to dig through analytics platforms themselves.
Typical metrics include sessions, users, pageviews, bounce rate, conversion rate, goal completions, top pages, and traffic by source. Teams monitoring site health also track uptime and page load time.
Building a custom web analytics dashboard is straightforward with Geckoboard's dashboard builder. Connect Google Analytics for traffic and behaviour data, Pingdom for uptime monitoring, and Twitter if you want to track social traffic alongside site performance, then pick your metrics and build the view you need. Share with your team as a TV dashboard, shared link, or scheduled snapshot. Start a free trial or learn more about how Geckoboard works.
Use it to monitor performance in real time — seeing the impact of a campaign, content launch, or site change the moment it goes live. It also helps automate reporting by replacing the weekly "pull GA data into a slide" routine with a dashboard anyone can check at any point in the week.