Health and Safety dashboard examples
A Health and Safety dashboard tracks the metrics that show how well your H&S practices are working — from accident volumes to training completion and risk assessment status. It supports a more proactive approach to safety, rather than only measuring things after something has gone wrong.
Health and Safety dashboard
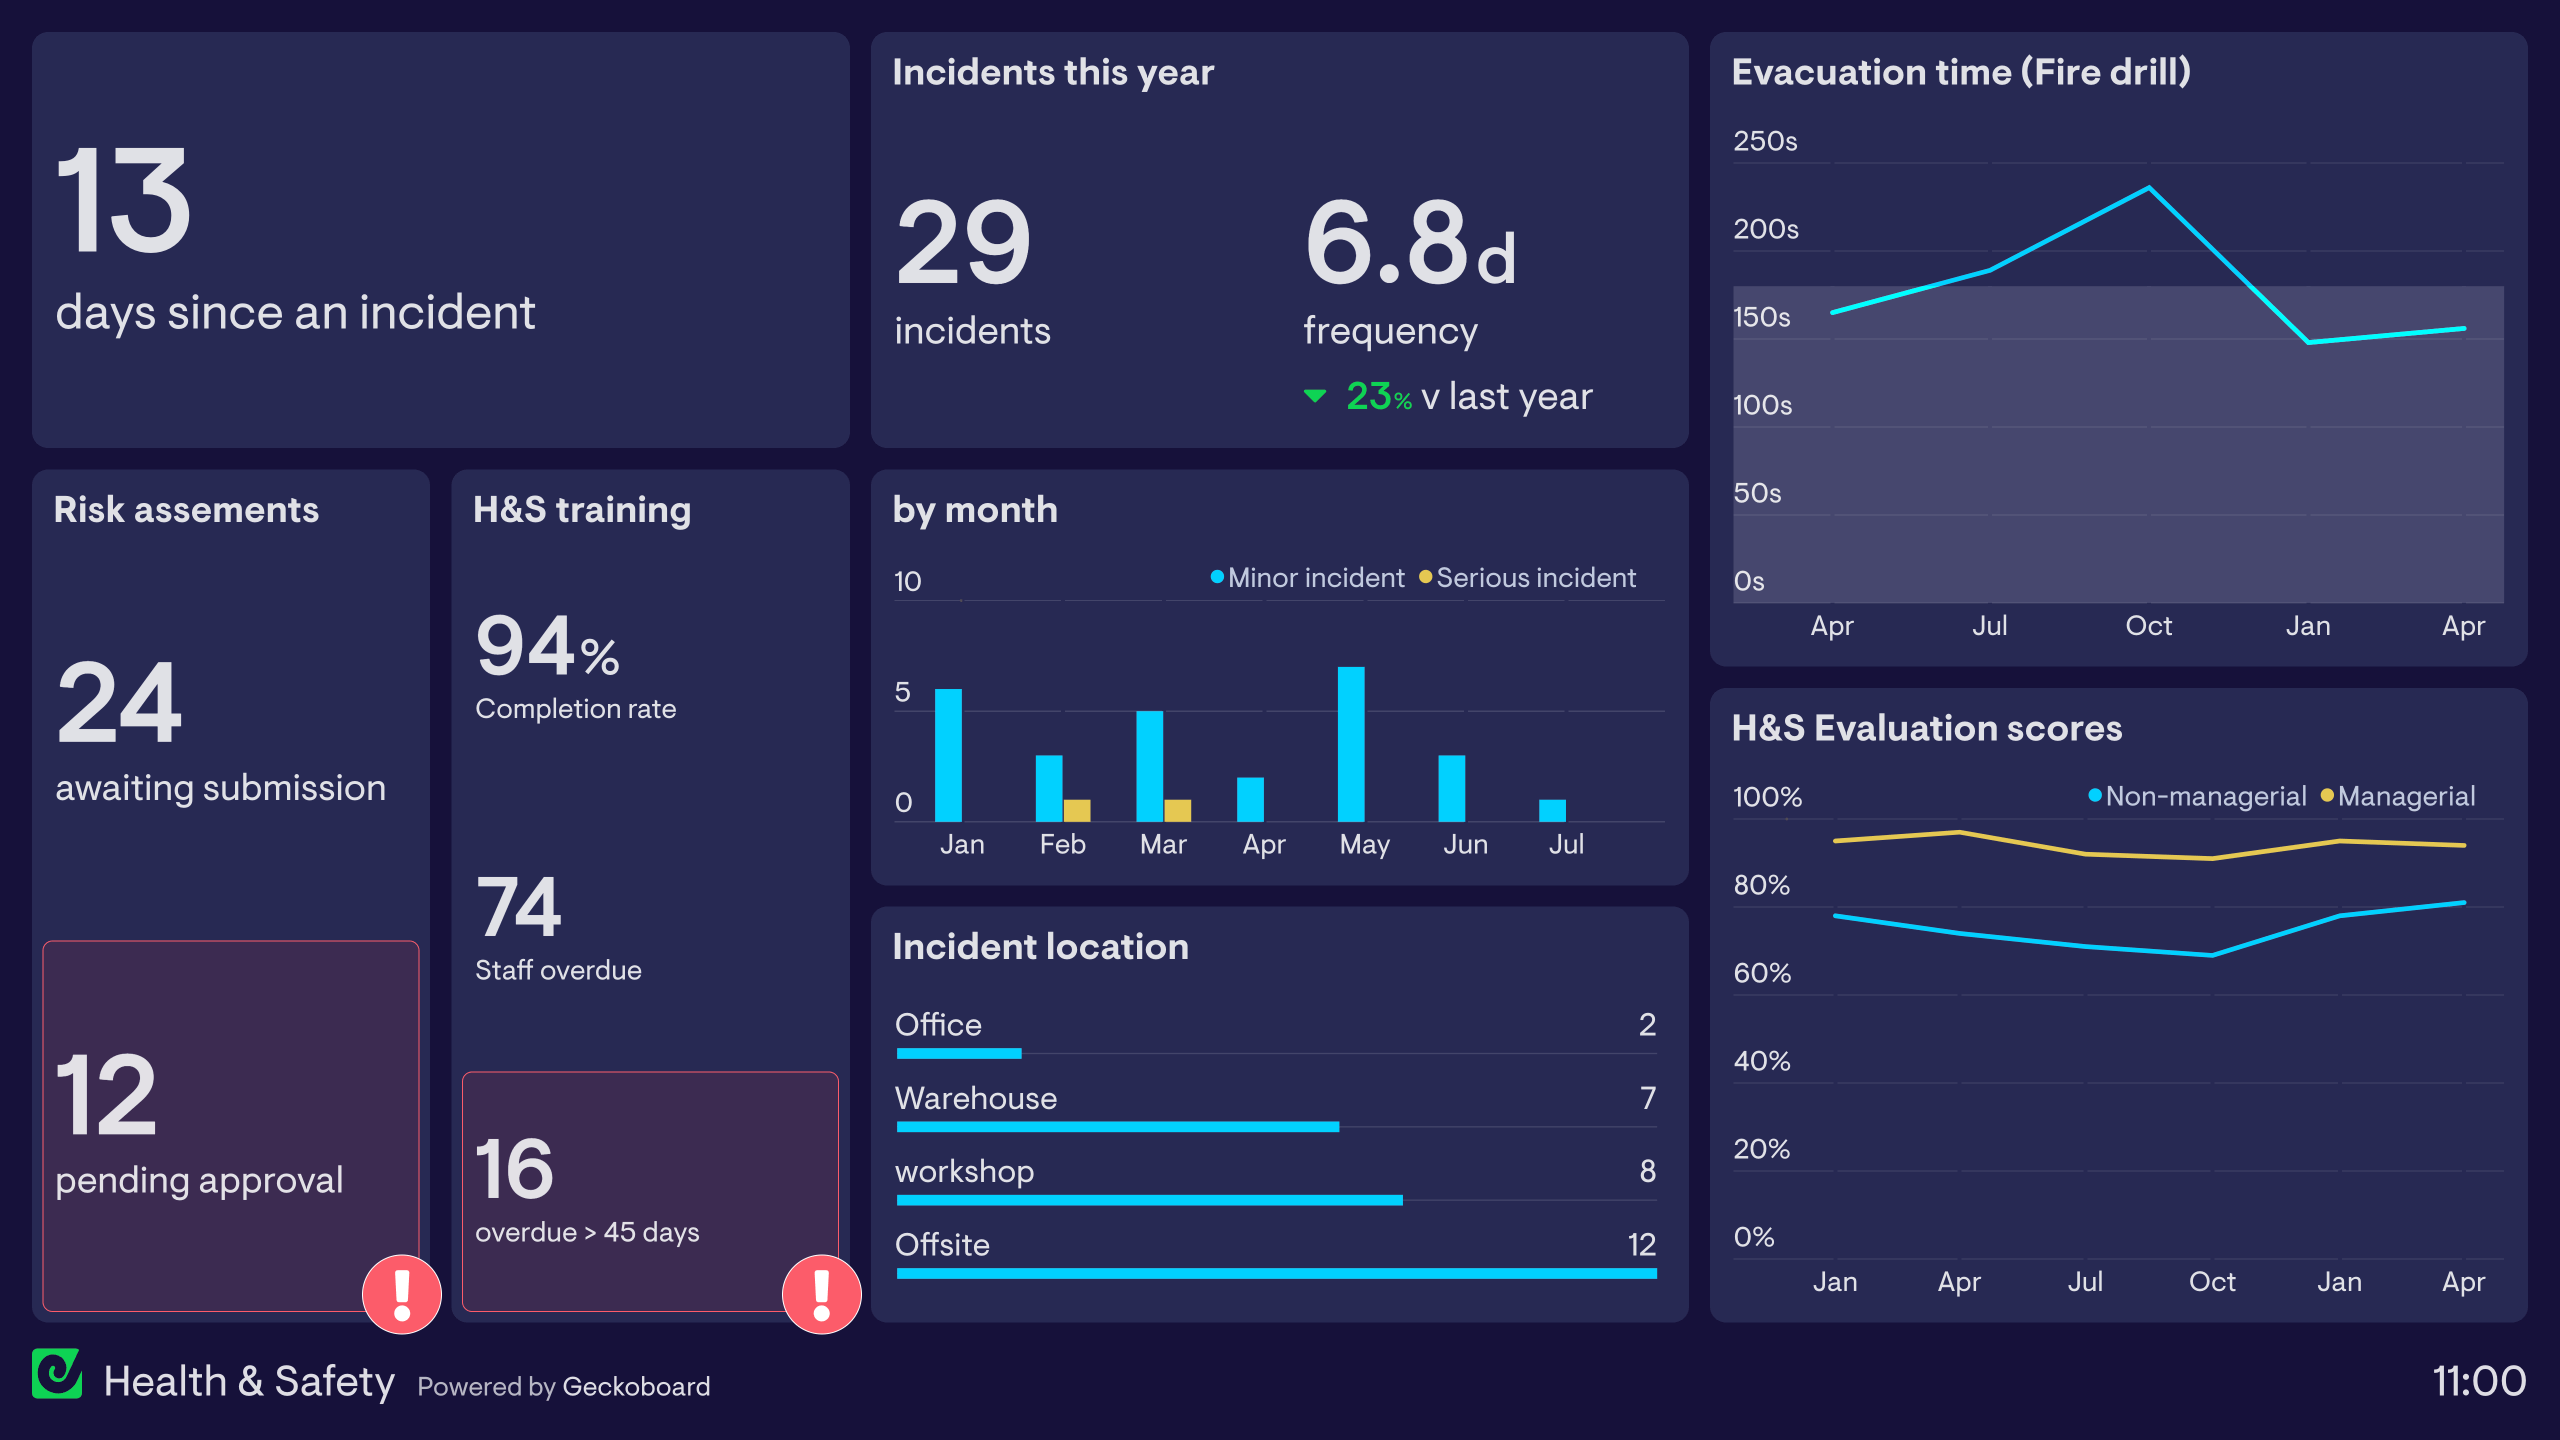
This dashboard monitors a variety of metrics related to Health and Safety in the company.
In part, the dashboard tracks how many incidents have occured, where they have a occured and how long it has been since an incident. An incident might include accidents that caused injuries, or even near misses where no injury occured. By tracking this metric, the organization can gain a better understanding of when and where accidents occur, prioritizing their efforts to prevent incidents in the future. Simultaneously, the dashboard also serves as a constant reminder to employees of the importance of observing Health and Safety regulations.
The Health and Safety lead is also using this dashboard to track whether or not important procedures are being followed, such as risk assessments being submitted and approved, and Health and Safety training being completed by employees. If these processes are not being followed, they will be able to see this instantly, and take action.
Finally, on the right-hand side of the dashboard, the Health and Safety lead is tracking performance metrics where long term goals have been set. This includes aiming to complete fire drill evacuations within a set time, and maintaining a good employee score on a regular, company-wide Health and Safety evaluation.
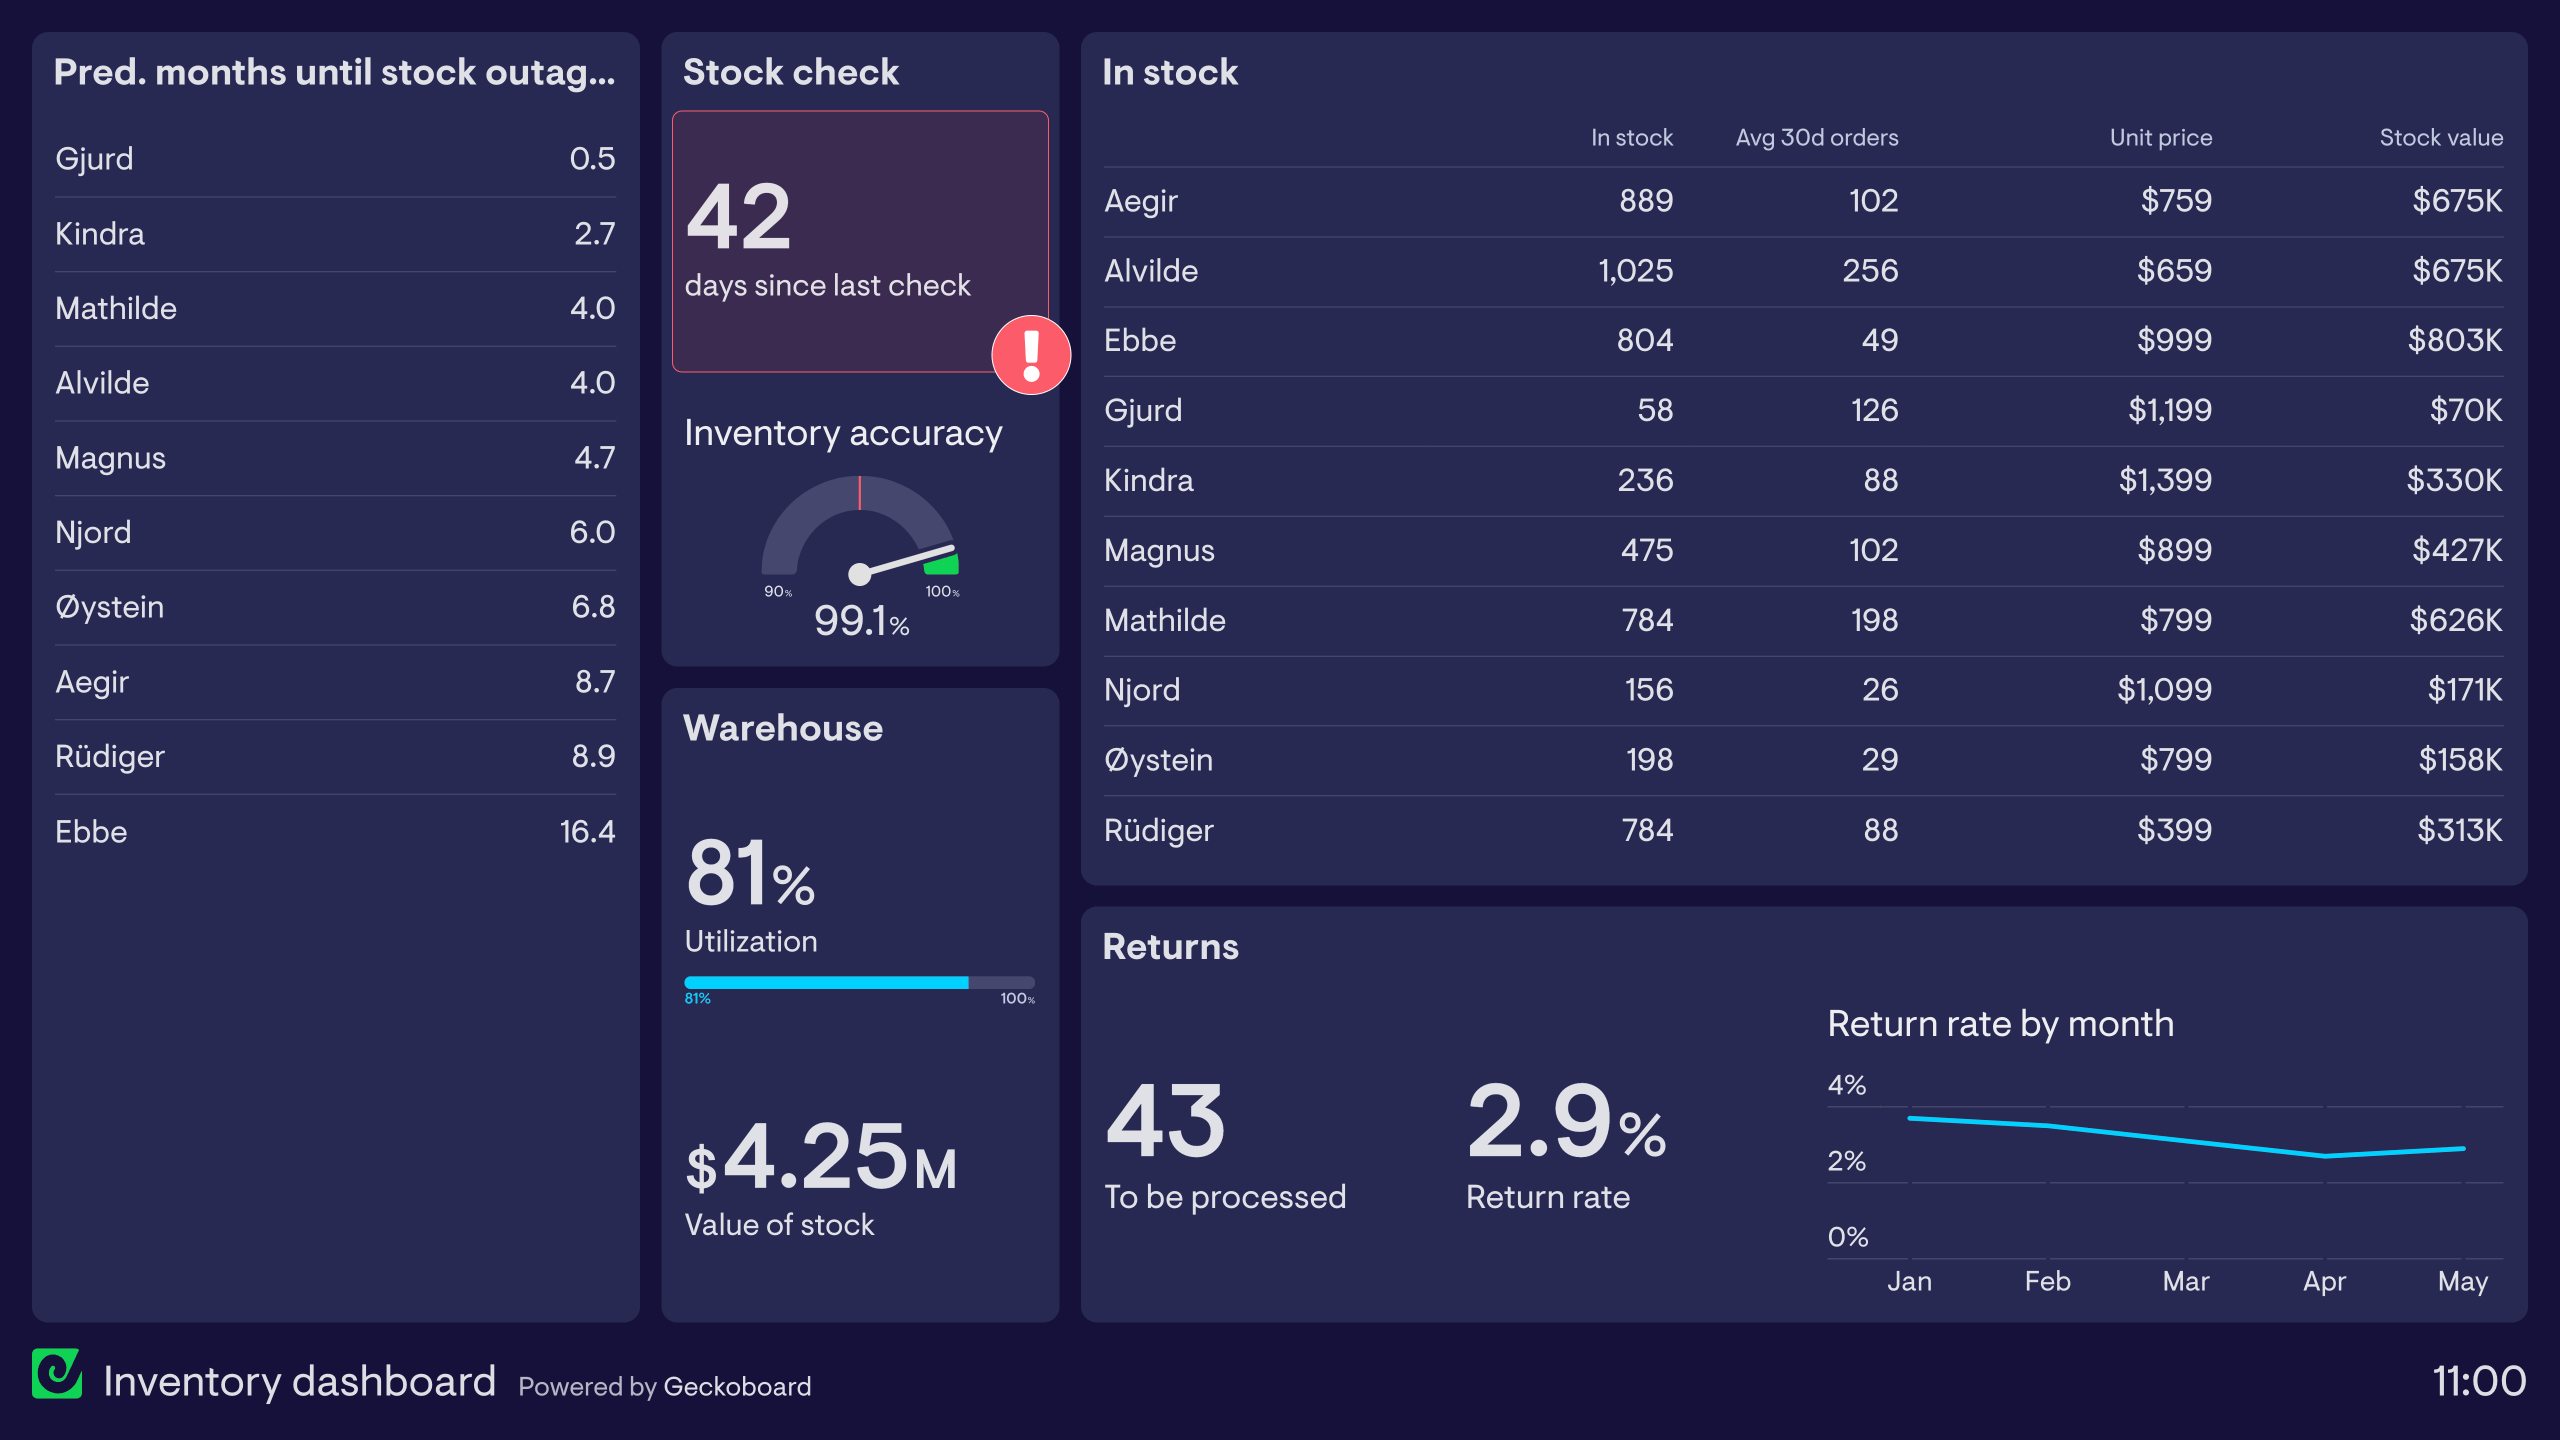
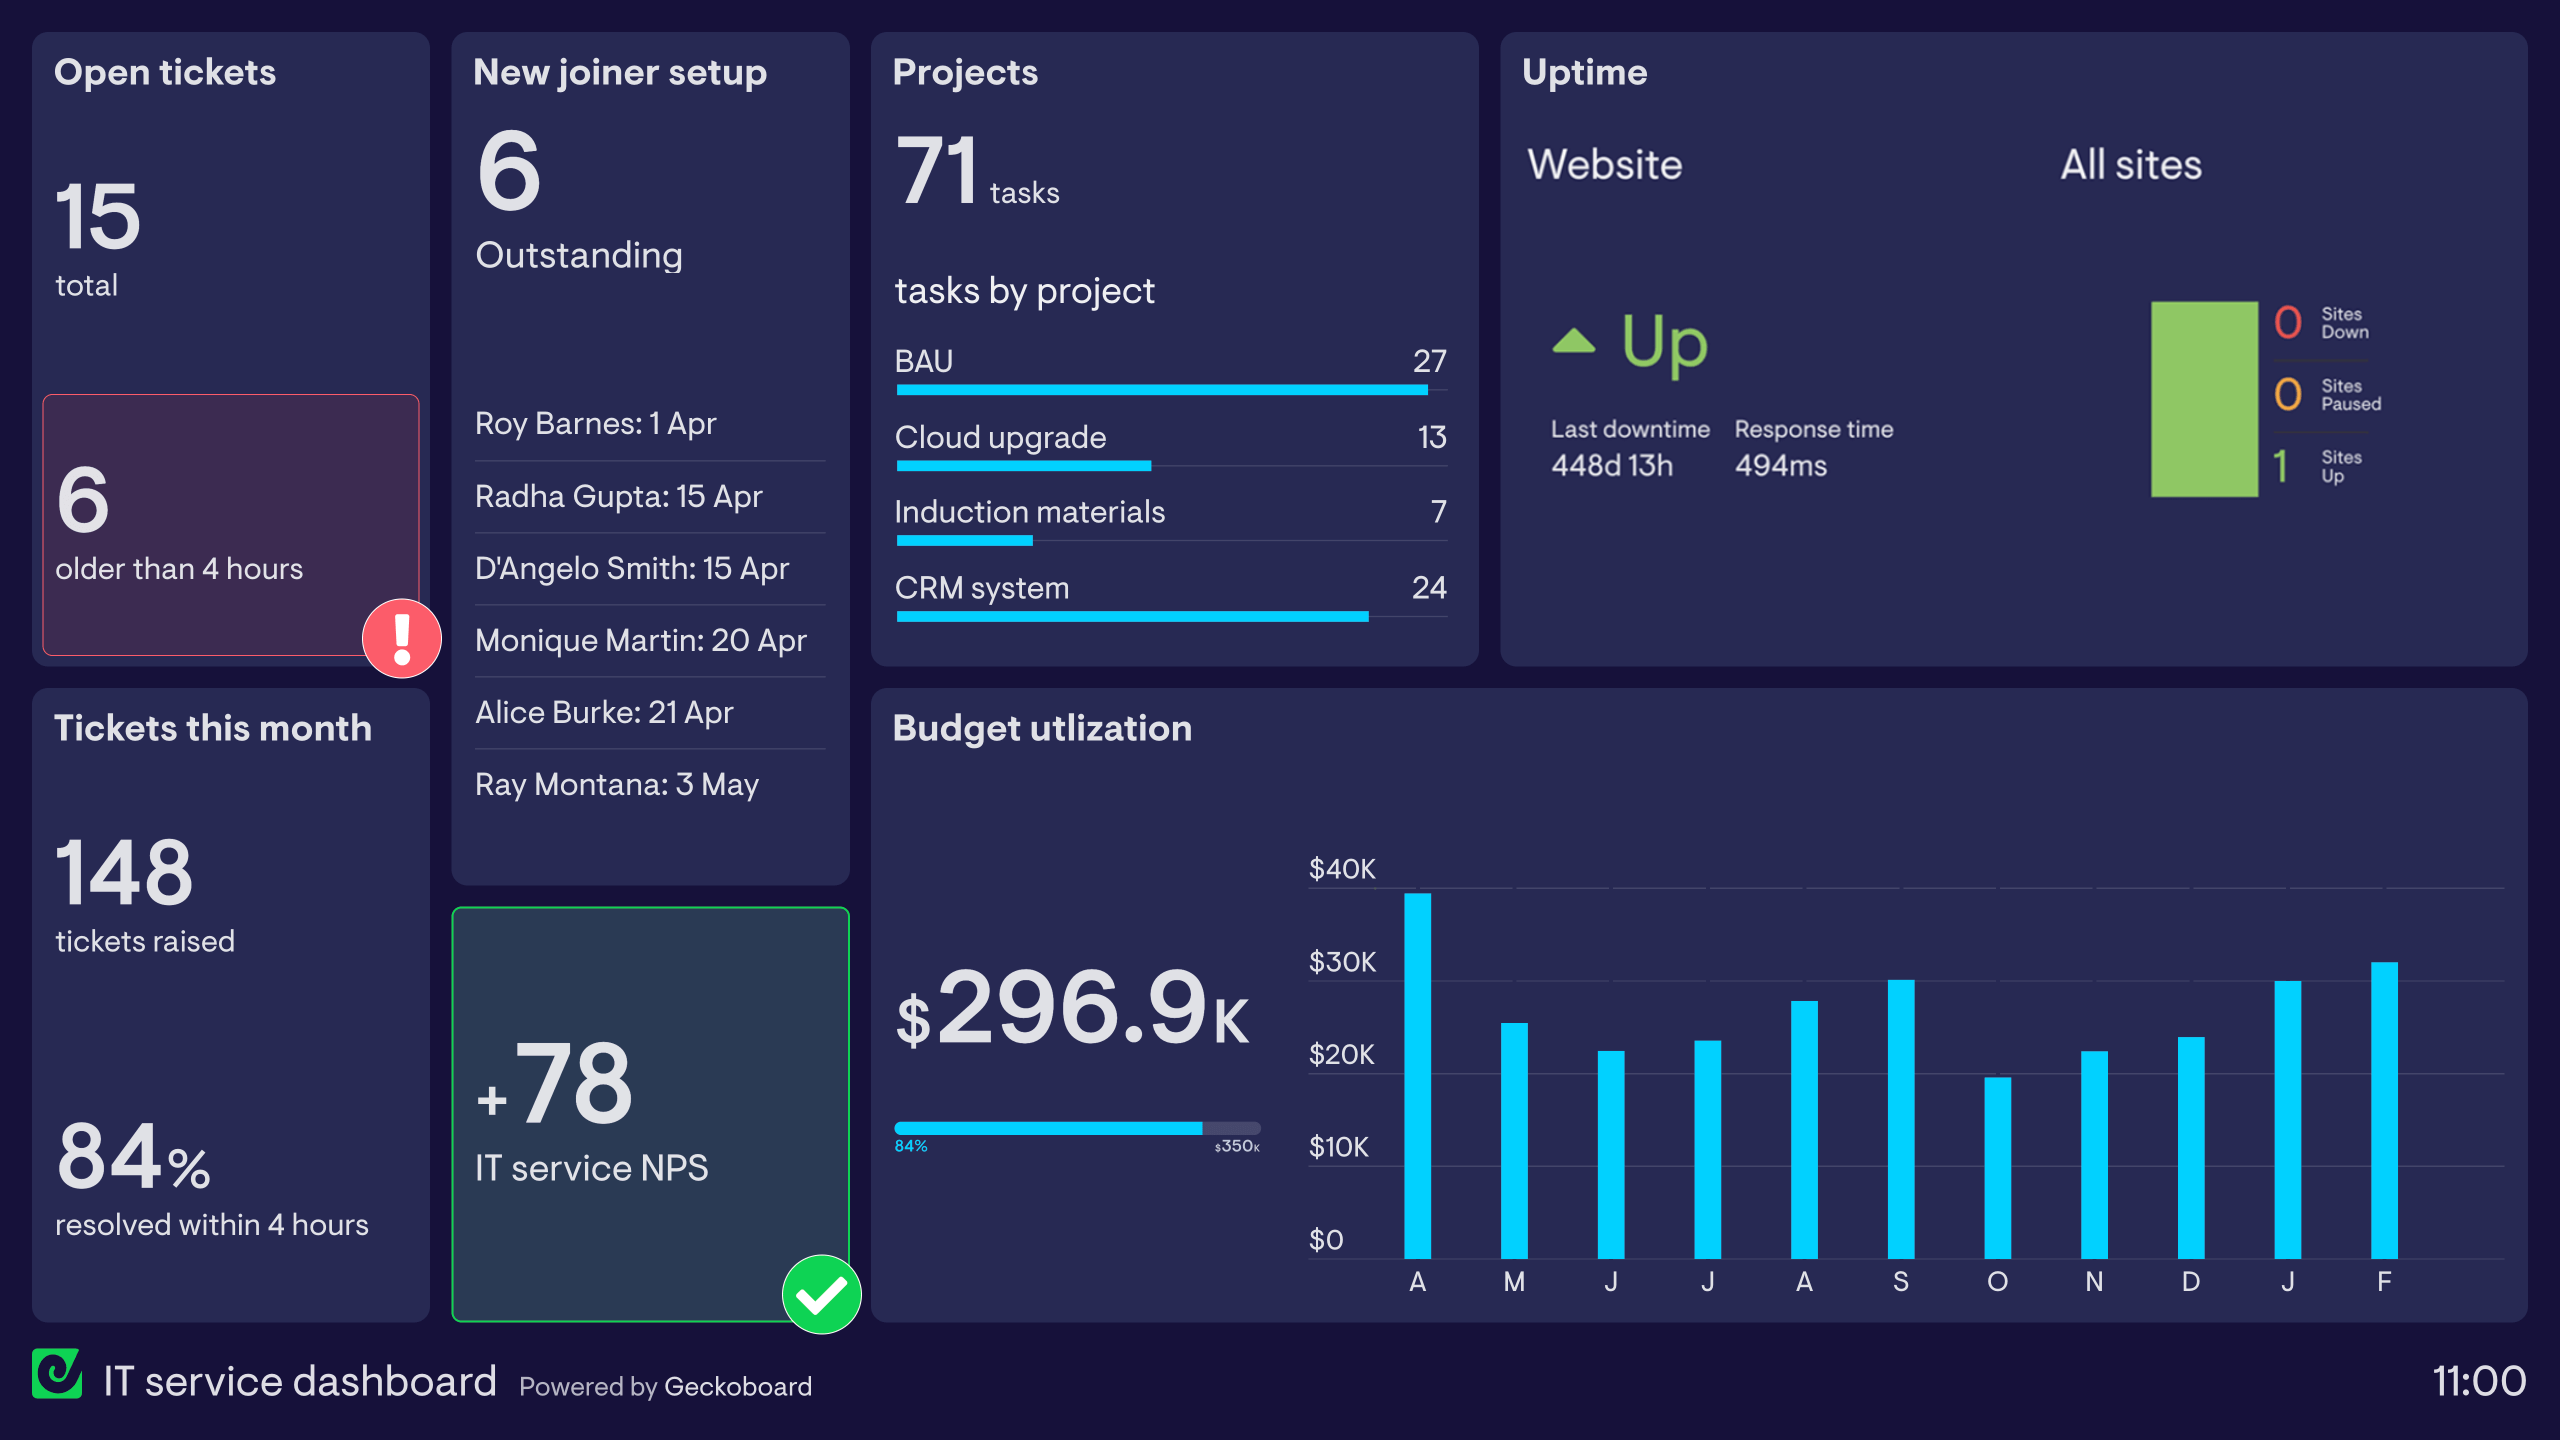
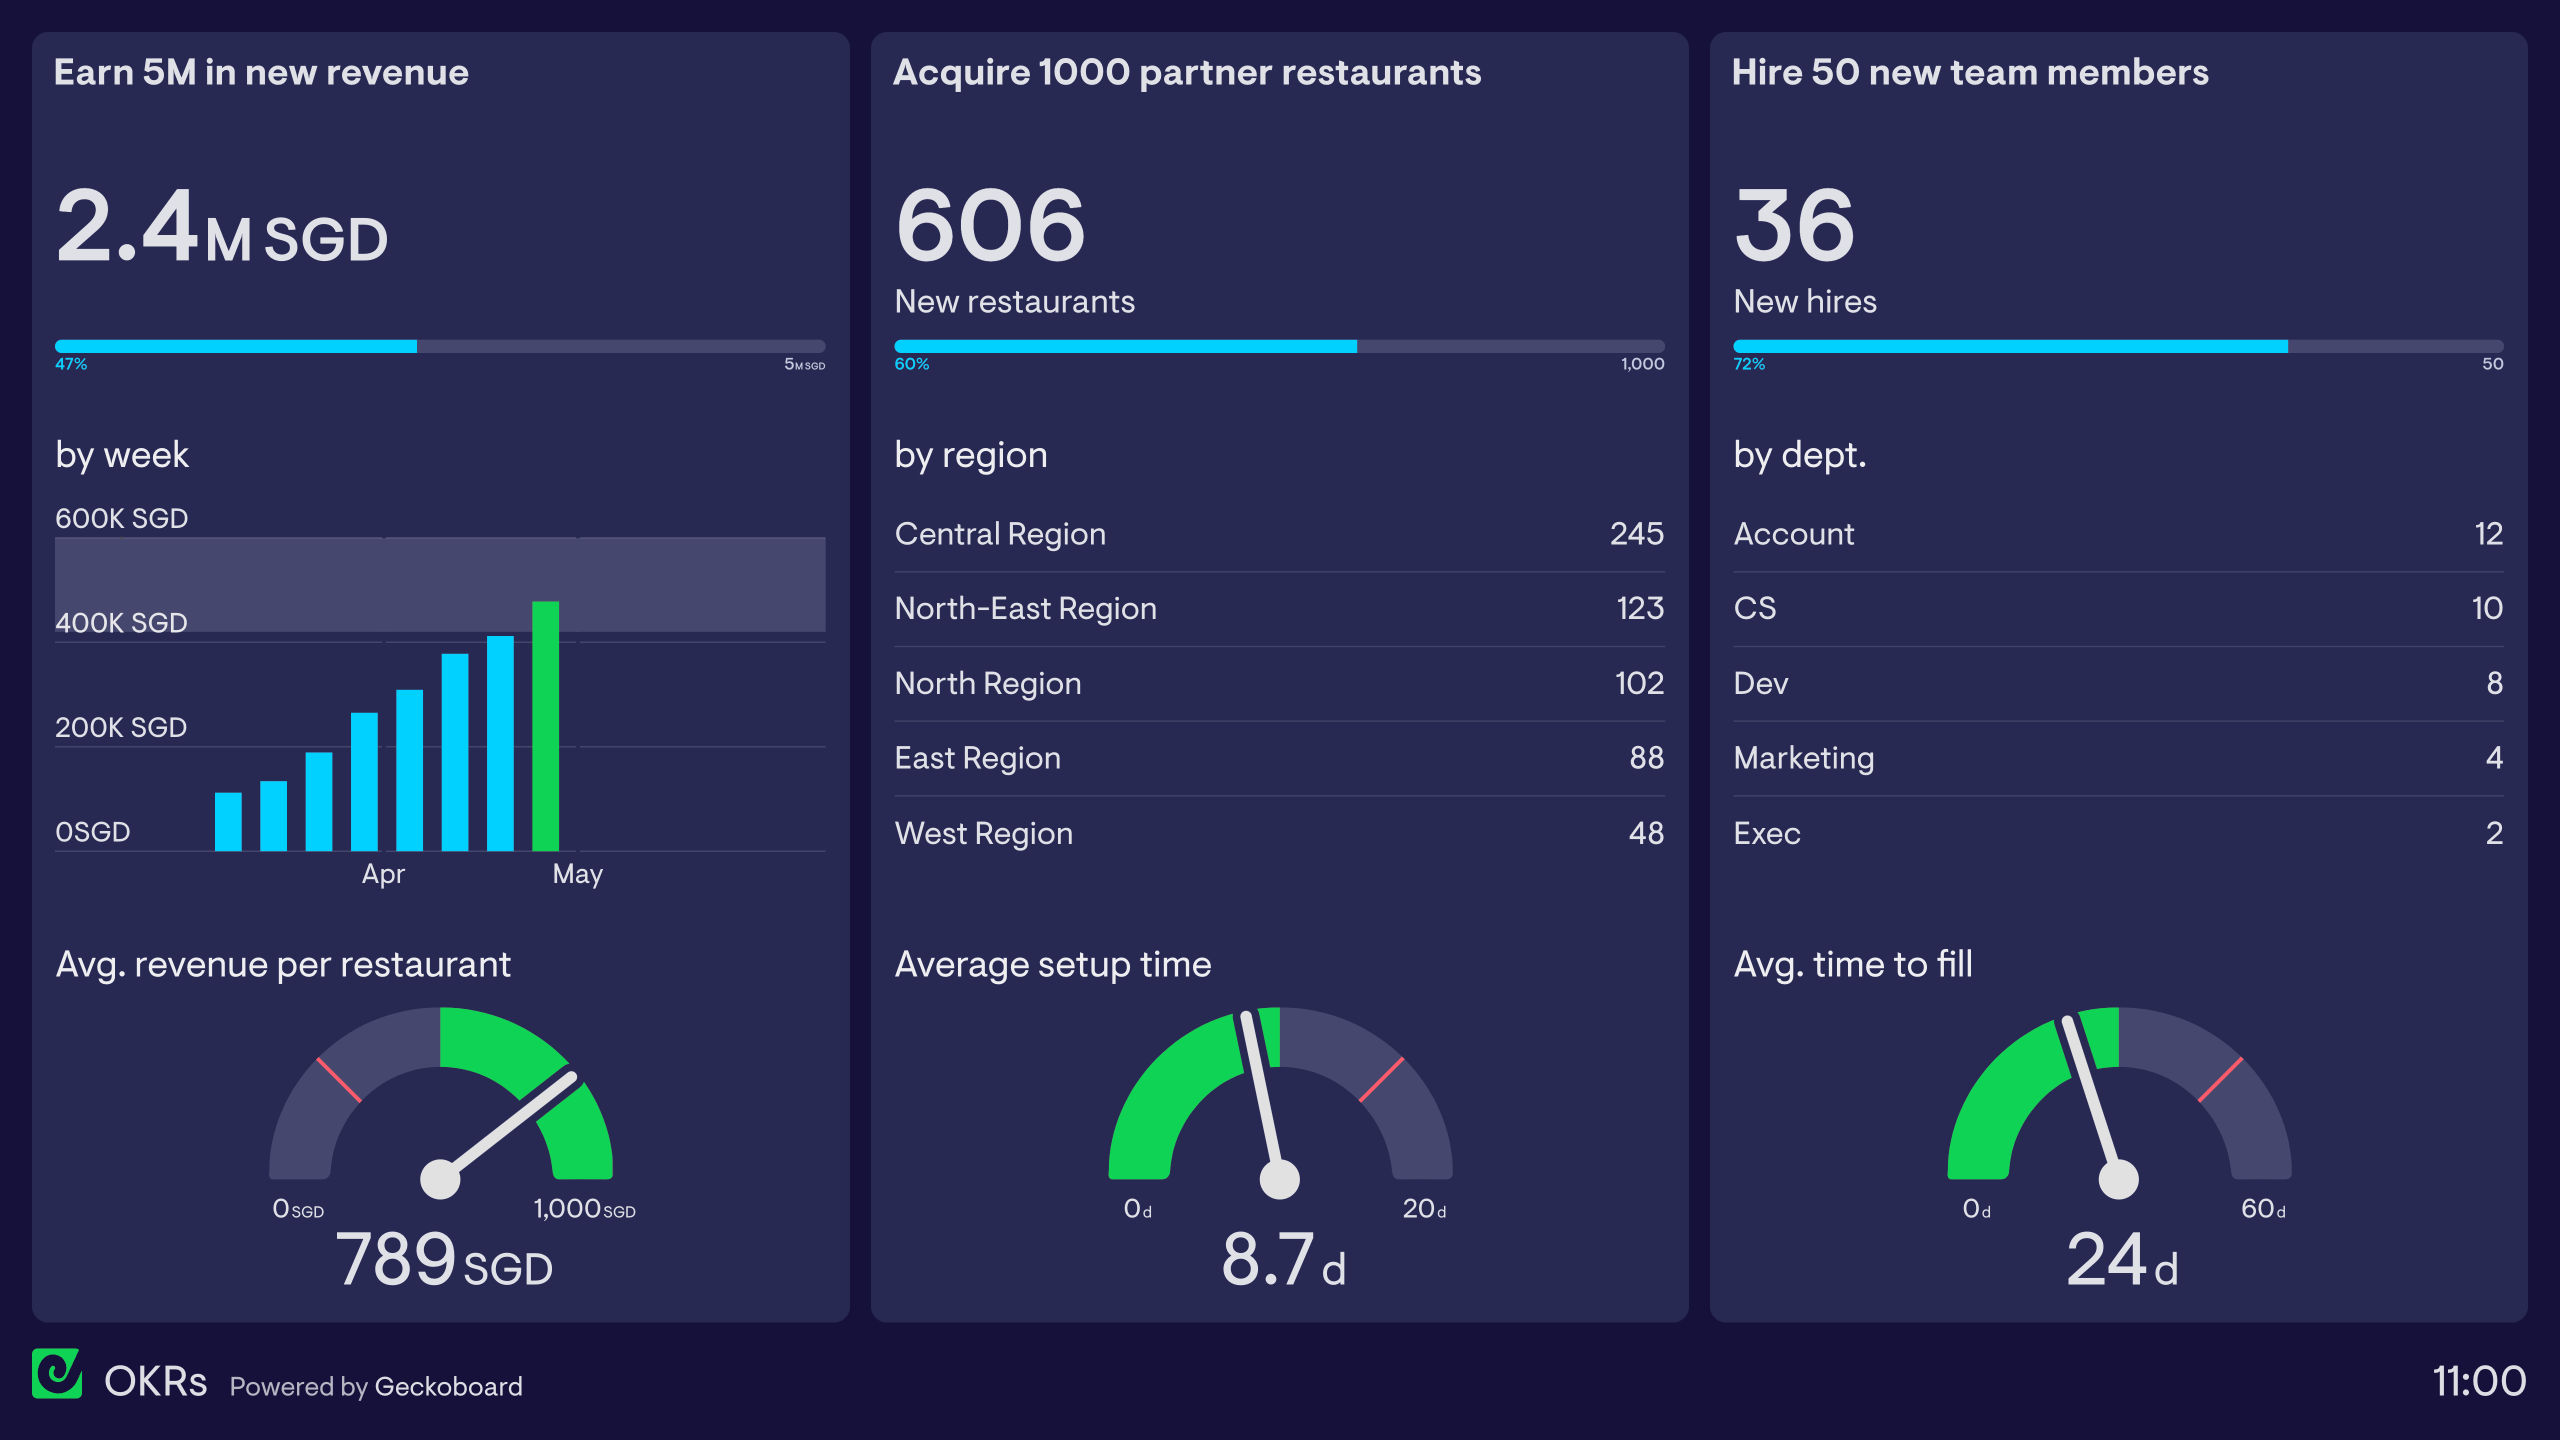
A health and safety dashboard gives operations managers and H&S teams a centralised view of incidents, compliance metrics, and safety targets across the organisation. It replaces manual log-checking and spreadsheet reporting with a live view that helps teams identify trends and act before minor issues become serious ones.
Geckoboard is a live dashboard tool that connects to spreadsheets, databases, and operational systems to give H&S teams a clear view of safety metrics. Dashboards can be displayed on screens around a site or shared with leadership as a regular automated snapshot — removing the need for manual reporting.
Common metrics include incident count, near misses, days since last incident, training completion rate, audit scores, and corrective actions outstanding. Teams often track these by site, department, or team to identify where risks are highest.
Building a custom health and safety dashboard is straightforward with Geckoboard's dashboard builder. Connect Google Sheets, SQL databases and custom data sources, or spreadsheet imports from your H&S management system to bring incident data into Geckoboard, then pick your metrics and build the view you need. Share with your team as a TV dashboard, shared link, or scheduled snapshot. Start a free trial or learn more about how Geckoboard works.
Use it to display safety metrics where staff can see them, a shared screen approach that reinforces a safety-first culture. You can also send leadership scheduled snapshots of compliance and incident trends instead of assembling a manual report from the H&S team.