Sustainability dashboard examples
A sustainability dashboard tracks and communicates progress toward the environmental and social commitments a company has made — carbon, ESG targets, waste, and more. It turns long-term pledges into metrics the organisation can monitor throughout the year, not just at reporting time.
Sustainability dashboard
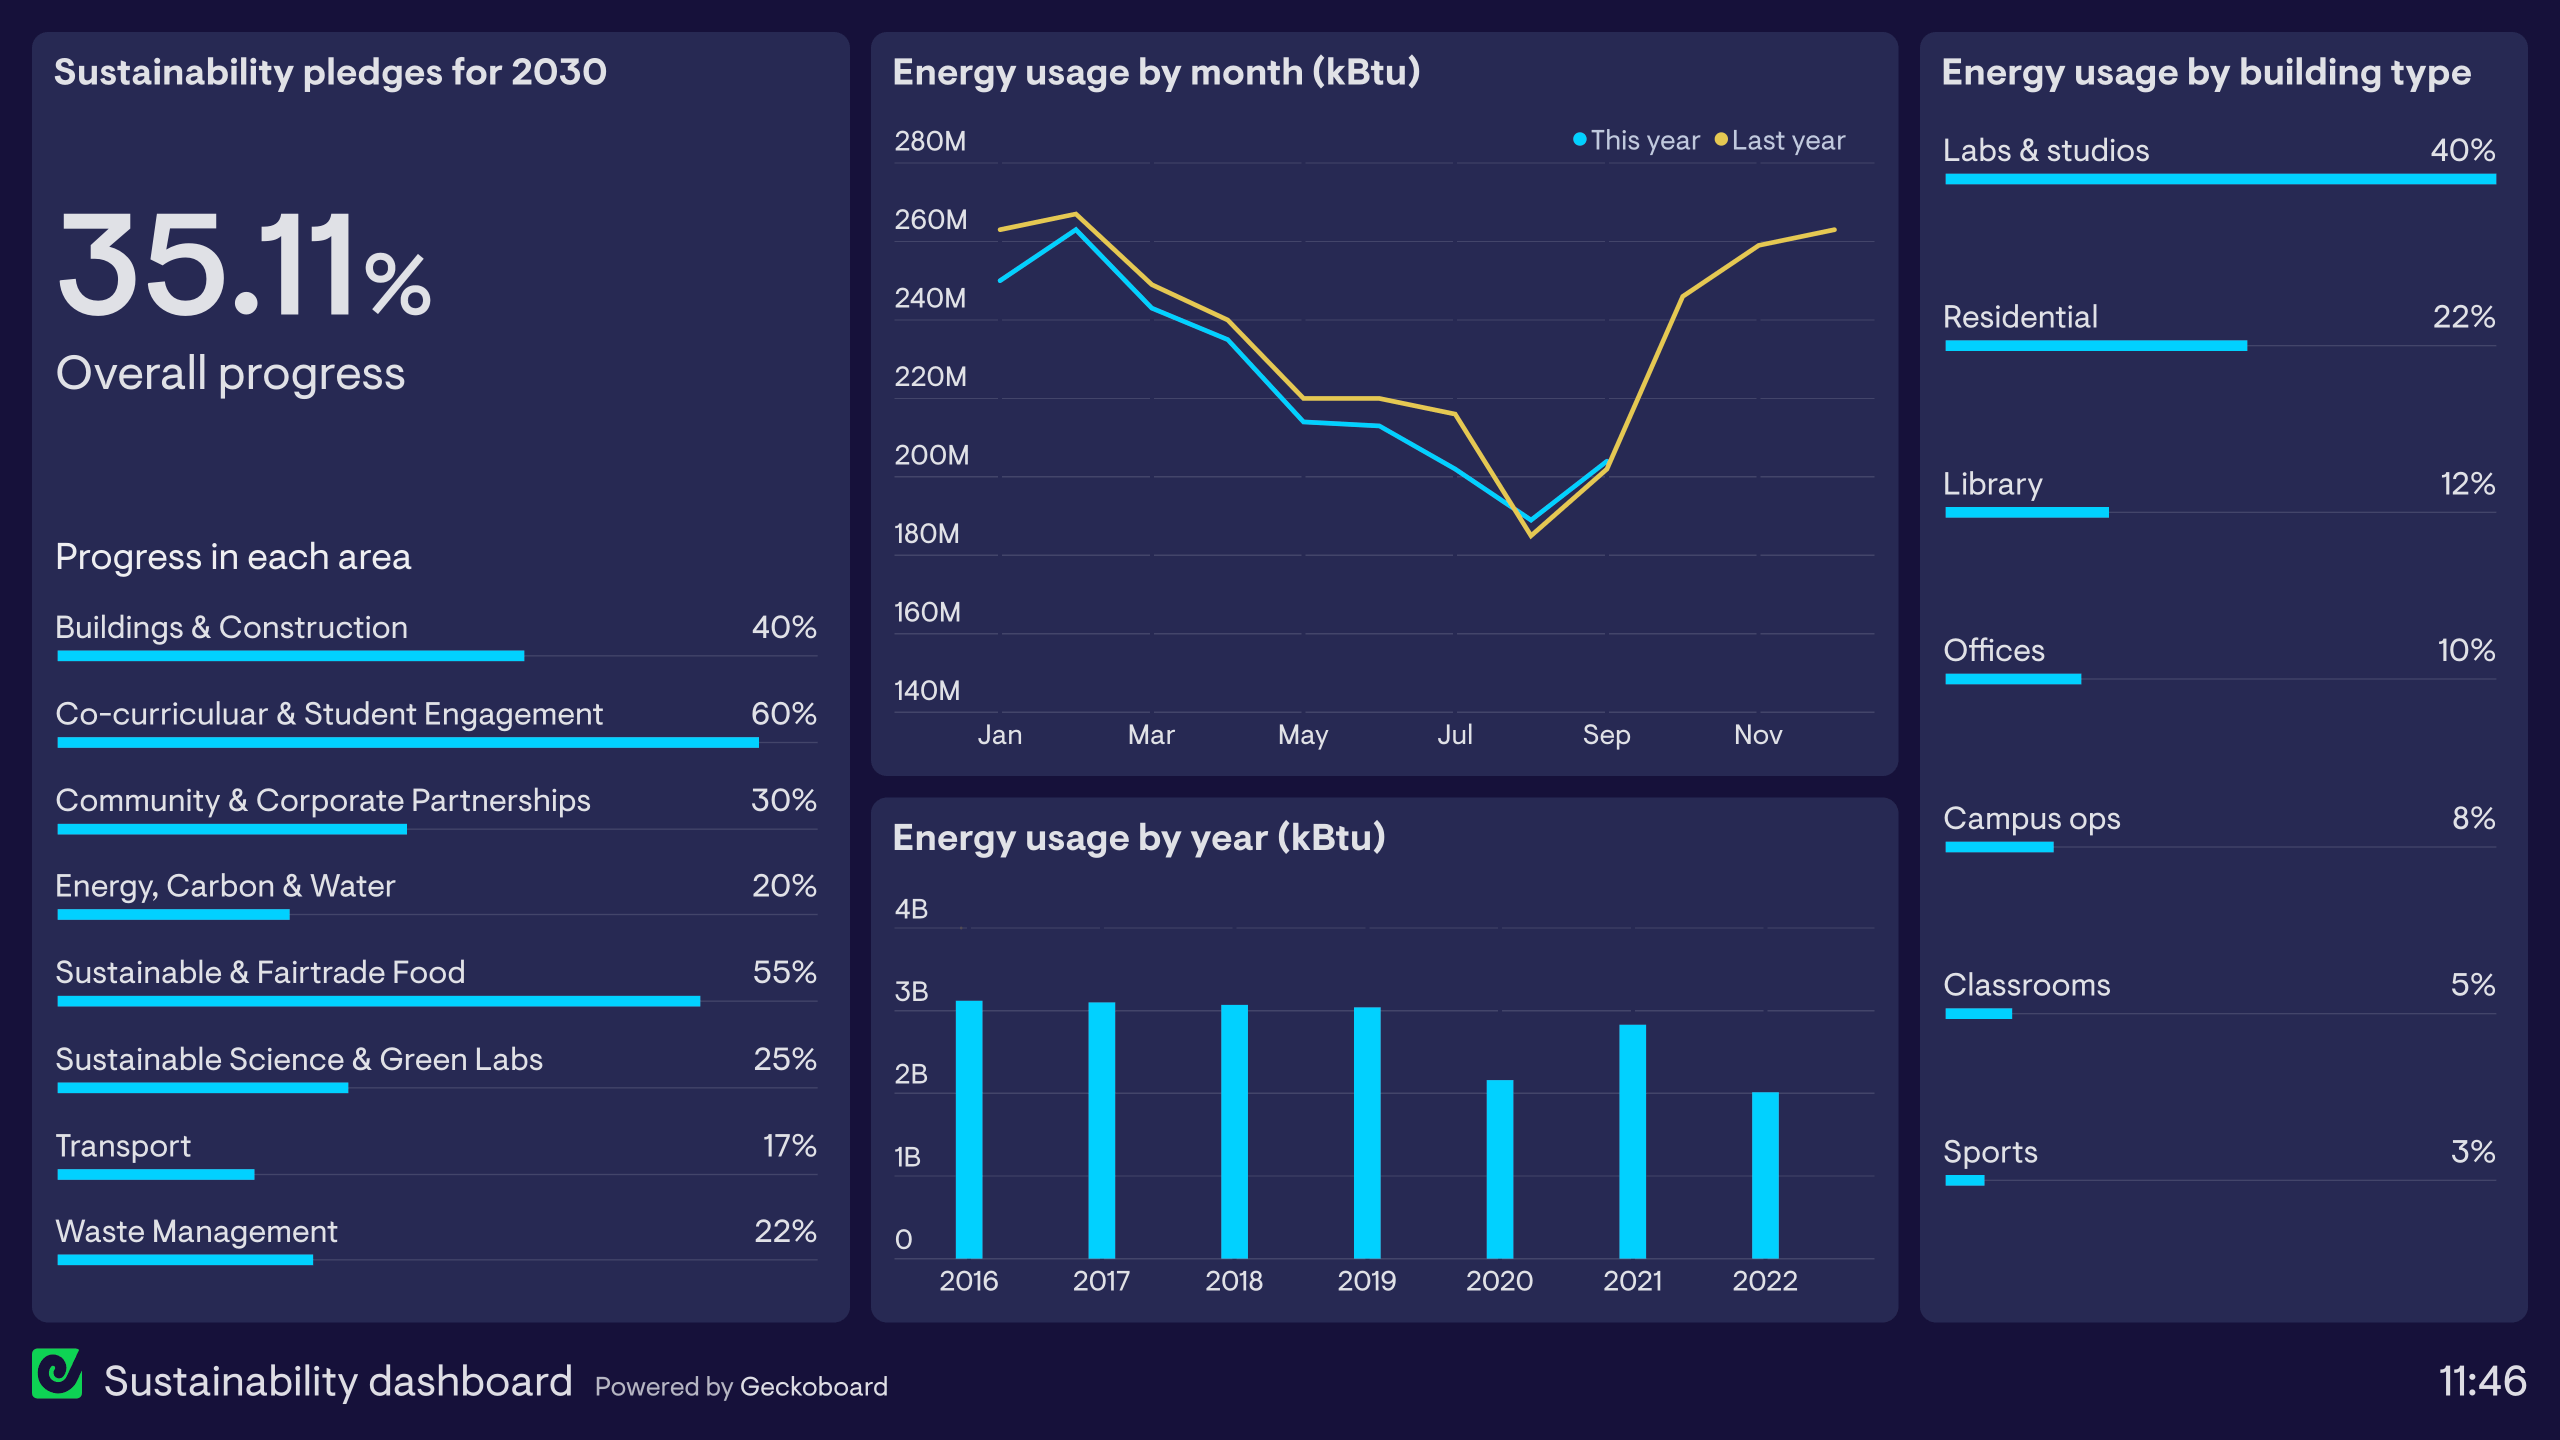
This dashboard has been created by a university who has set several sustainability goals, to be completed by 2030. With such a wide stakeholder community including students, staff and local organizations, the university needed a simple way to communicate their progress, online.
The dashboard includes two major sections. On the left-hand side, the university has aggregated their 2030 goals into eight major areas. Here, they can show how much progress has been made in each area, as well as progress overall. (Naturally, the dashboard would be accompanied by further materials which outline further details of each target area.)
The remainder of the dashboard breaks down the university’s energy consumption by time and building type. Not only does this help the university to communicate progress they are making in terms of energy consumption, it also helps create awareness about energy usage within the wider university population. This helps people understand how they can contribute to this goal by reducing their own energy consumption.
Browse other popular examples
A sustainability dashboard gives operations and ESG teams a live view of environmental and sustainability metrics — tracking energy use, carbon emissions, waste reduction, and progress against sustainability targets. It helps businesses make their sustainability commitments transparent and track whether they're on course to meet them.
Geckoboard is a dashboard tool that connects to spreadsheets, databases, and operational systems to give sustainability teams a live view of environmental and social metrics. It helps organisations track progress toward commitments throughout the year — not just when reporting season arrives.
Common metrics include energy consumption (by site or process), CO2 emissions, waste diverted from landfill, water usage, renewable energy percentage, and progress to sustainability targets. Teams often compare current performance against a baseline year.
Building a custom sustainability dashboard is straightforward with Geckoboard's dashboard builder. Connect Google Sheets, SQL databases and custom data sources, or spreadsheet imports from your energy management or ESG reporting system, then pick your metrics and build the view you need. Share with your team as a TV dashboard, shared link, or scheduled snapshot. Start a free trial or learn more about how Geckoboard works.
Use it to display sustainability progress on a shared screen, making it easy for the whole organization to see how the business is performing against its environmental goals. You can also send leadership and investors scheduled snapshots of ESG metrics instead of assembling a report by hand.