Realtor dashboard examples
Realtor dashboards come in two forms: monitoring dashboards that keep important metrics visible as they change, and performance dashboards that track individual and team progress against targets. Both serve the same goal — keeping realtors focused on the numbers that drive results, not just the deals they're working on.
Brokerage team dashboard
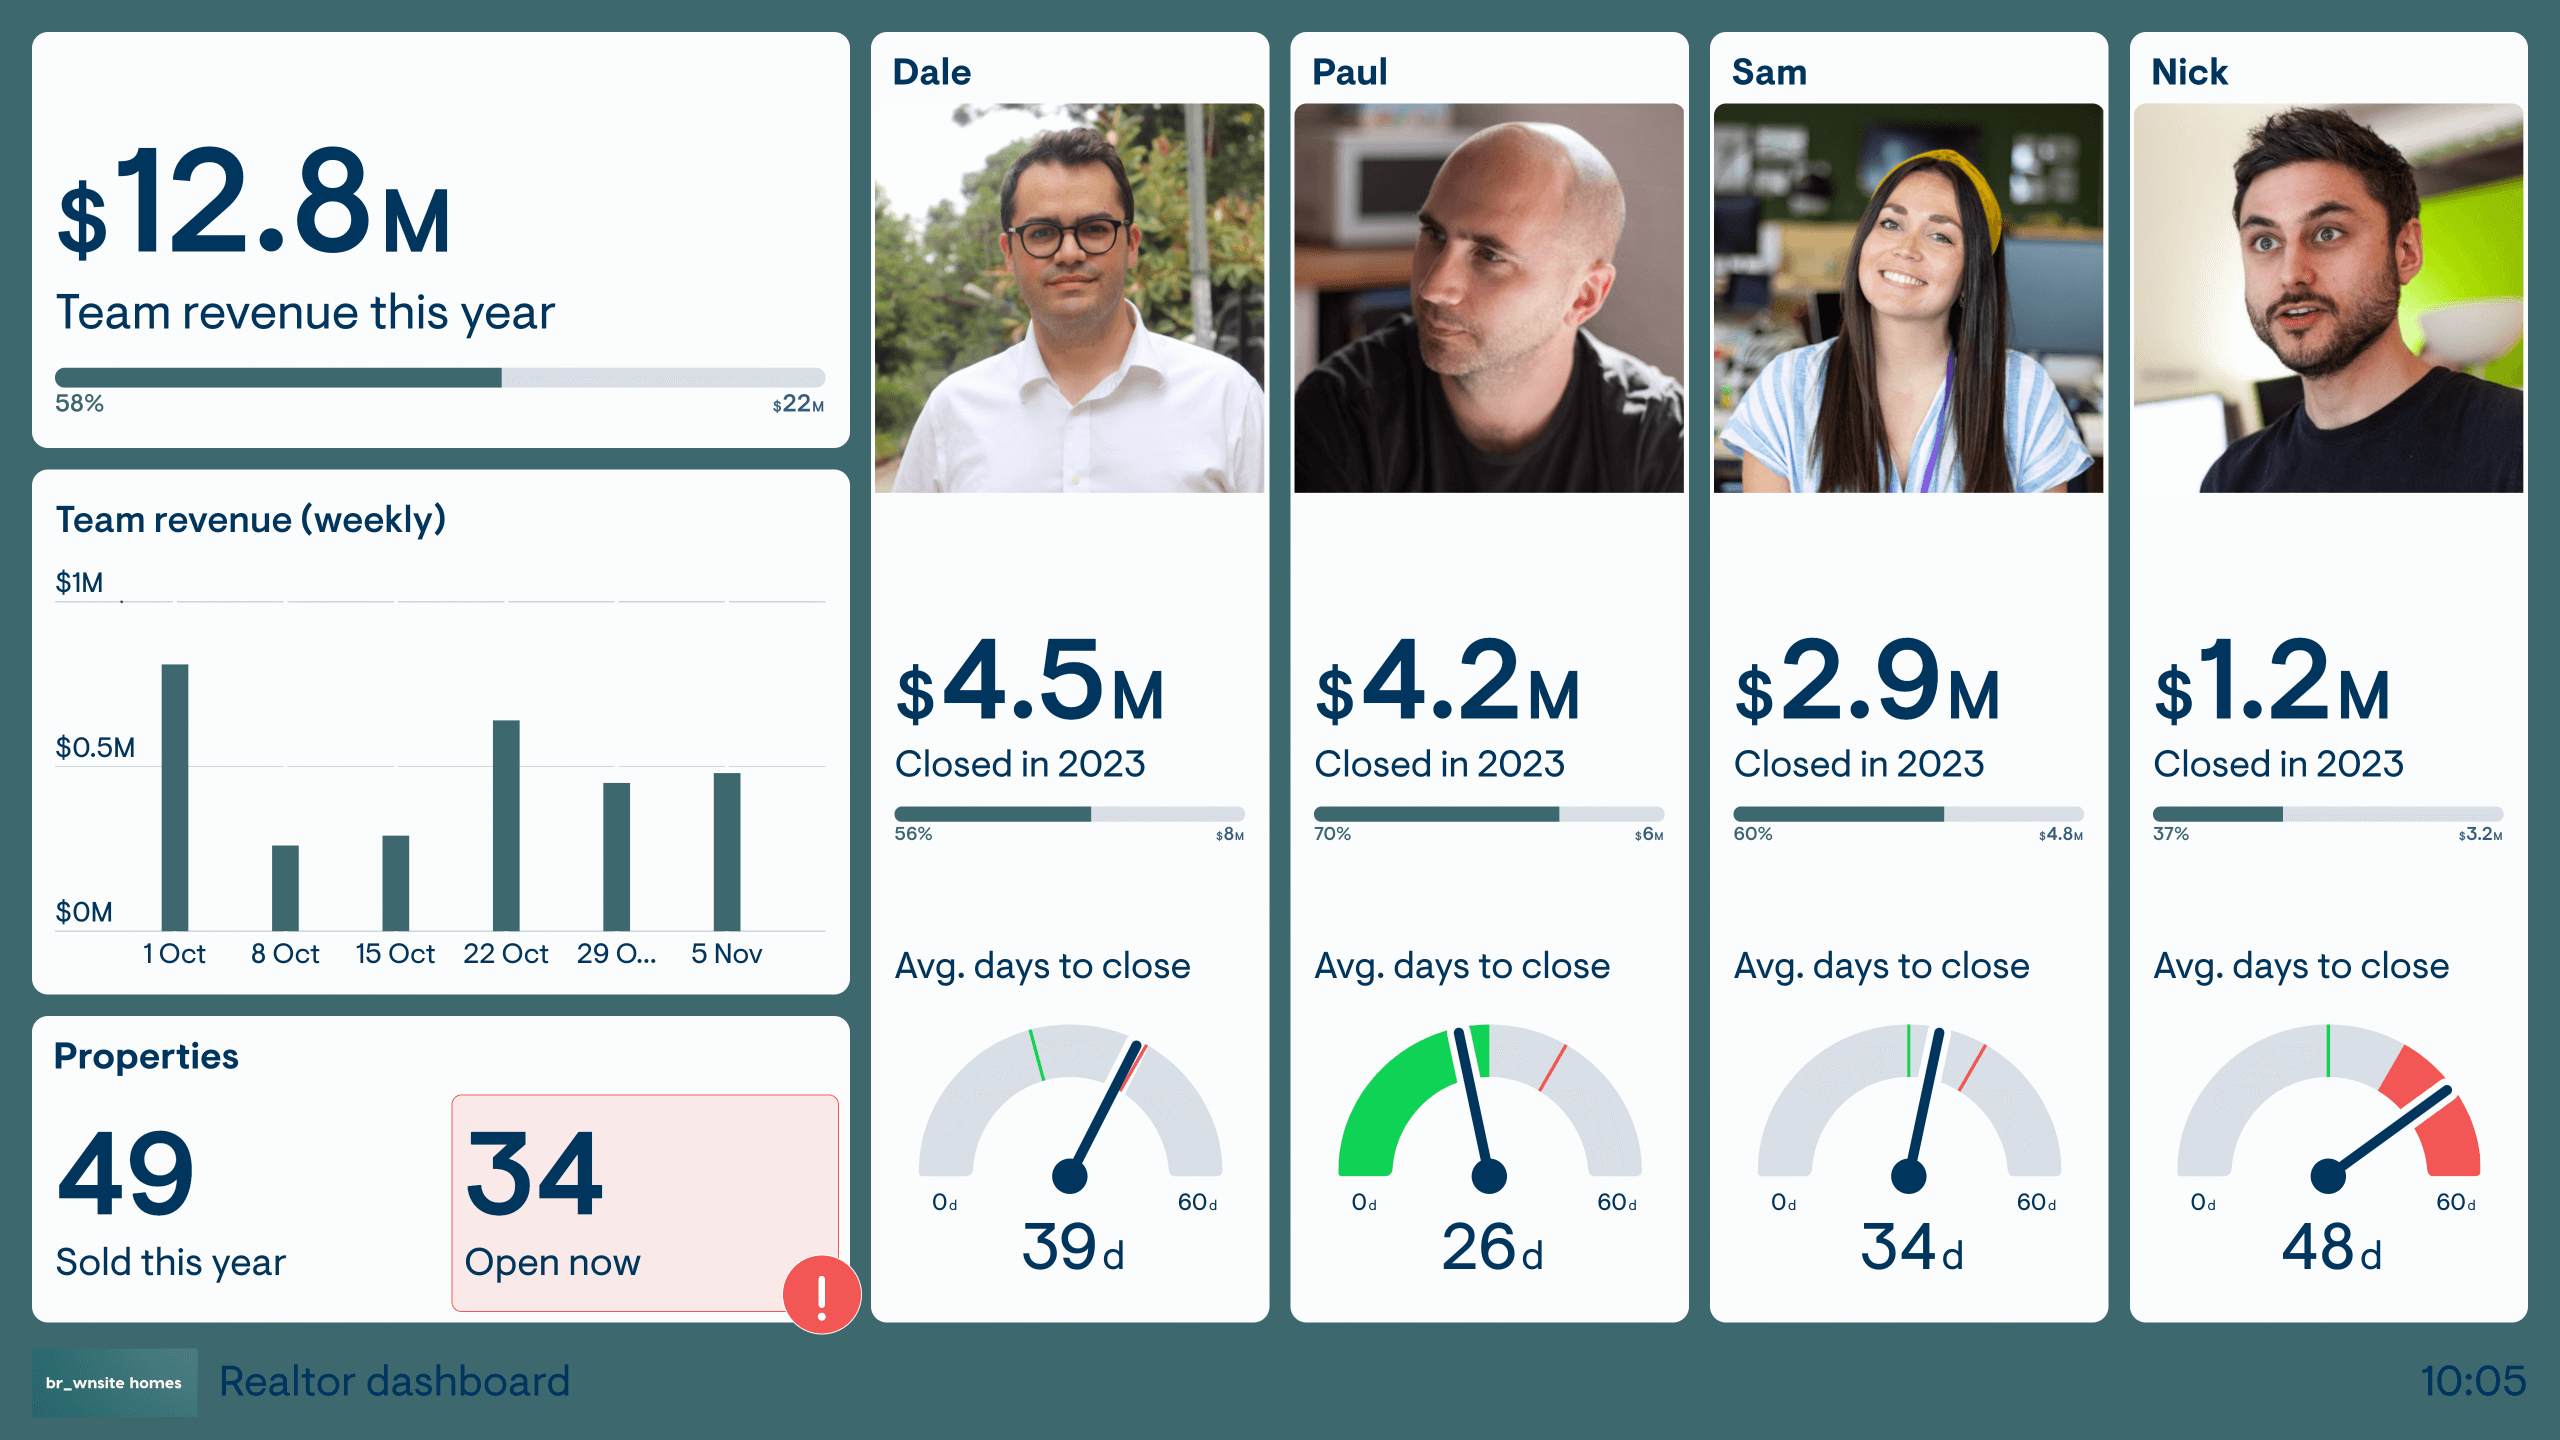
This dashboard has been created by the head of a small brokerage team. Even though different members of the brokerage have different revenue targets, the percentage target visualization creates a level playing field where the realtors can engage in friendly competition.
Because the realtors can physically see their headshot next to their performance metrics, up on a TV screen, it can act as a powerful motivation tool – to strive to do better. It also helps realtors who are performing less well. They naturally start to ask the right questions – “Why am I not performing as well as X person?” These questions form a great starting point, where coaching and personal development can begin.
The dashboard also creates the opportunity for the team leader to constantly reinforce metrics they think are strategically important. Everyone cares about revenue, but by also visualizing secondary KPIs like “Average Days to Close”, the leader can build a culture where the team focuses on the right things.
New development: sales dashboard
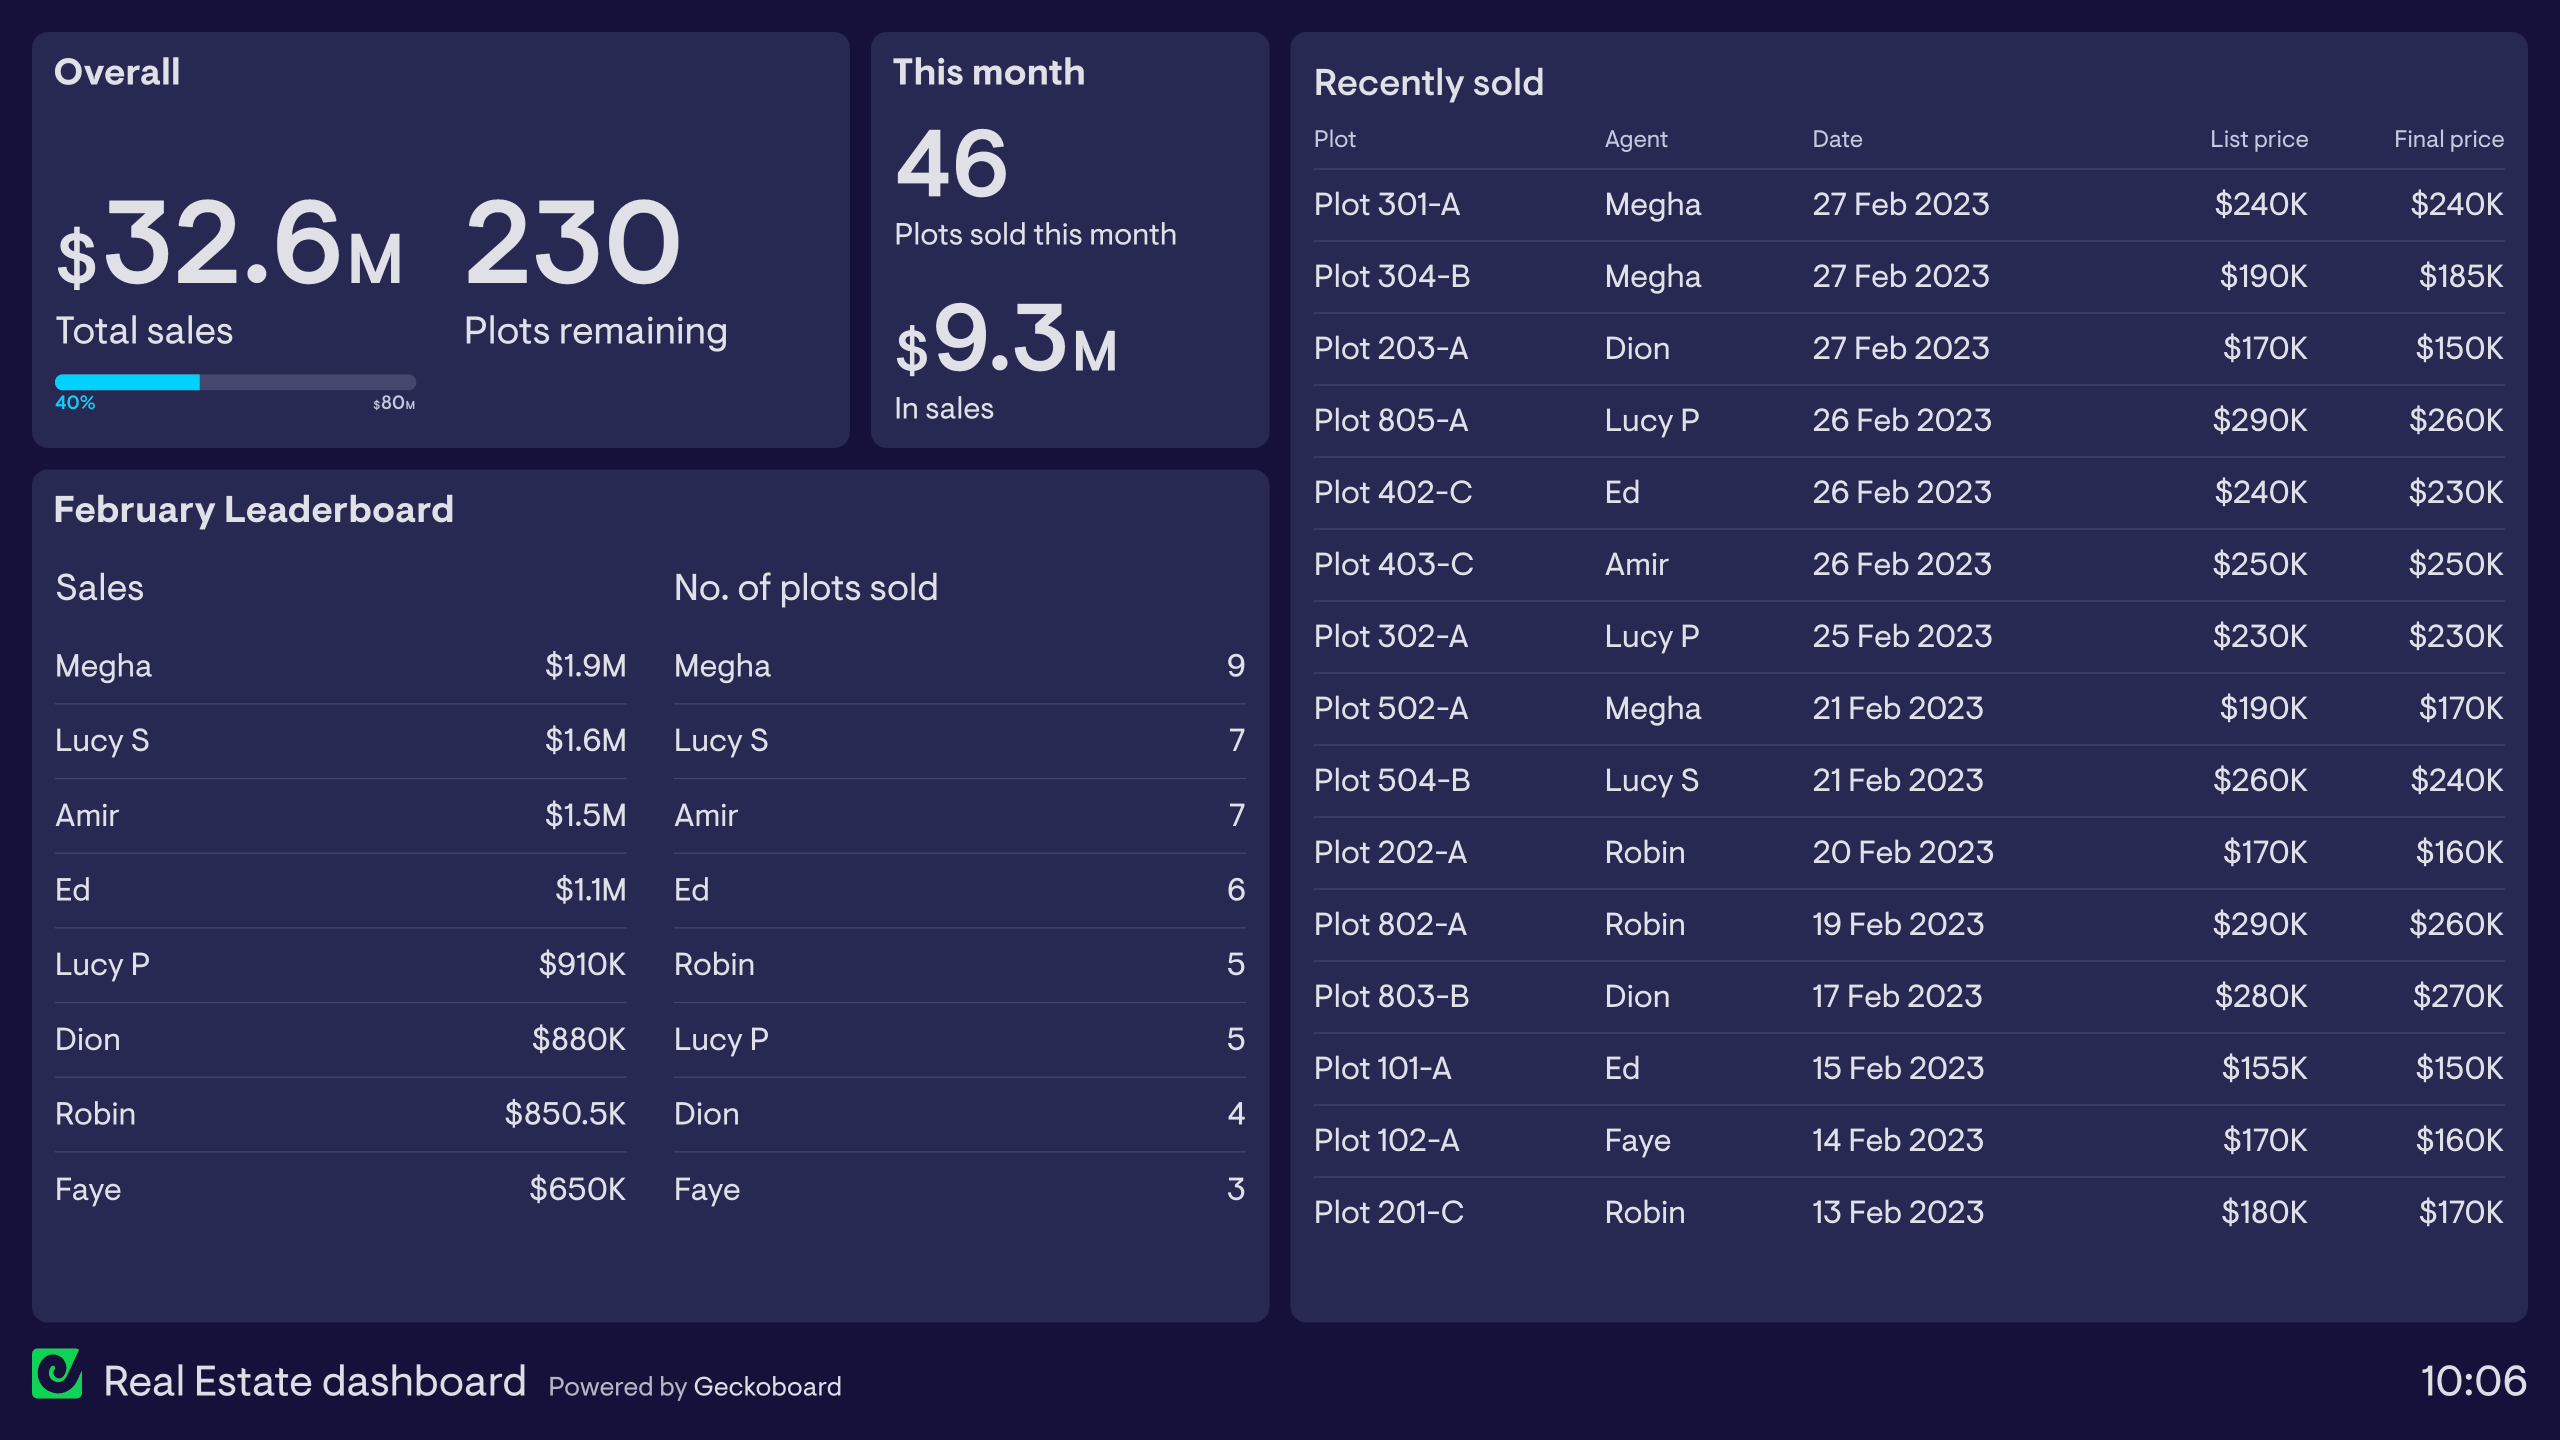
This dashboard has been designed to support a team of realtors who are selling apartments in a new development. In part, the dashboard acts as a performance dashboard; it includes a leaderboard, which promotes friendly competition between realtors.
However, the dashboard also acts as a monitoring dashboard, providing a live feed of recent sales – including who sold which plot and at what price. In these types of Real Estate scenarios, deals can move quickly. And the dashboard allows the team to stay informed about what’s recently changed.
Browse other popular examples

A realtor dashboard gives real estate brokerages and sales teams a view of listings, deal progress, agent activity, and revenue targets in one place. It's used by team leaders and brokerage managers to track performance across agents and developments without chasing individual updates.
Geckoboard is a live dashboard tool that connects to spreadsheets and databases to give real estate teams a real-time view of performance. Dashboards can be displayed on an office screen to keep the team focused, or shared as links for agents working remotely or across multiple locations.
Common metrics include active listings, offers made, deals under contract, units sold, revenue vs. target, days on market, and agent pipeline by stage. New development sales teams track sales by unit type and release stage.
Building a custom realtor dashboard is straightforward with Geckoboard's dashboard builder. Connect Google Sheets or SQL databases and custom data sources to pull deal and listing data from your CRM or tracking system, then pick your metrics and build the view you need. Share with your team as a TV dashboard, shared link, or scheduled snapshot. Start a free trial or learn more about how Geckoboard works.
Use it to make team performance visible — displaying agent deal counts and revenue progress on a shared screen that keeps the whole brokerage team motivated and informed. It also helps deliver executive visibility by giving brokerage leadership a live view of sales performance without waiting for agent reports.