What is a sales rep dashboard?
A sales rep dashboard provides individuals in the sales team an overview of their performance towards their goals.
Sales rep dashboards can be helpful tools for Sales Managers to create a sense of ownership among their sales reps. When using sales rep dashboards, individuals are able to be more accountable for their workload, focused on results and ultimately improve their overall performance.
Metrics included depend on the work the sales rep completes as part of their role but often there’s a view of closed deals, activities and pipeline with clear goals attached for each area.
Different examples of sales rep dashboards
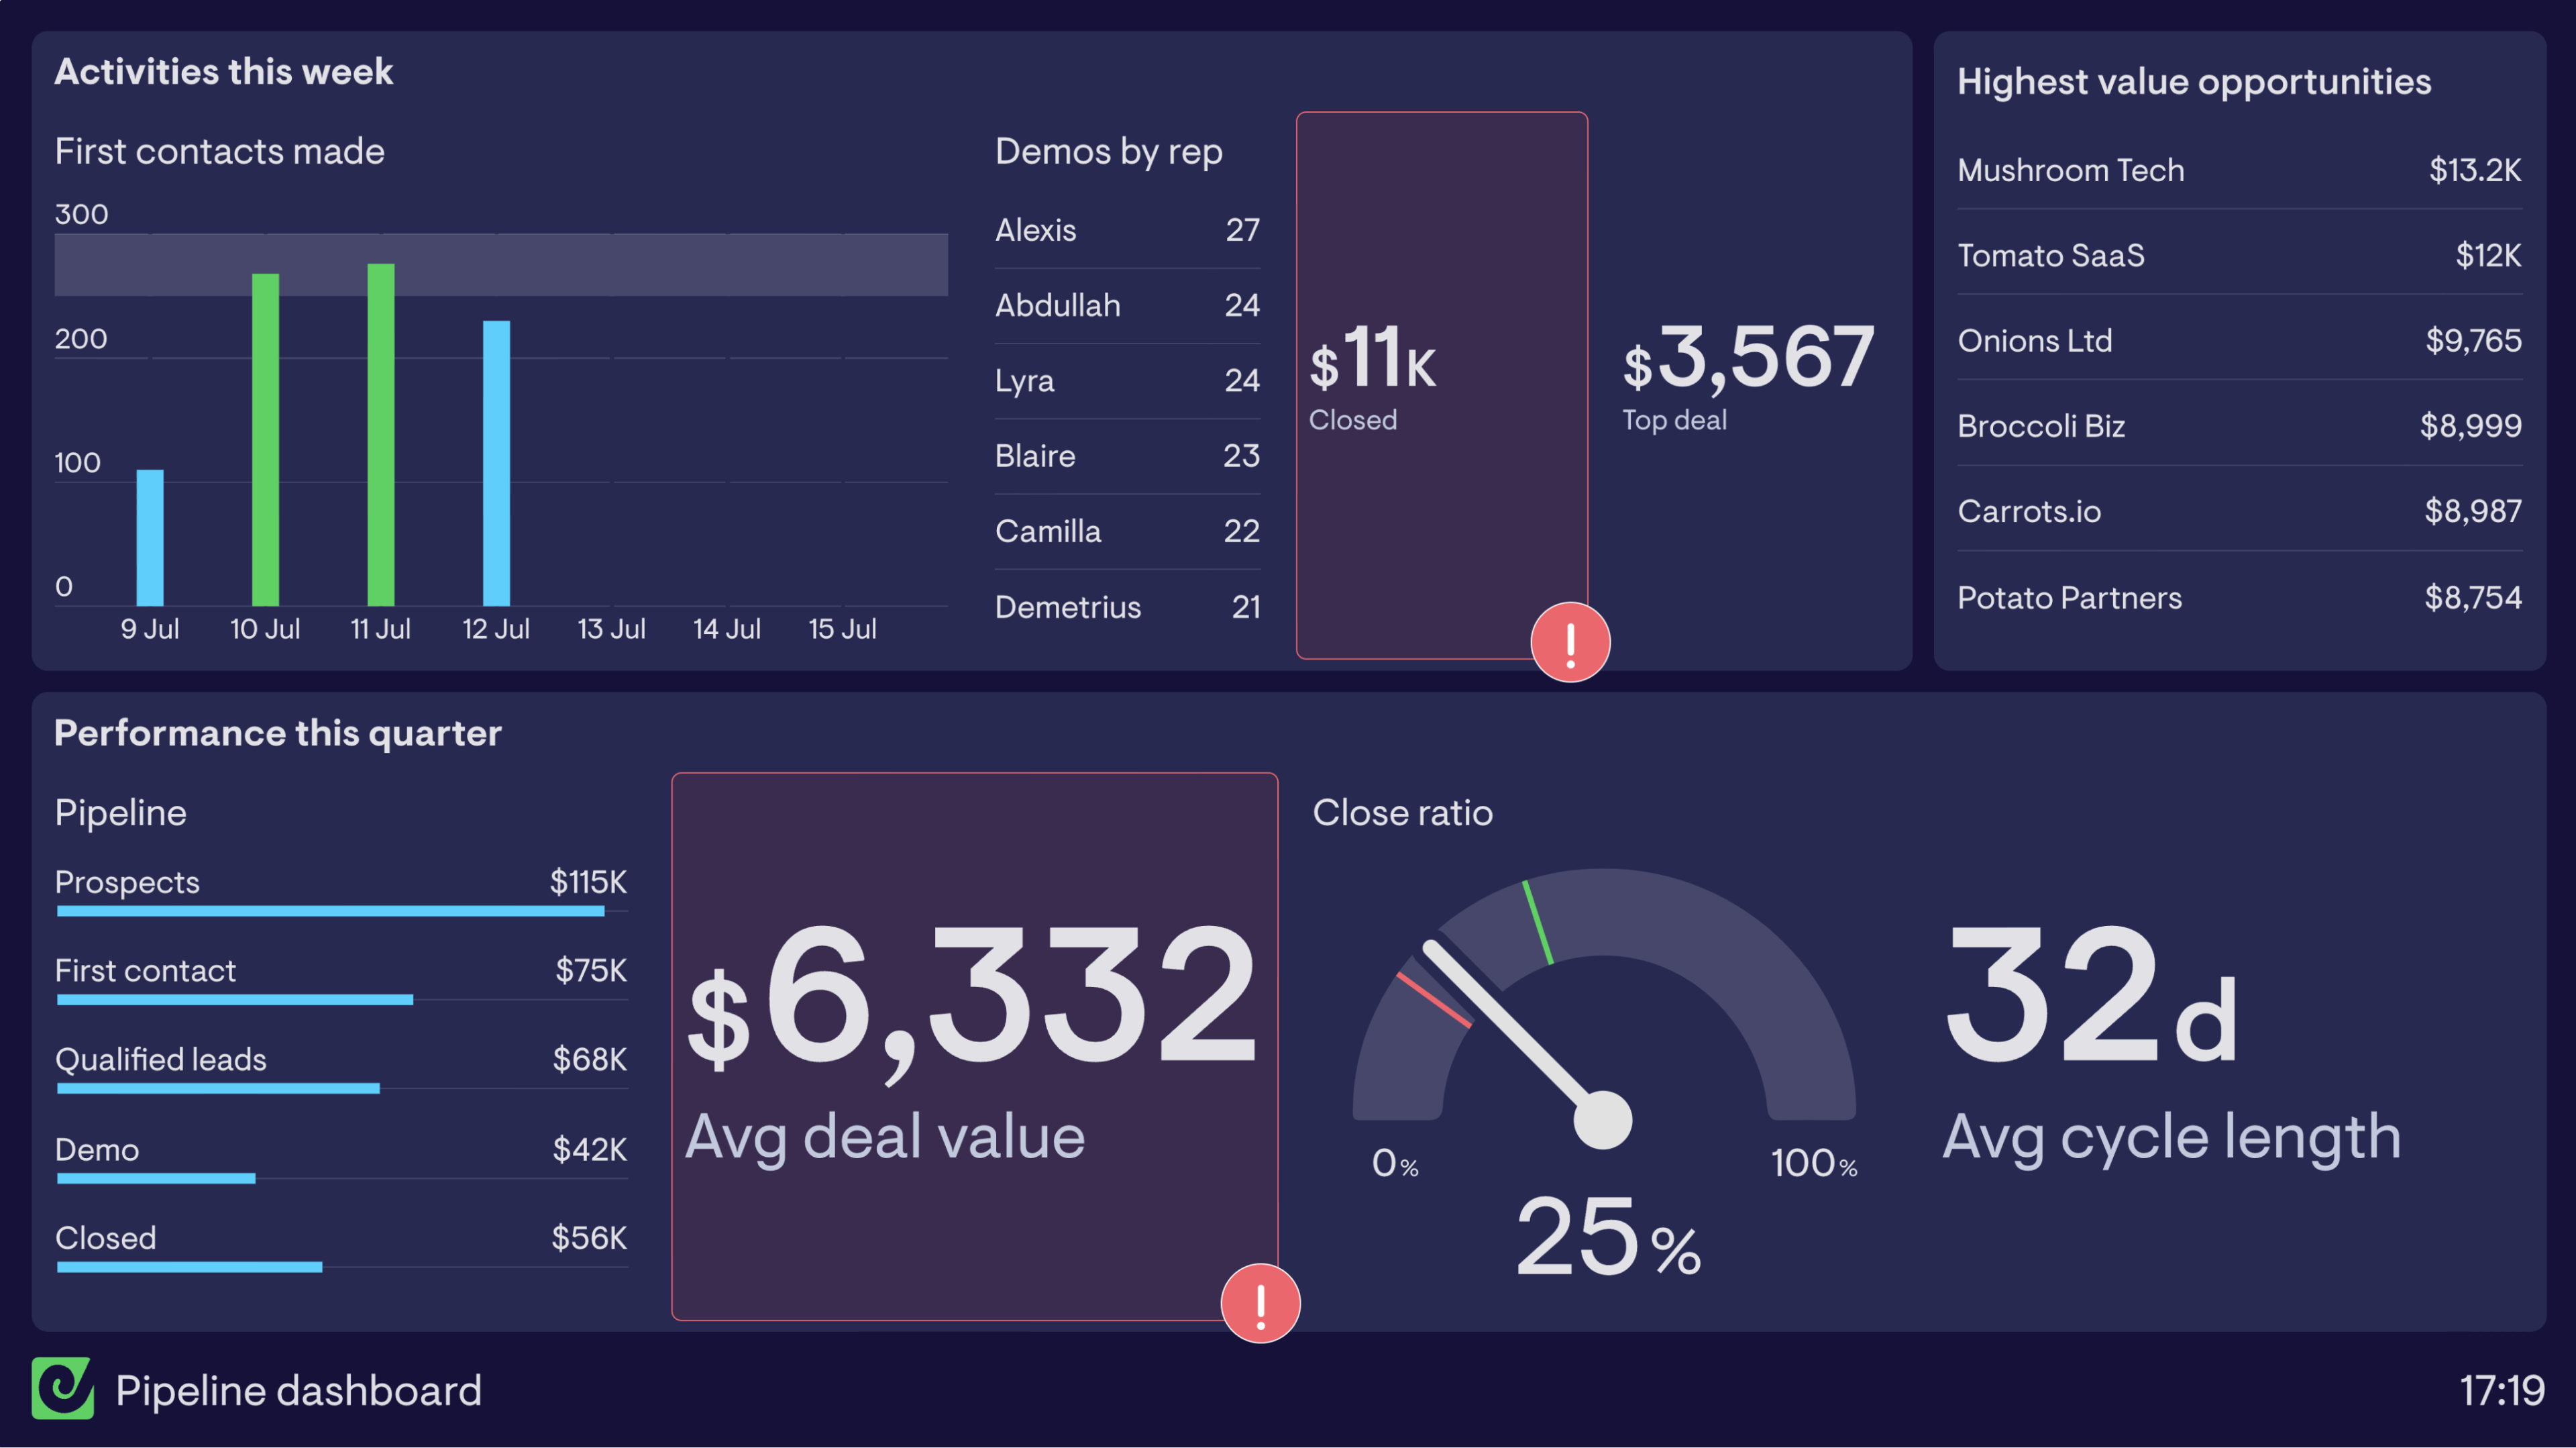
Sales rep dashboard
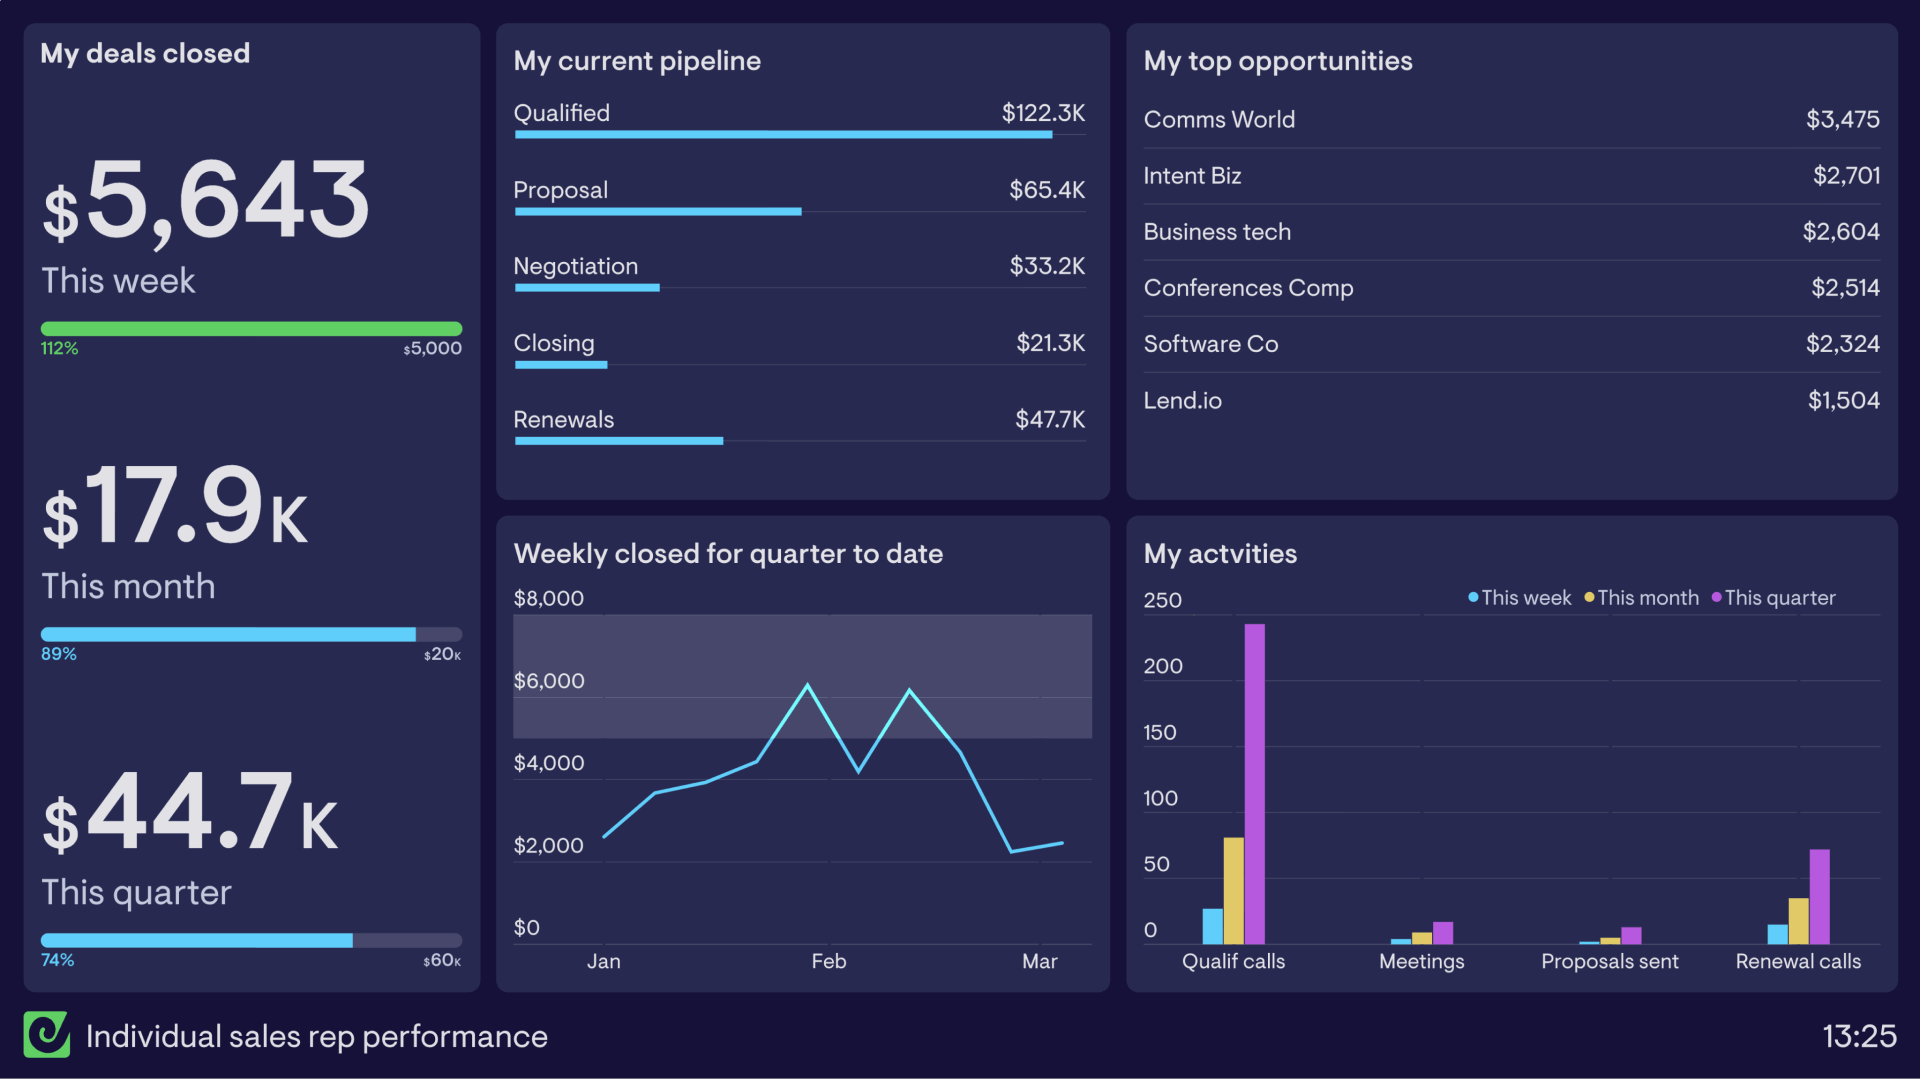
This individual sales rep dashboard visualizes key data that allows this sales rep to optimize their performance and meet goals.
The most important metric for this sales rep is the value of deals closed. They have weekly, monthly and quarterly goals to hit in order to receive their bonus. By tracking these on a dashboard they always have visibility of the progress they’re making.
Also included is their current pipeline, so that they’re able to see what they have moving through various stages of the buying journey. Alongside this, they have their top opportunities as motivation to stay on top of these prospects and turn them into deals closed.
The activity data has been included to build awareness of and accountability for the activities they need to complete in order to close deals. When activities in one area drop, they’ll see the various stages of their pipeline affected so it’s important to keep this in mind.
Focus areas
Deals closed, Pipeline, Top Opportunities, Activity
Who looks at it?
Individual sales rep
How often?
Every day
- SalesforceGoogle Sheets
SDR dashboard
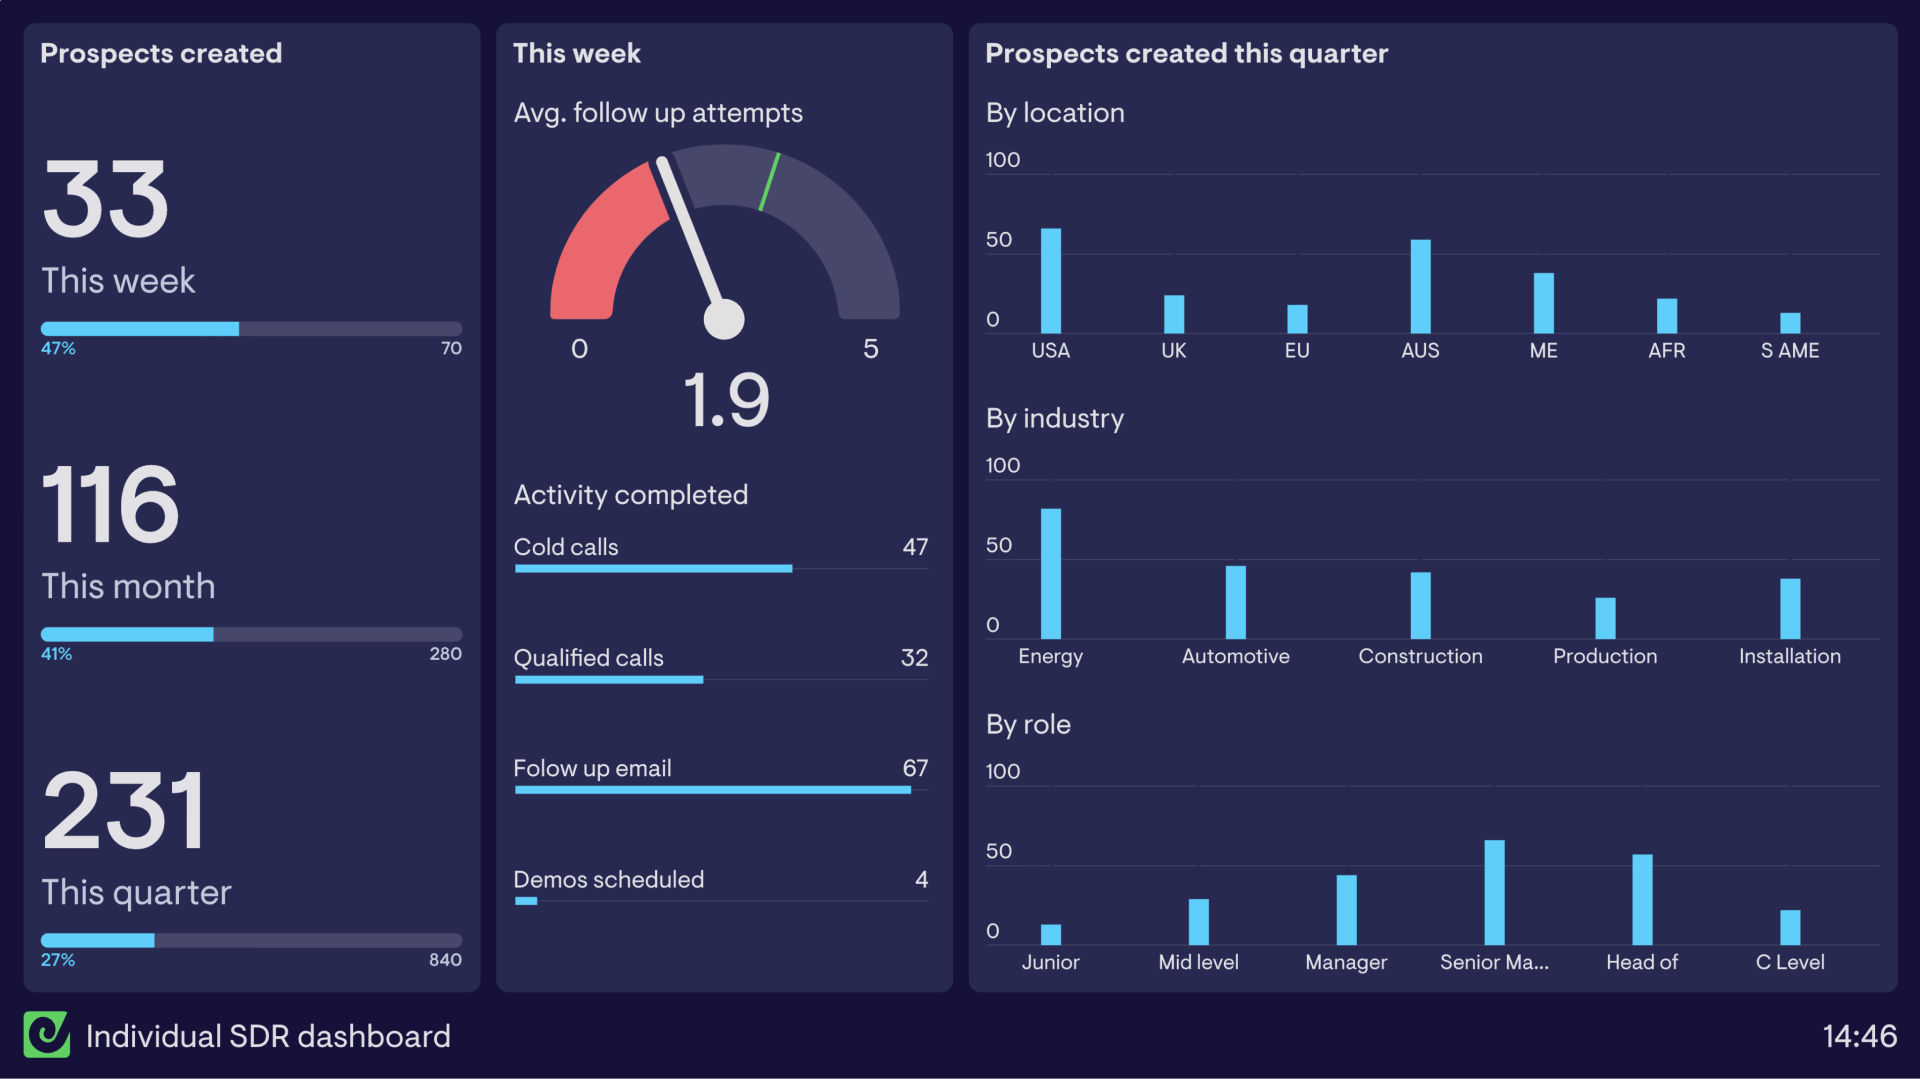
This SDR dashboard has been created for an individual SDR to monitor their prospect creation performance.
On the left of the dashboard are the key metrics the SDR is focused on, total prospects created. They’re monitoring these numbers over the week, month and quarter in order to hit their targets.
The middle section covers activity for the week. This includes the average number of follow up attempts the SDR makes to prospects with a goal of having made 3 or more. Also here is the total number of each activity completed by the SDR.
Finally, on the right side of the dashboard there are three column charts breaking out prospect data collected by the SDR. There are ideal customer profiles the team as a whole are looking to engage with so by sharing data about the prospects created this quarter the SDR is able to see where they need to invest more attention when building prospect pools.
Focus areas
Prospects created, Activity
Who looks at it?
SDR
How often?
Every day
- SalesforceGoogle Sheets