Zendesk dashboard examples
A Zendesk dashboard visualises your support team's key metrics — ticket volume, response times, CSAT, and more — in a live view that agents, team leads, and the wider business can all see. Metrics update automatically, so the picture on screen always reflects what's actually happening in the queue.
Live Zendesk ticket queue dashboard
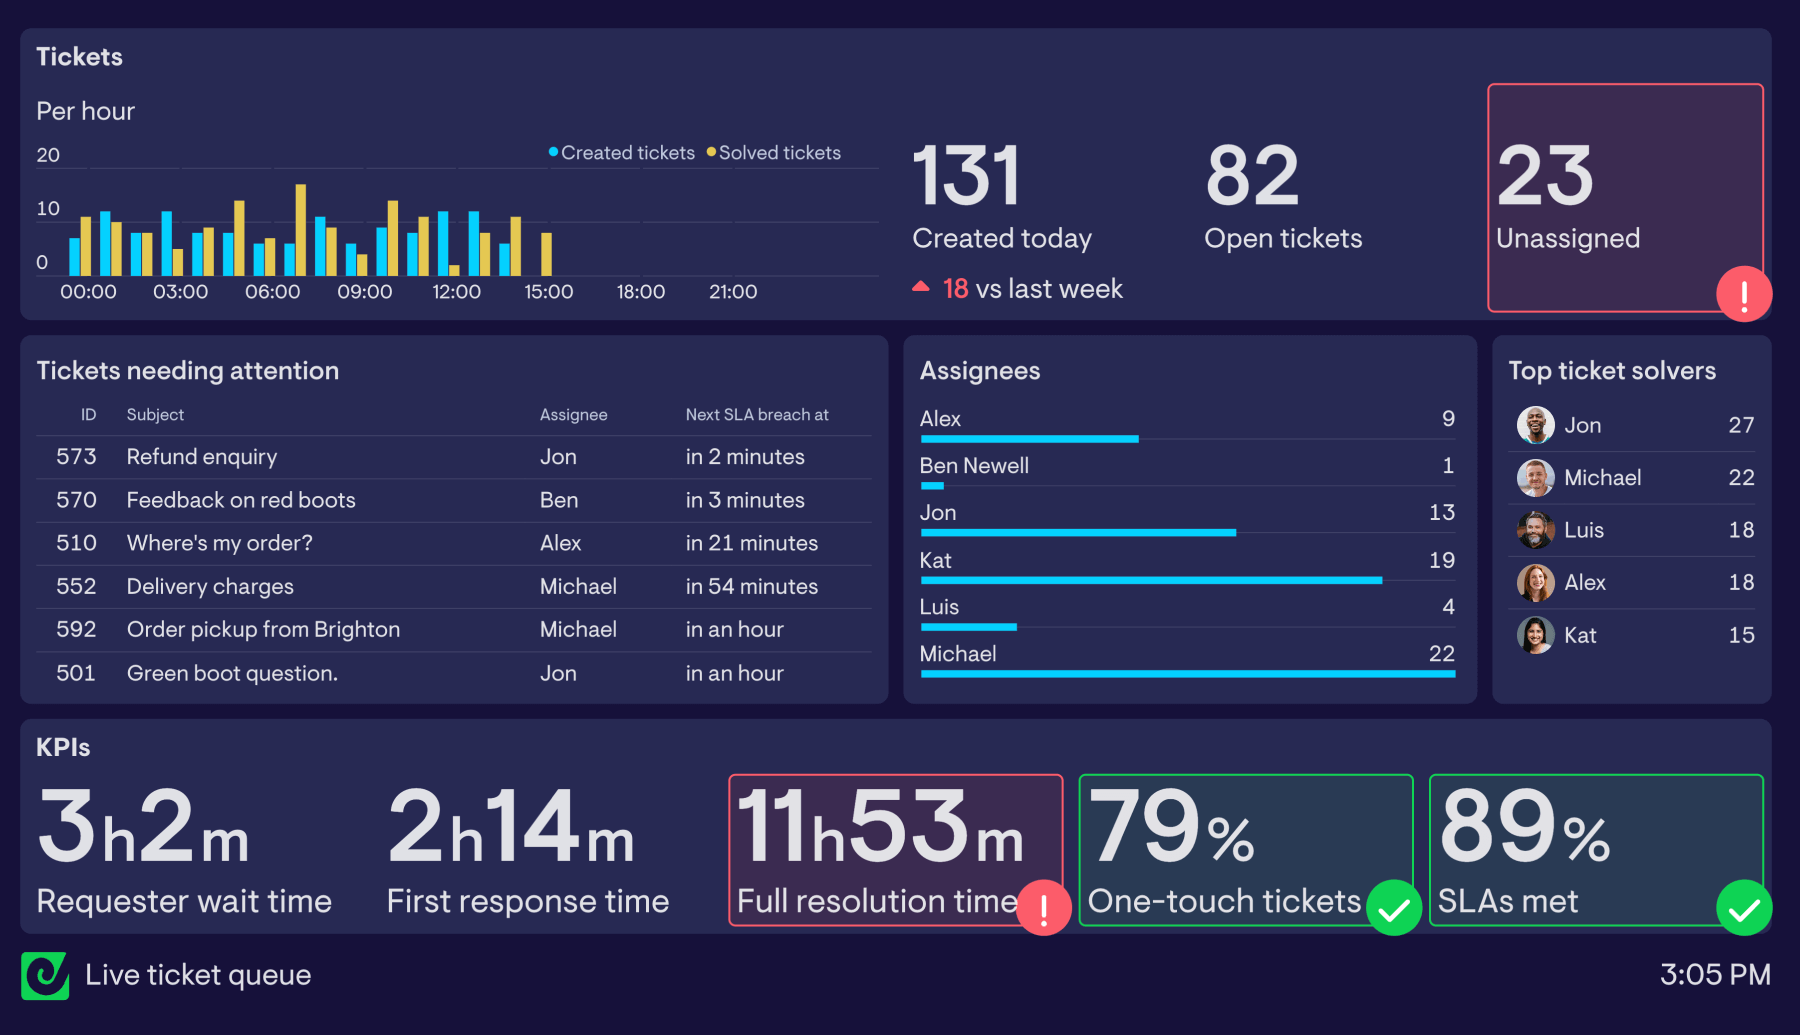
It can be tricky to keep on top of a busy queue of tickets in Zendesk, jumping between different views, Explore, and the queue itself to understand the state of play.
This dashboard is designed to bring together several piece of ‘must know’ information that allow managers (as well as agents) to quickly understand if things are ticking over normally, if there’s a spike in tickets, and how the team as a whole is responding to customer needs.
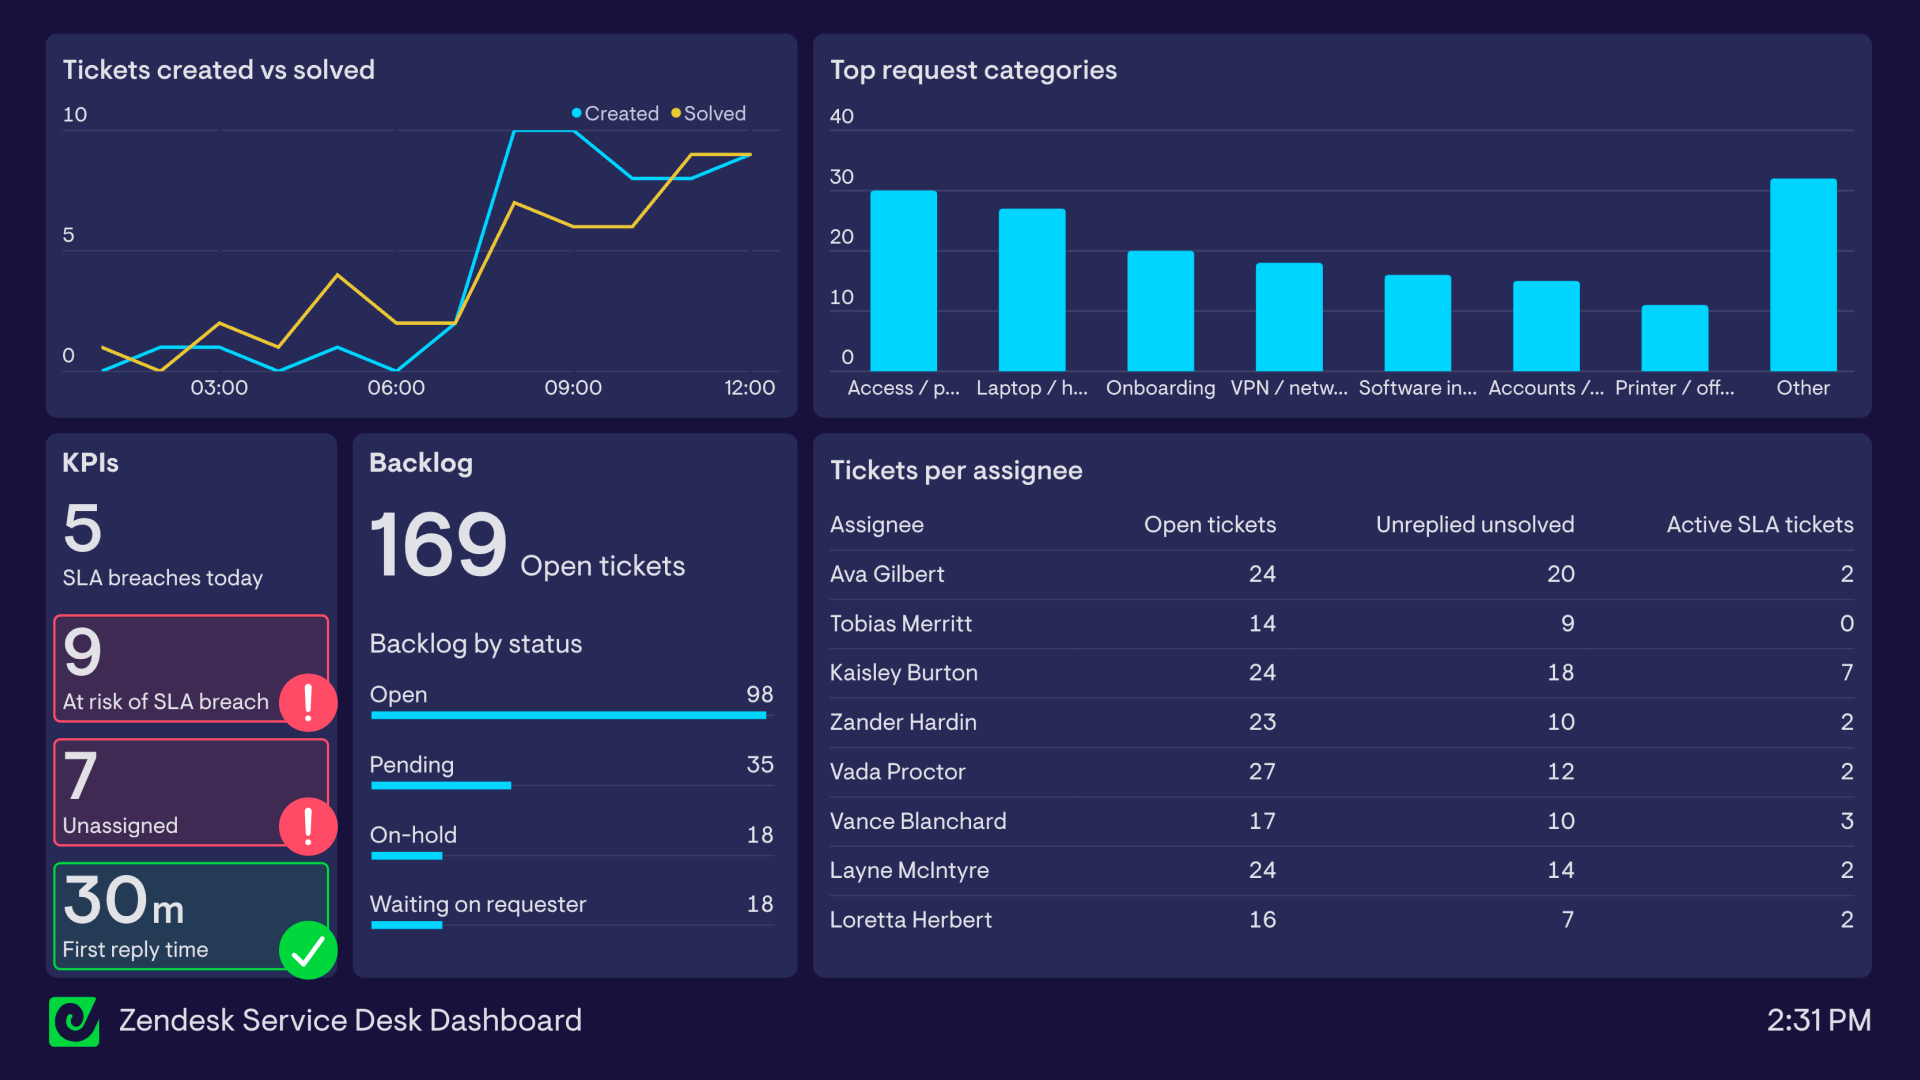
What's on the dashboard?
Open tickets by priority and type: This gives a quick insight into the nature of the tickets that the team are currently handling, and allows managers to spot unusual patterns or spikes in urgent tickets that might need attention.
Open tickets by assignee and unassigned tickets: Answers the question: how many tickets are currently assigned to each agent (and is that workload fairly distributed)? In this example, the team are keen to keep the number of unassigned tickets as low as possible, so this turns green when zero, and will highlight in red when there are more than 5.
Tickets today and tickets requiring attention: Allows the team to keep an eye on whether the rate of tickets being solved is broadly keeping up with the number of incoming tickets throughout the day, and whether there’s a chance of a backlog mounting up. Alongside, is a feed of tickets that might need the team's attention.
First response time, full resolution time, requester wait time, one-touch-ticket-rate: Gives the team a quick summary of how quickly and efficiently they’re addressing tickets throughout the day. Set up to flag if any of these metrics are trending in a particularly good direction (in green) or aren’t quite where they need to be (in red).
Support team performance dashboard
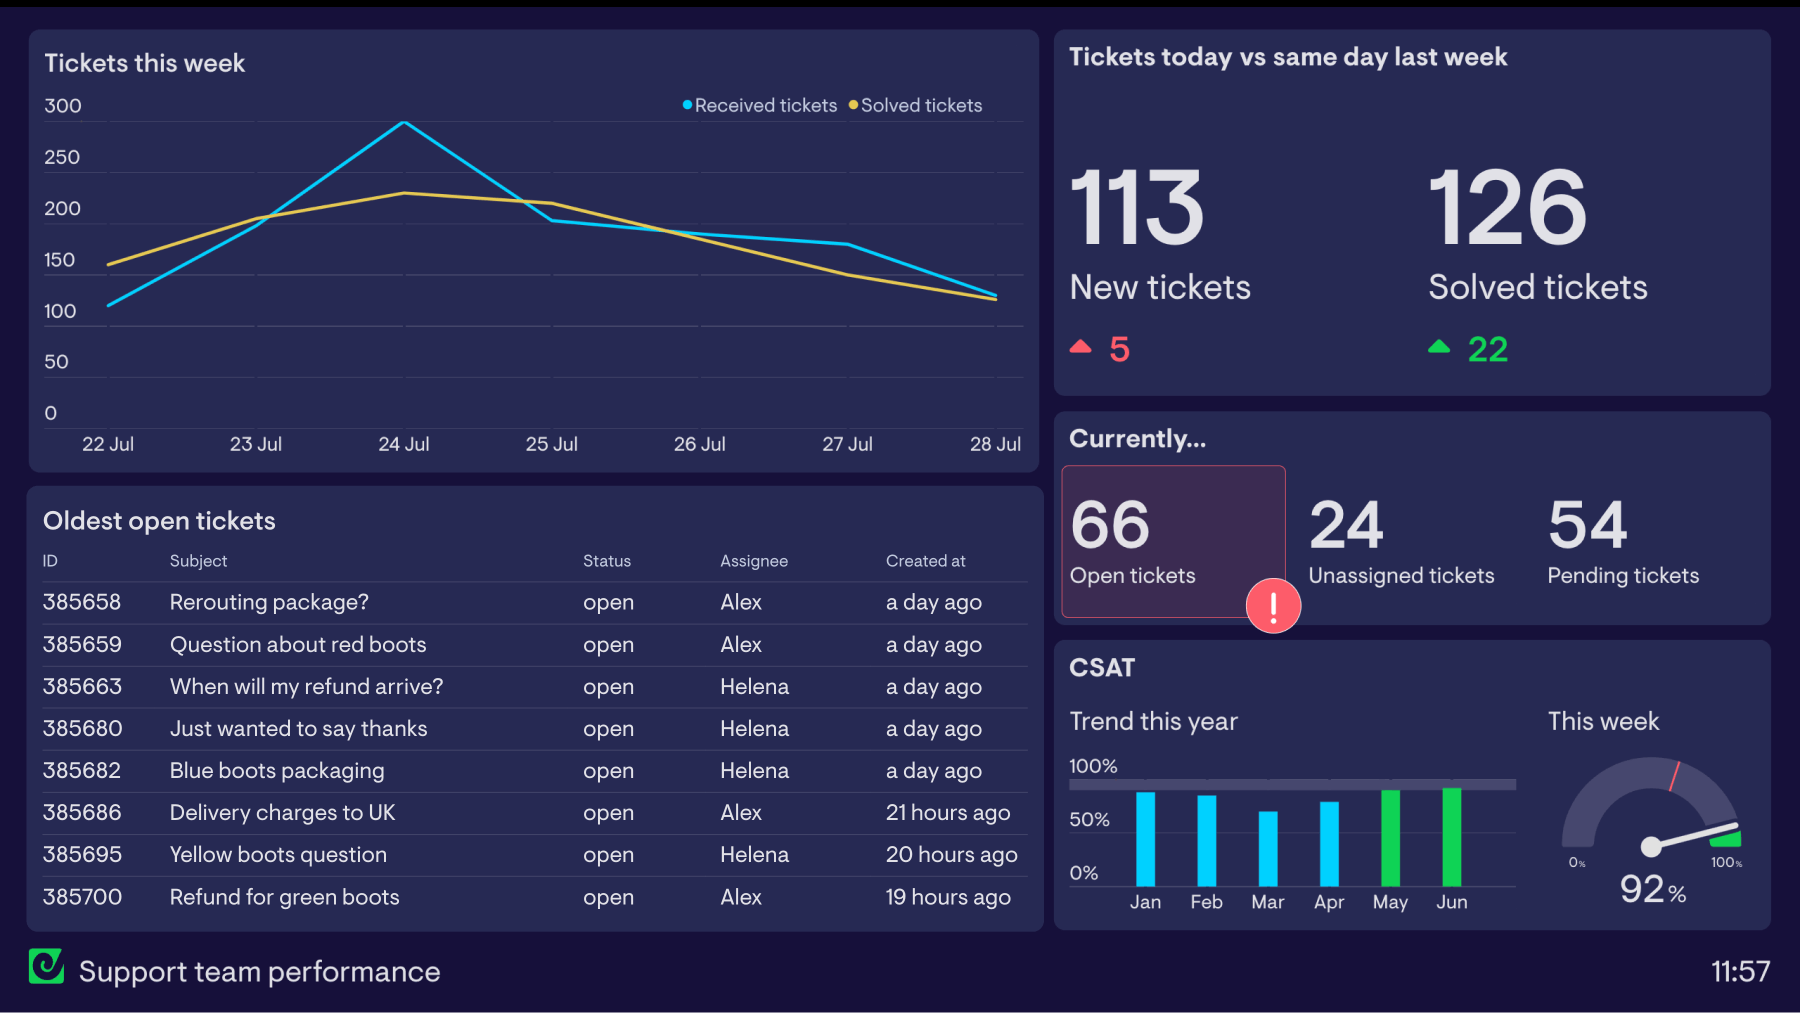
This dashboard surfaces a mixture of live data, and longer-term data, giving this support team a single view of the information they consider most important to focus on. Nothing more, nothing less.
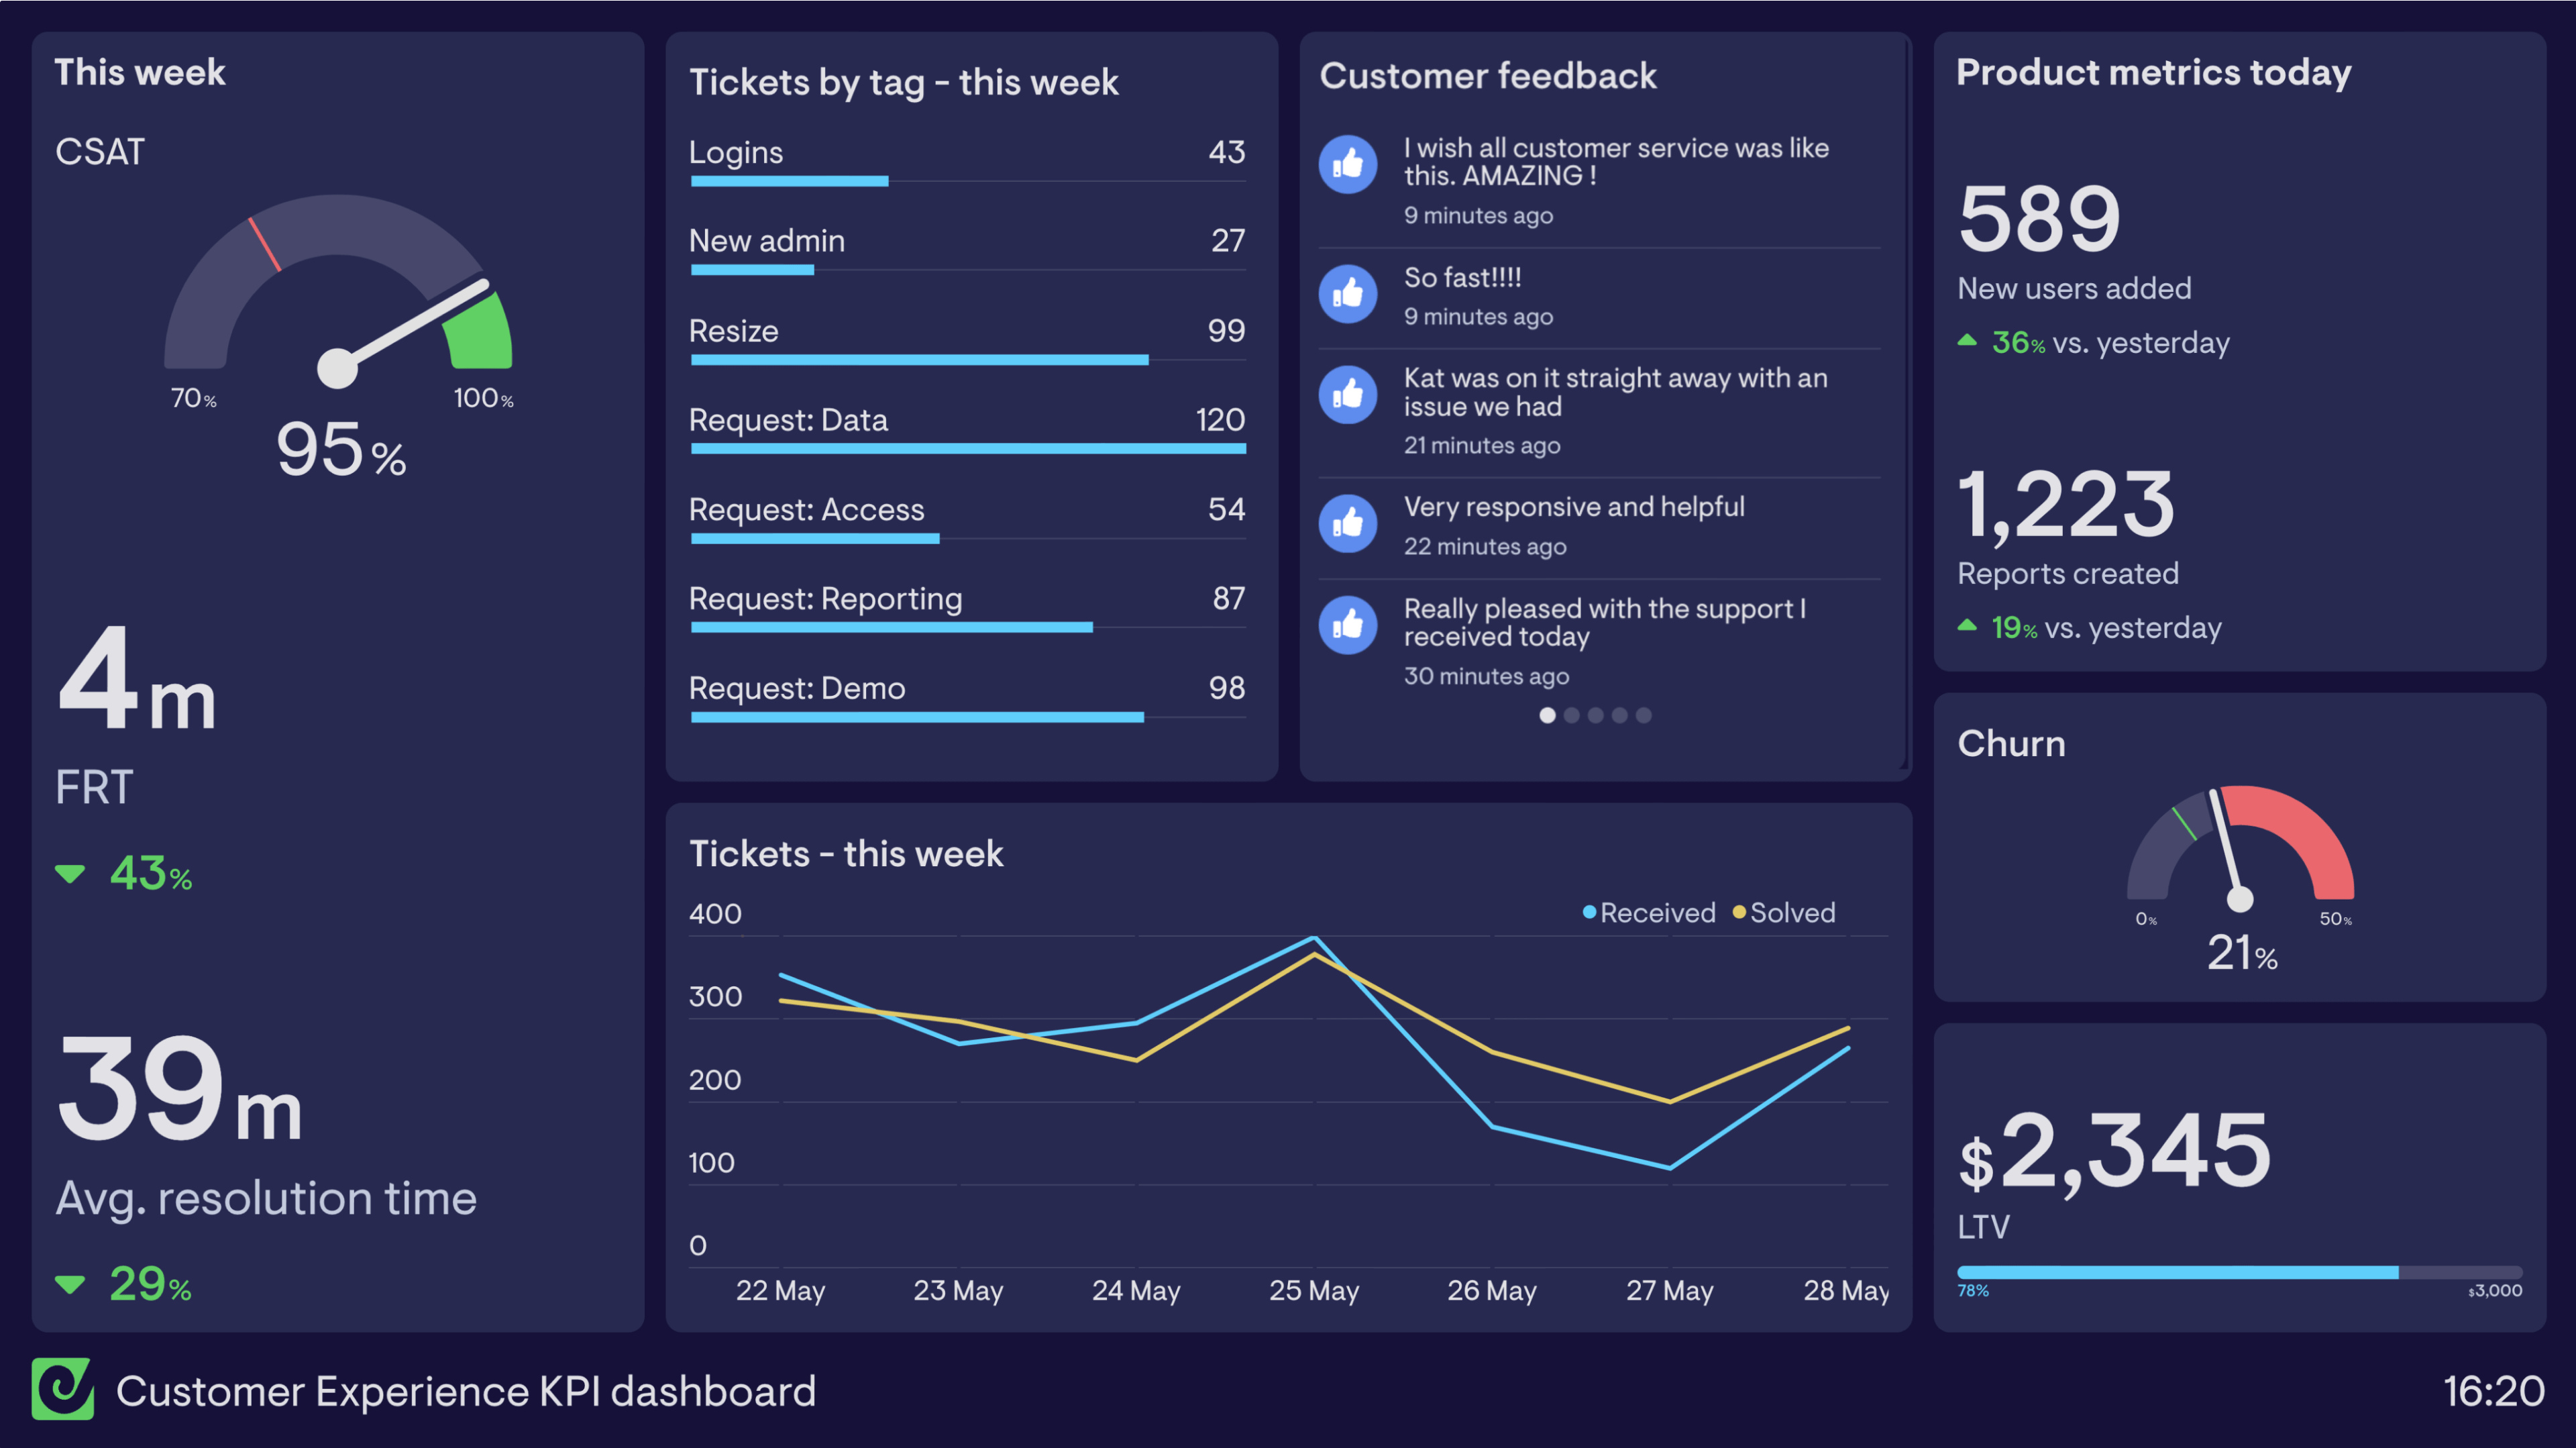
What’s on the dashboard?
Tickets this week: Gives the team a quick view into how they’ve been meeting customer demand throughout the week, and whether there are any abnormal trends in ticket volume or productivity developing.
New and solved tickets today Vs same day last week: Gives agents and managers a quick understanding of ticket volume so far during the day and whether agents are meeting demand. Monitoring real-time metrics like these over time can give teams a sense of what normal looks like, so it’s easier to spot when things aren’t quite right.
Current open, unassigned and pending tickets: Surfaces more detail around how the ticket queue is being processed by the team. Status indicators highlight automatically (in green and red) when these metrics are in a good or bad place.
CSAT this week and this year: Whilst this team is monitoring efficiency metrics like first response times and resolution times on a different dashboard, ultimately they care most about CSAT. Here they can see at a glance if standards are being met throughout the week, and how this is improving over the course of several months.
Oldest open tickets: To reduce the chances of an old ticket slipping through the net, the team tracks its oldest open tickets and can easily see when they were created, and who they were assigned to, so everyone’s motivated to close tickets, and managers can step in if needs be.
Agent performance dashboard
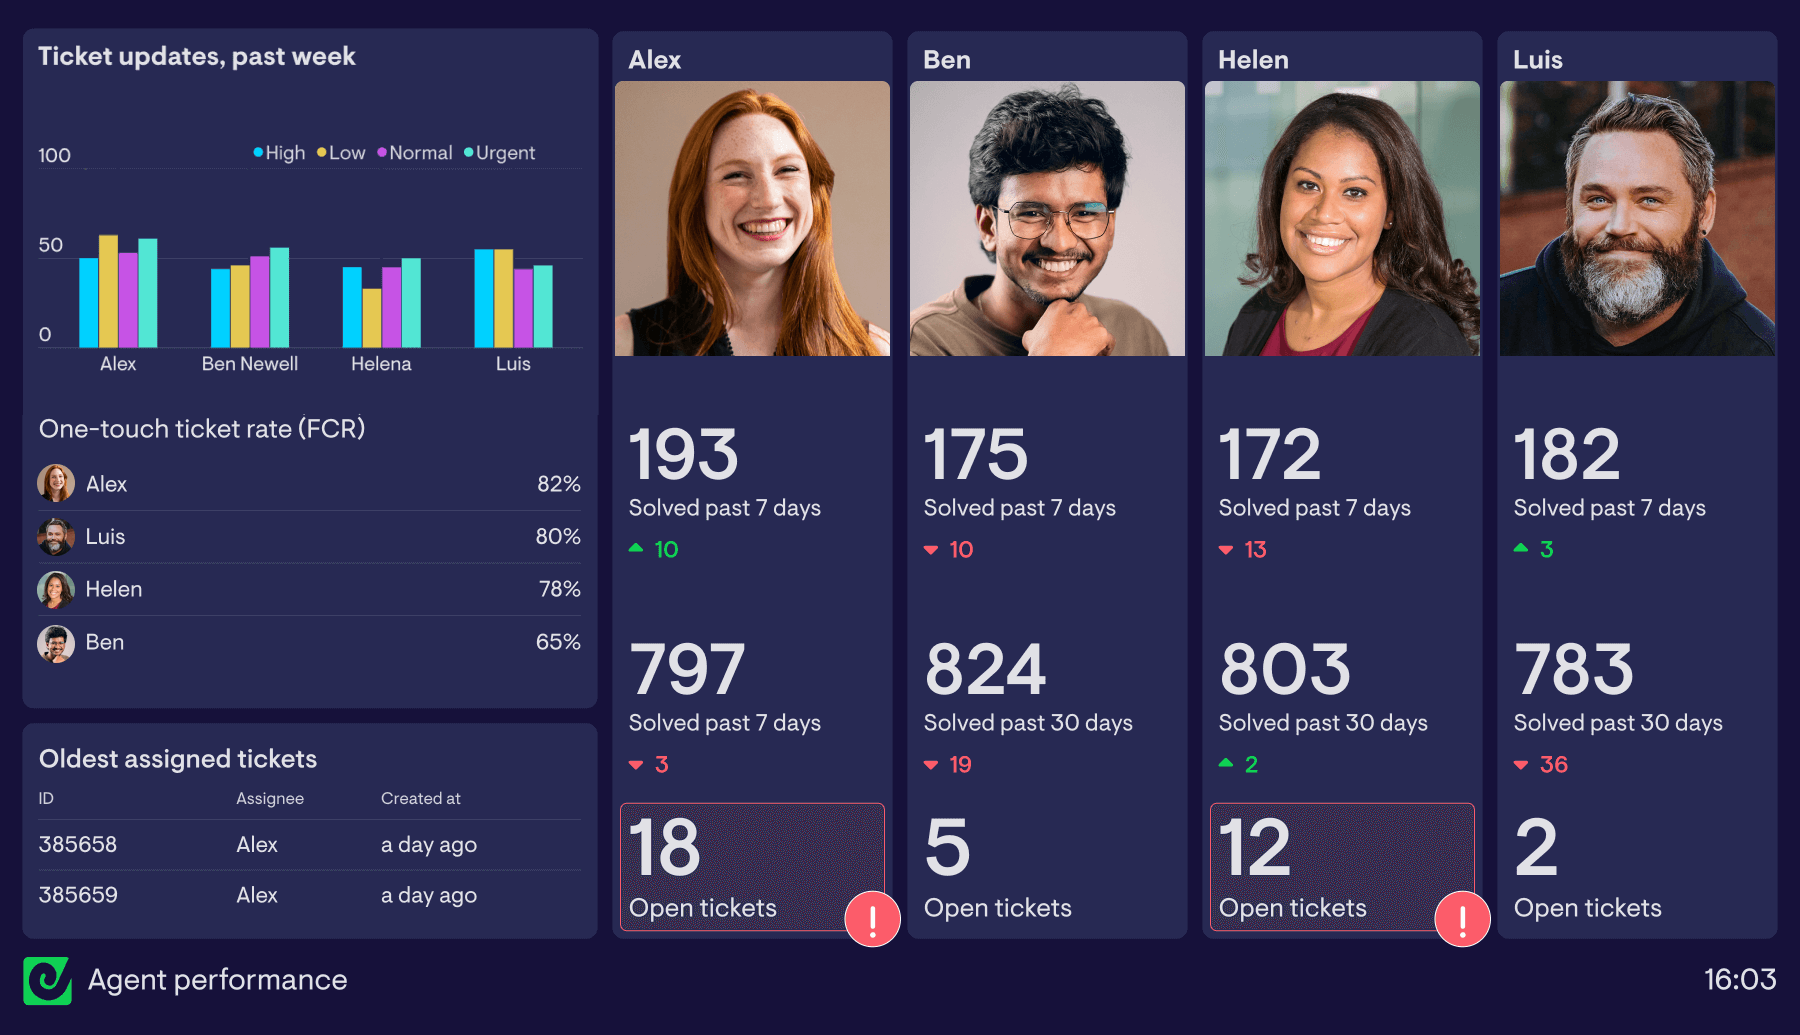
This dashboard provides a quick snapshot of how individual agents’ days are going. Useful if you’re a hands-on manager of a support team who needs to quickly see how everyone is performing, and know if you need to intervene to keep things on track.
But this sort of dashboard really shines when shared directly with agents themselves, whether during 1-1 catchups or by giving them access to it throughout the day with a link or displayed on a TV wallboard.
Seeing how you’re doing relative to your peers can spark a bit of friendly competition, as well as giving agents who are more on top of their tickets the opportunity to offer help to those who might be struggling.
What’s on the dashboard?
Open tickets: The number of open tickets currently assigned to each agent. This visualisation has been set up to turn red if an agent owns more than 10 tickets.
Tickets solved past 7 days and past 30 days: Allows agents to get a feel for whether they’re performing roughly in line with their peers, and get a quick read on whether they’ve solved more or fewer tickets than the previous period.
Ticket updates and one-touch ticket rate this week: The team in this example is keen to improve its efficiency, mostly through reducing touches per ticket. As a result they’ve decided to shine a light on the number of ticket updates per agent for different ticket priorities, as well as one-touch-ticket rate, shown on a weekly leaderboard.
Oldest assigned tickets: Finally, to make sure tickets aren’t left lingering, the team’s dashboard shows the oldest tickets that have been assigned to an agent, to encourage everyone to wrap up quickly.
Zendesk SLA dashboard
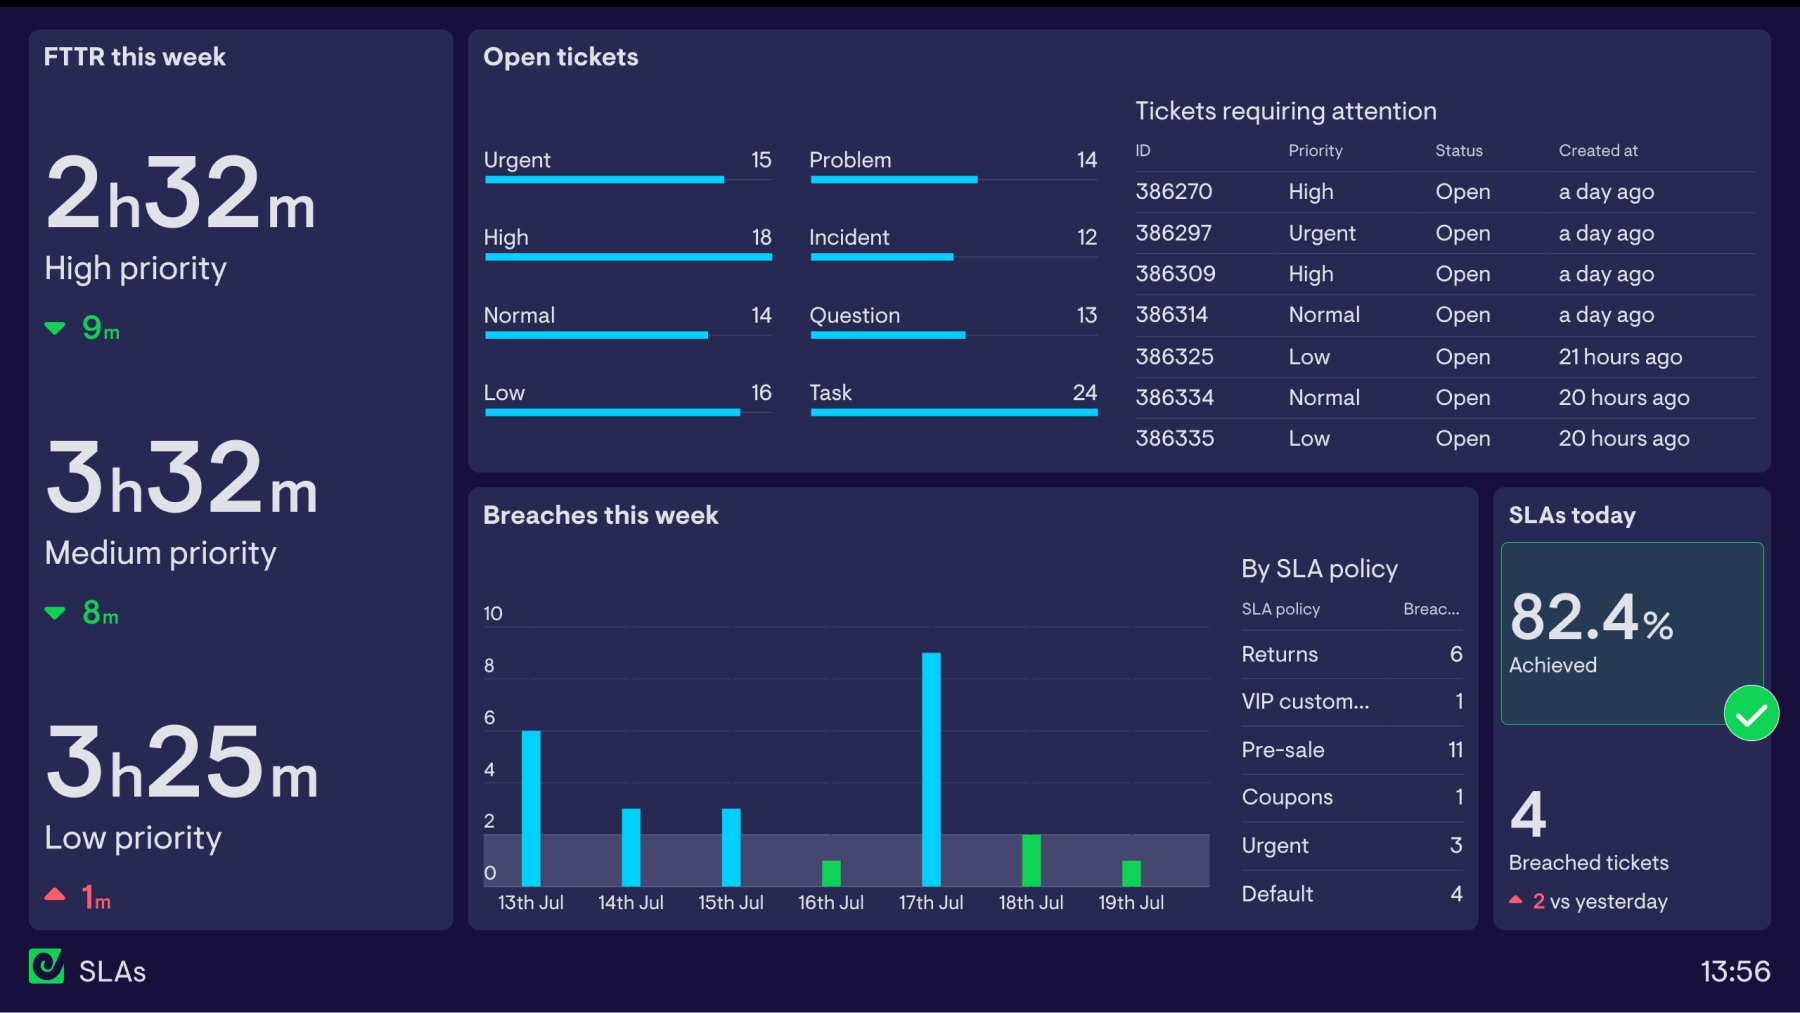
It’s sometimes said that real-time dashboards are like having a cockpit readout in a car or plane. Done right, they surface just enough actionable information, and quickly enough, so quick course corrections can be made, and everything stays on track (or indeed, in the air).
This dashboard serves that purpose for a support team that wants to keep on top their service level agreements (SLAs), and quickly identify areas that need attention.
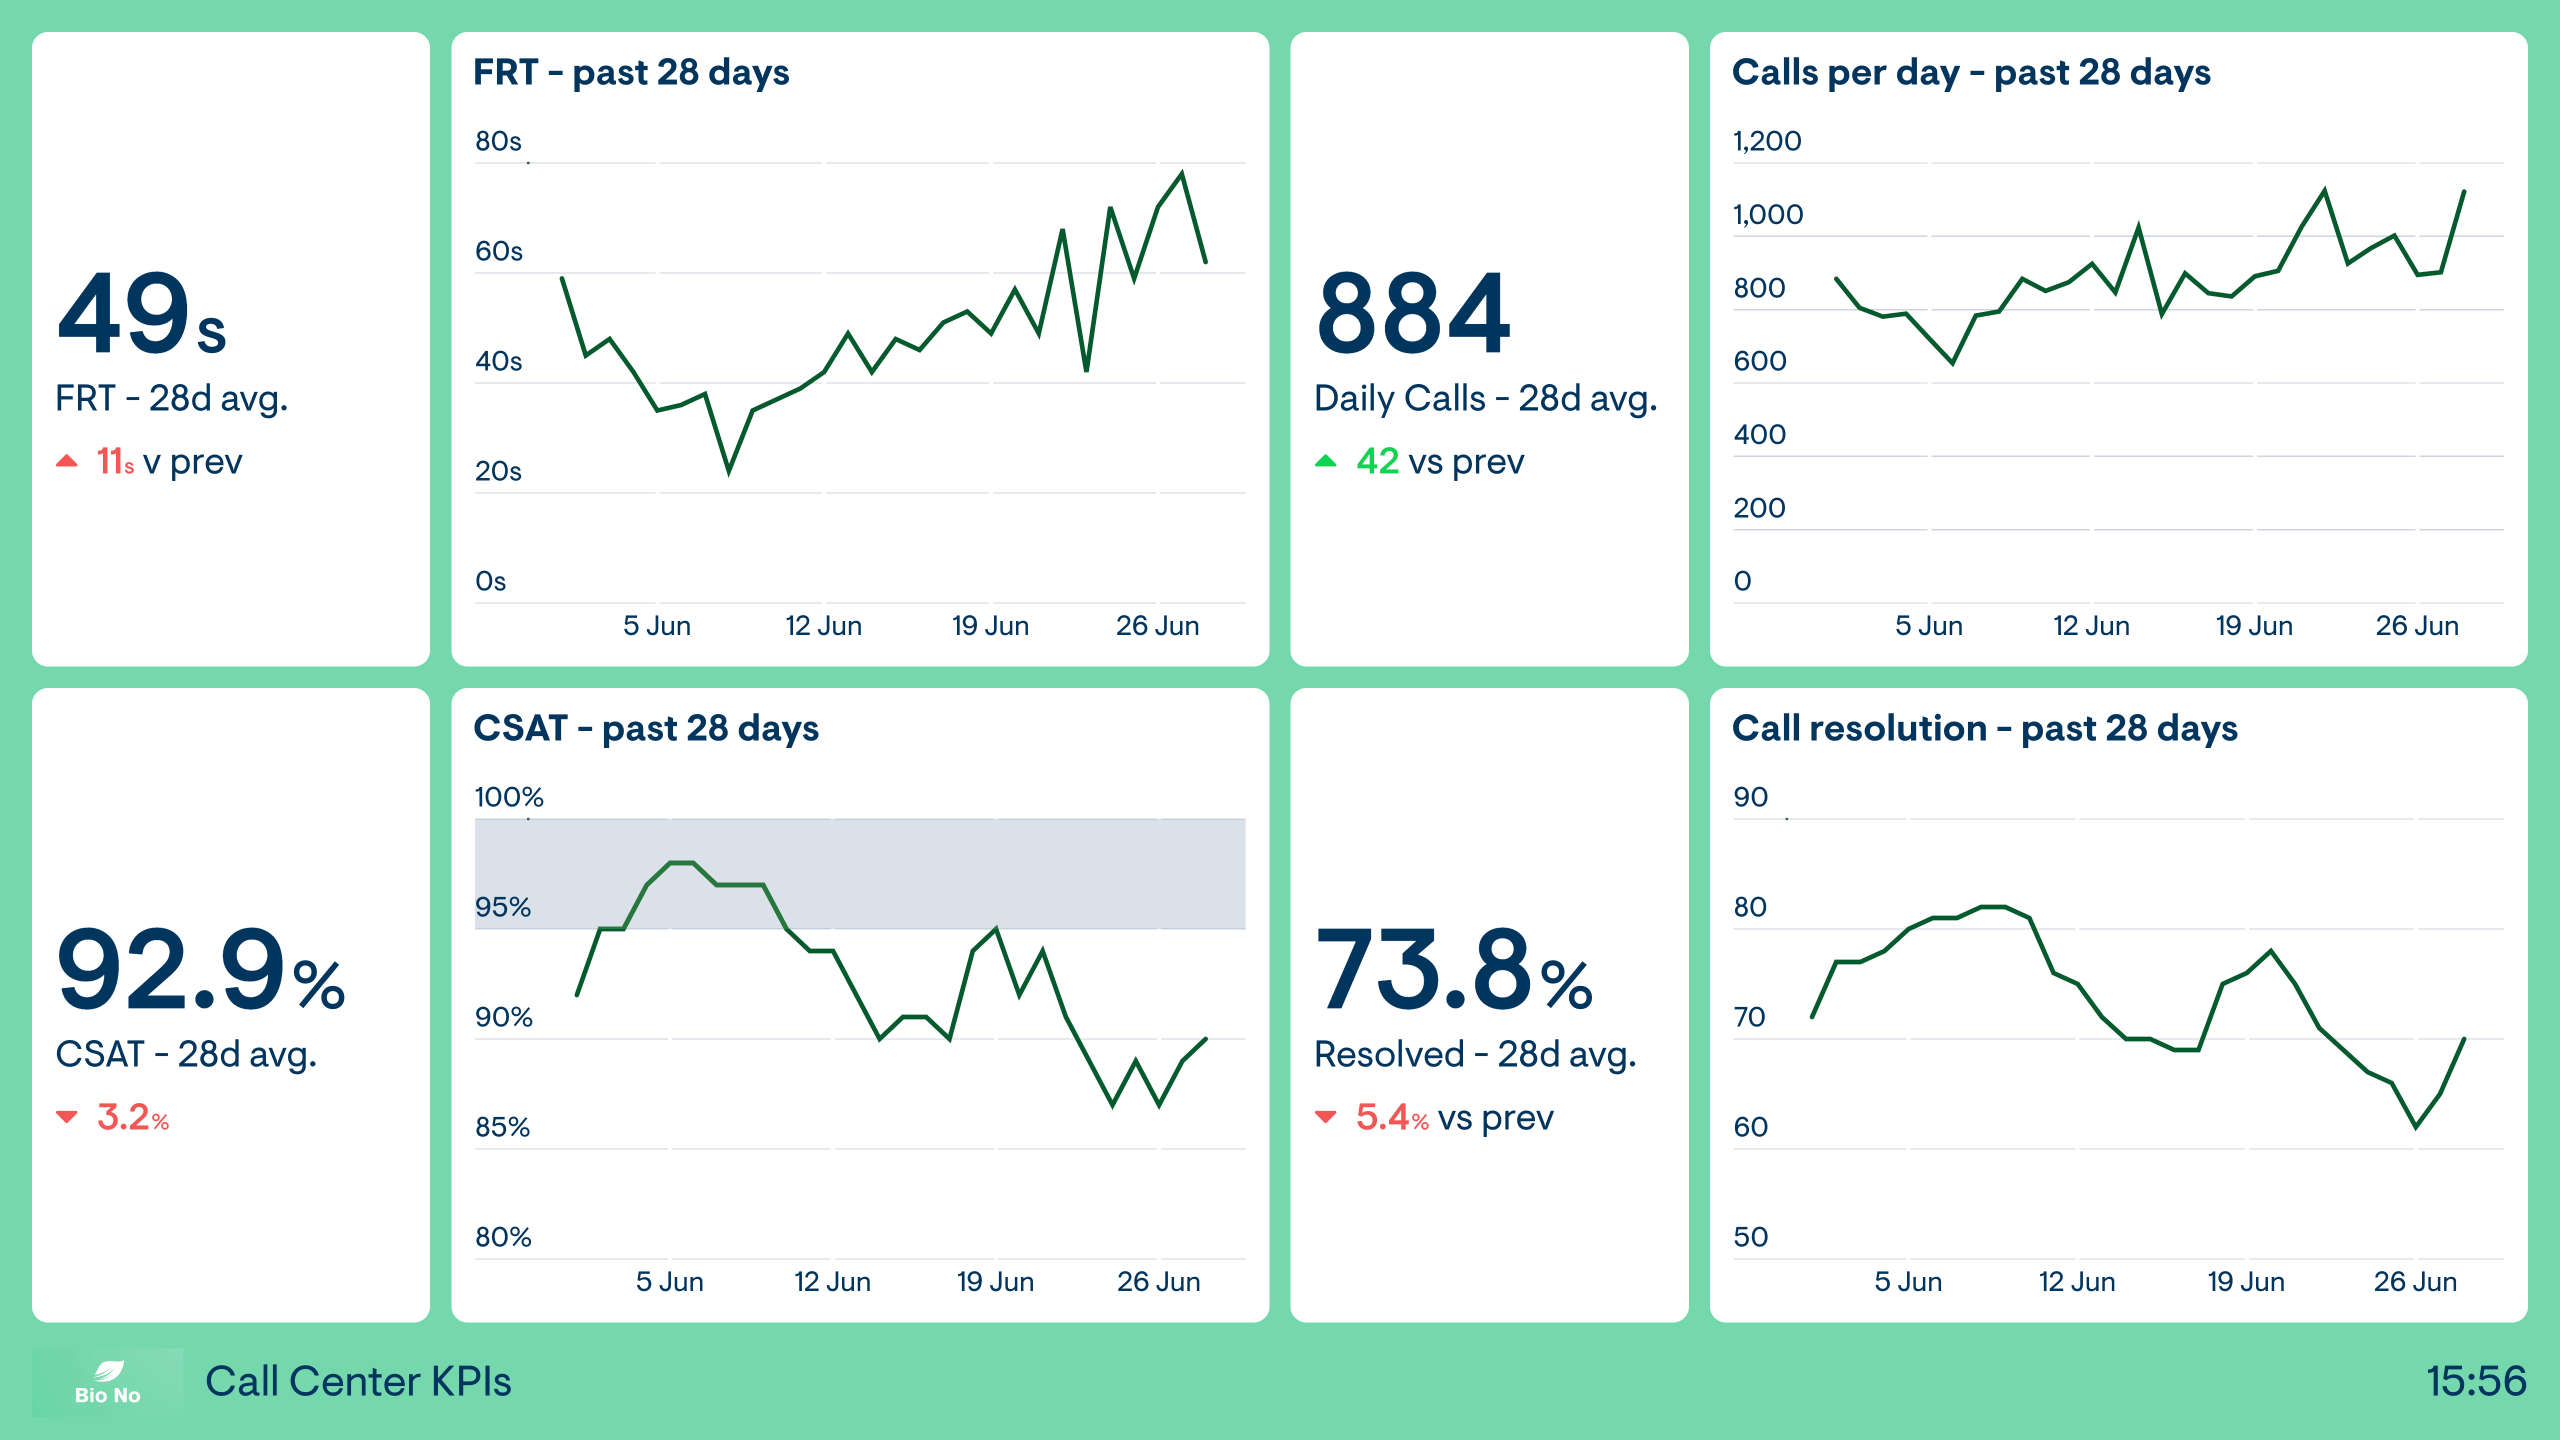
What’s on the dashboard?
Full time to resolution (FTTR) this week: Reaching a resolution quickly is top priority for this team. To get visibility on how quickly tickets of varying priority are being solved, this dashboard breaks FTTR out by high, medium and low priority, with a comparison Vs the previous week.
SLAs: The team has several SLAs set up in Zendesk, related to different tiers of ticket. With this dashboard they can easily see how many times each SLA policy has been breached over the course of the week, how many breaches there have been today, and the percentage of tickets where SLAs have been achieved today.
Open tickets: Gives a quick view of how open tickets are spread across different ticket types and tickets of varying priority.
Tickets requiring attention: Provides visibility on the oldest open tickets.
Zendesk Explore Support dashboard template
If you’re using Zendesk Explore for visualising your support ticket data, you may have come across its prebuilt Support dashboard template, containing a selection of useful metrics you’re likely to want to keep on top of.
And whilst Geckoboard provides many more options for customising your dashboards (especially if you’re on a lower Zendesk plan that doesn’t feature customisable Zendesk Explore dashboards), we thought we’d see how the standard pre-built Explore dashboard might look.
What’s on the dashboard?
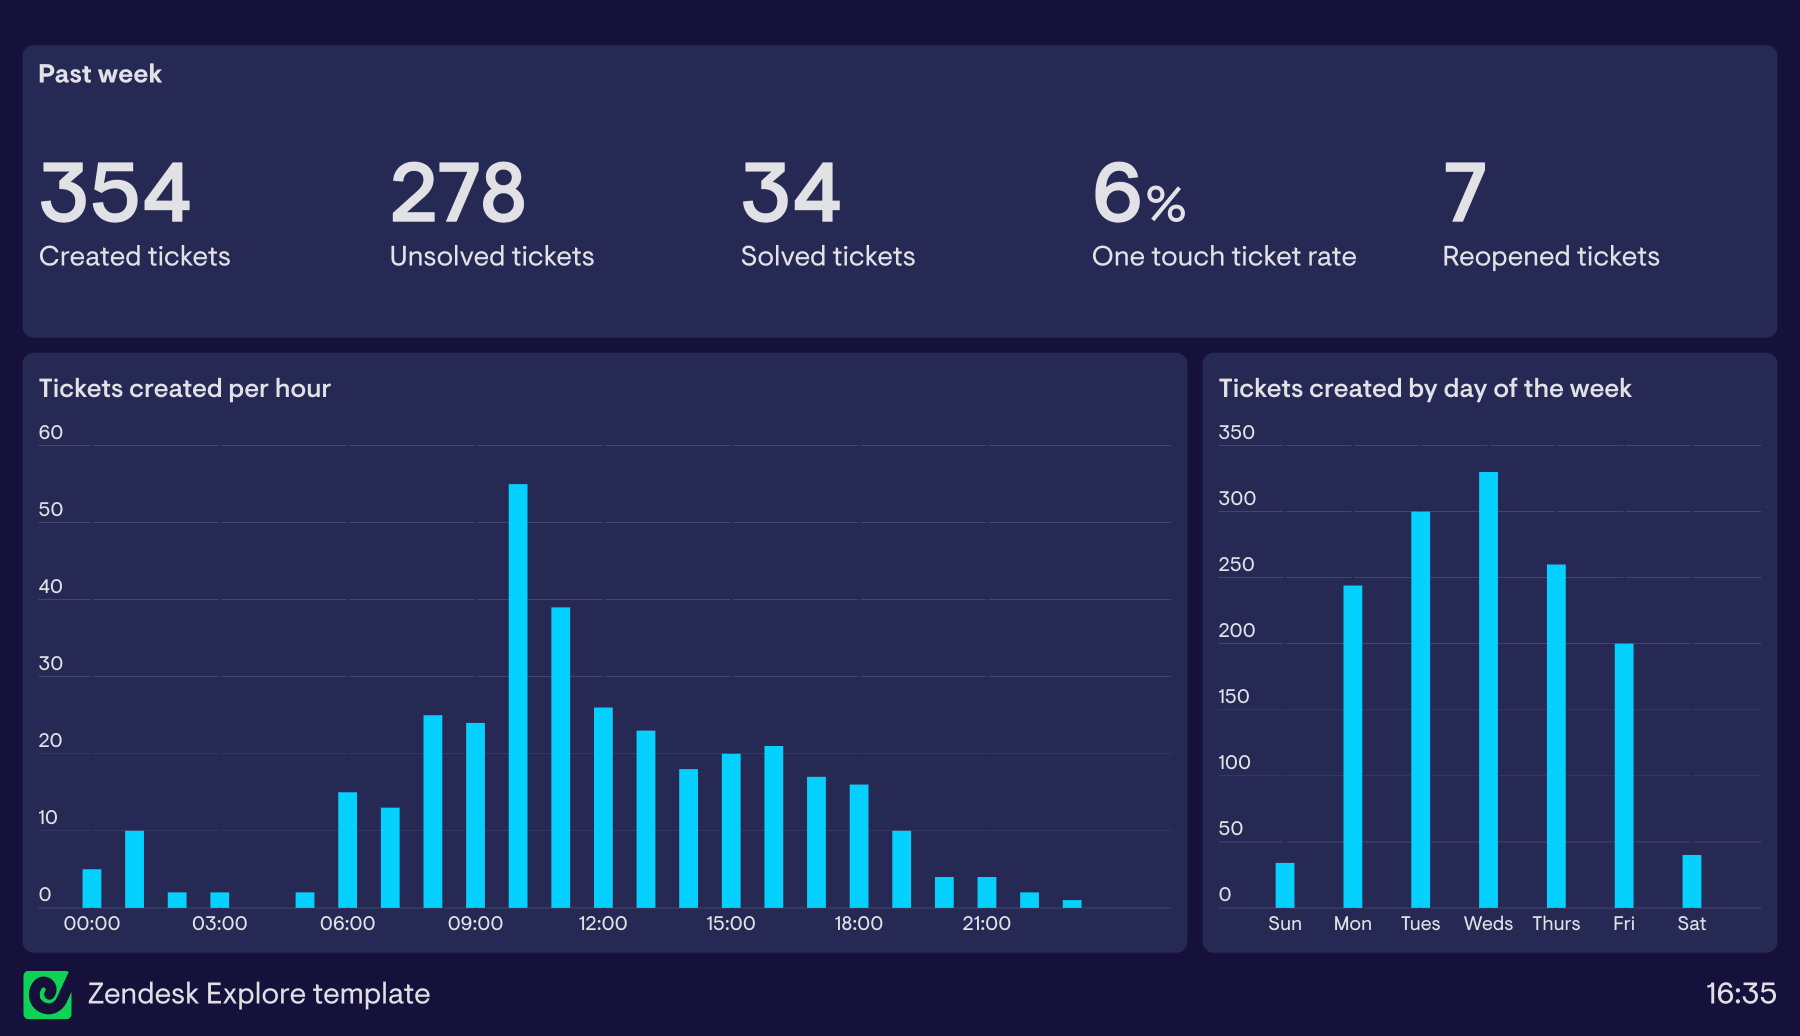
Created, unsolved and solved tickets: Shows the flow of tickets over the past week
One touch ticket rate, reopened tickets: A broad indication of how efficiently the team has worked through tickets over the past week.
Tickets created per hour and by day of the week: Breakdowns showing the volume of incoming tickets over time
Zendesk weekly reporting dashboard
Real-time Zendesk dashboards are extremely powerful tools for support teams who want to be more reactive and aware of metrics throughout the day. But when it’s time to share numbers with others in your organisation, a summary report of the previous period’s performance is often a more effective way to report on how things have gone.
Geckoboard’s Zendesk integration supports historical time periods, meaning you can easily put together easy-to-read dashboards showing key metrics from the past month, week or day, and even have them sent out automatically over email, Microsoft Teams or Slack.
This is a dashboard summarising the past week’s performance - designed to be posted automatically every Monday morning to the support team’s main channel in Slack or Microsoft Teams, as well as emailed to several members of upper management.
What’s on the dashboard?
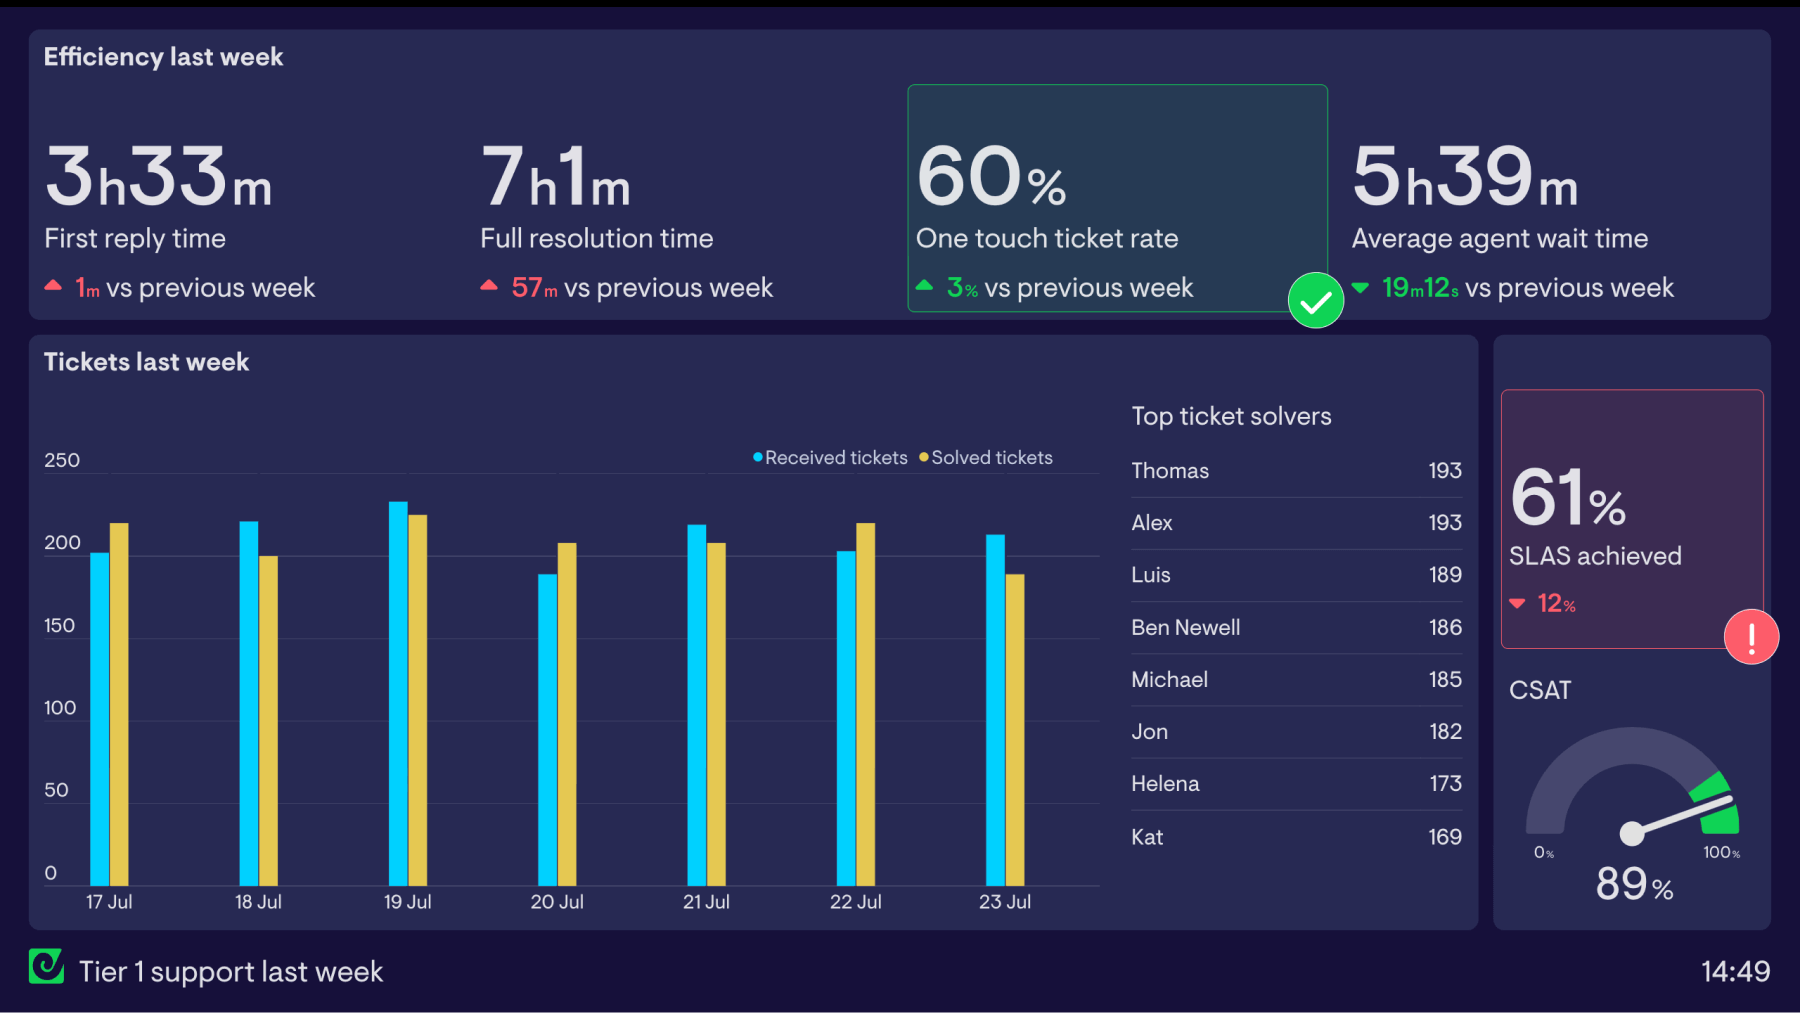
Tickets last week and top ticket solvers: Shows if ticket volume was normal, or if there were any dips or spikes. A leaderboard showing who’s solved the most tickets gives top performers the recognition they deserve.
SLAs achieved and CSAT: Indicates how well the team performed against its targets, and whether they’ve ultimately been delivering the standard of support customers expect.
Efficiency last week: Across the top of the dashboard are several metrics that indicate how efficient the team has been at solving ticket over the past week, vs the previous week: First reply time, full resolution time, one touch ticket rate and average agent wait time.
Zendesk Messaging dashboard
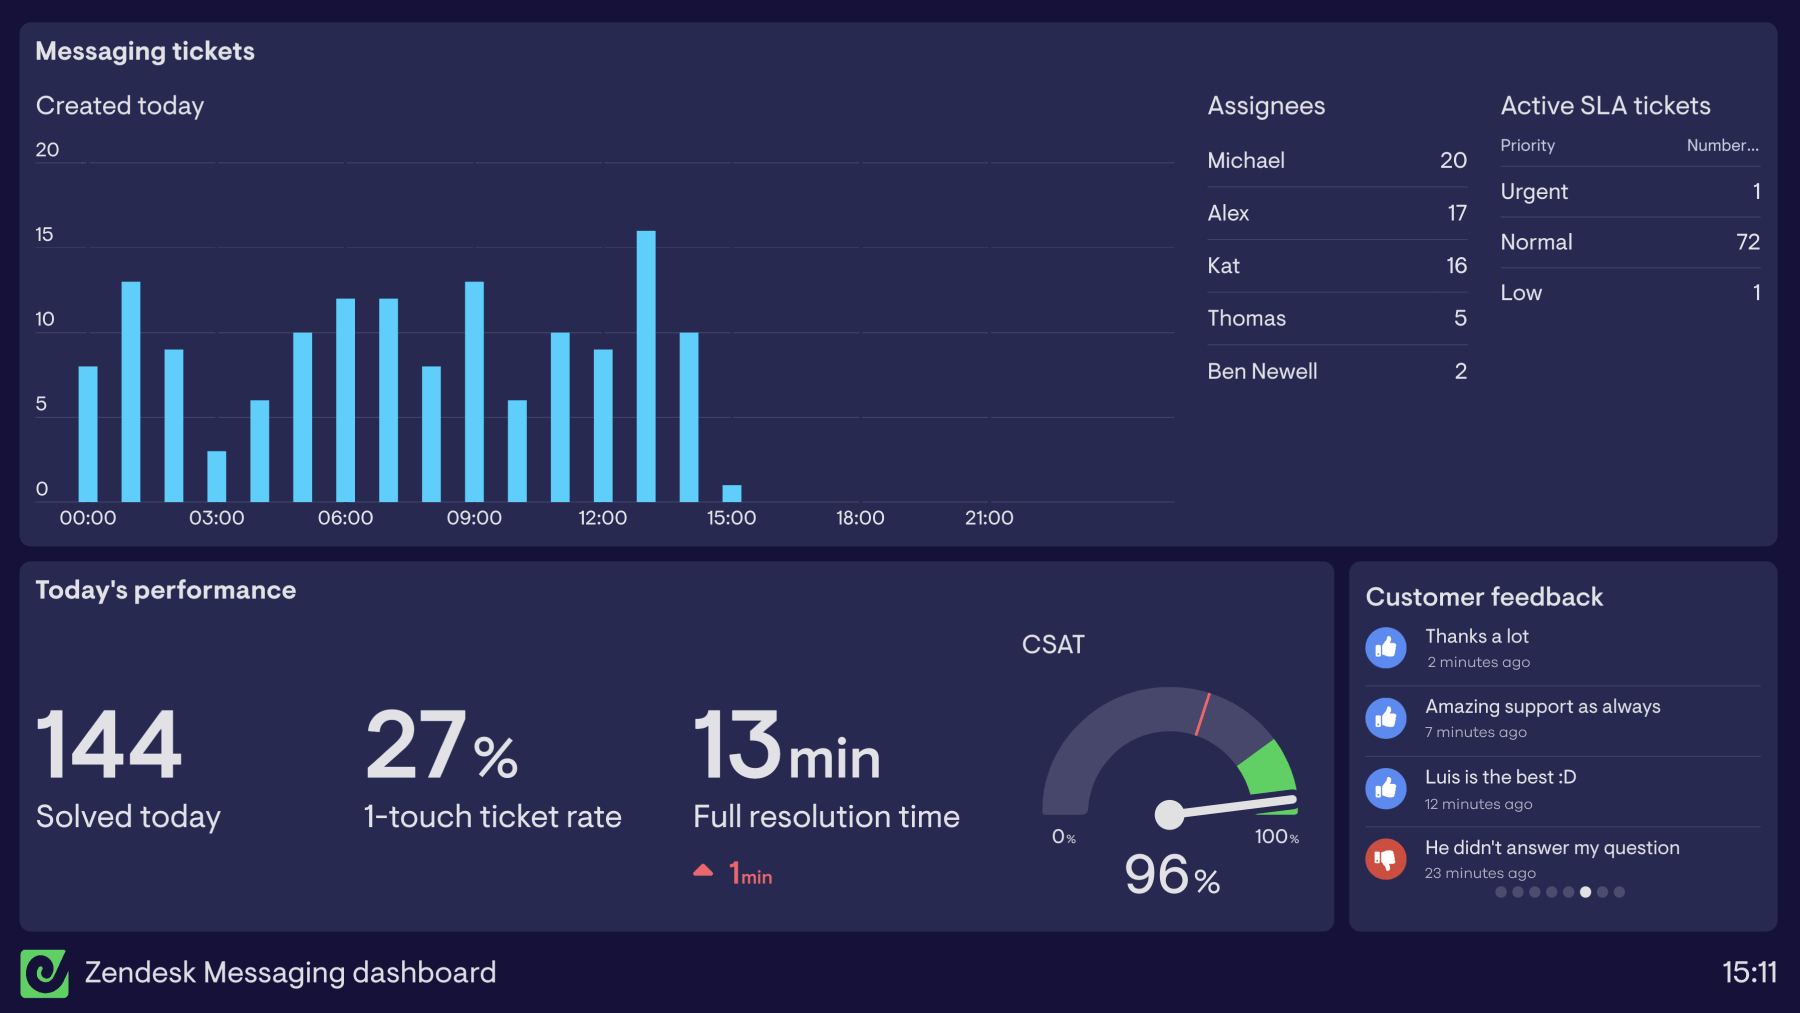
Because conversations in Zendesk Messaging create tickets when they're picked up by an agent, you can monitor certain Messaging metrics by using Geckoboard's Zendesk Support integration. Metrics like tickets created, full resolution time, active SLA tickets and CSAT can all be dialled in for Messaging by adding the filter 'Channel is native messaging'.
This dashboard is an example of what's possible if you're looking to keep an eye on this channel throughout the day.
Live omnichannel agent status dashboard
If you’re using Zendesk Messaging, or leaning heavily on omnichannel routing rules to assign agents work items, you’ll know how important it is to balance workload appropriately across agents and channels throughout the day. Being able to see in real-time which agents are online, away or offline, how many queries are coming in via different channels and what each agent’s capacity is is crucial for doing this effectively and fairly.
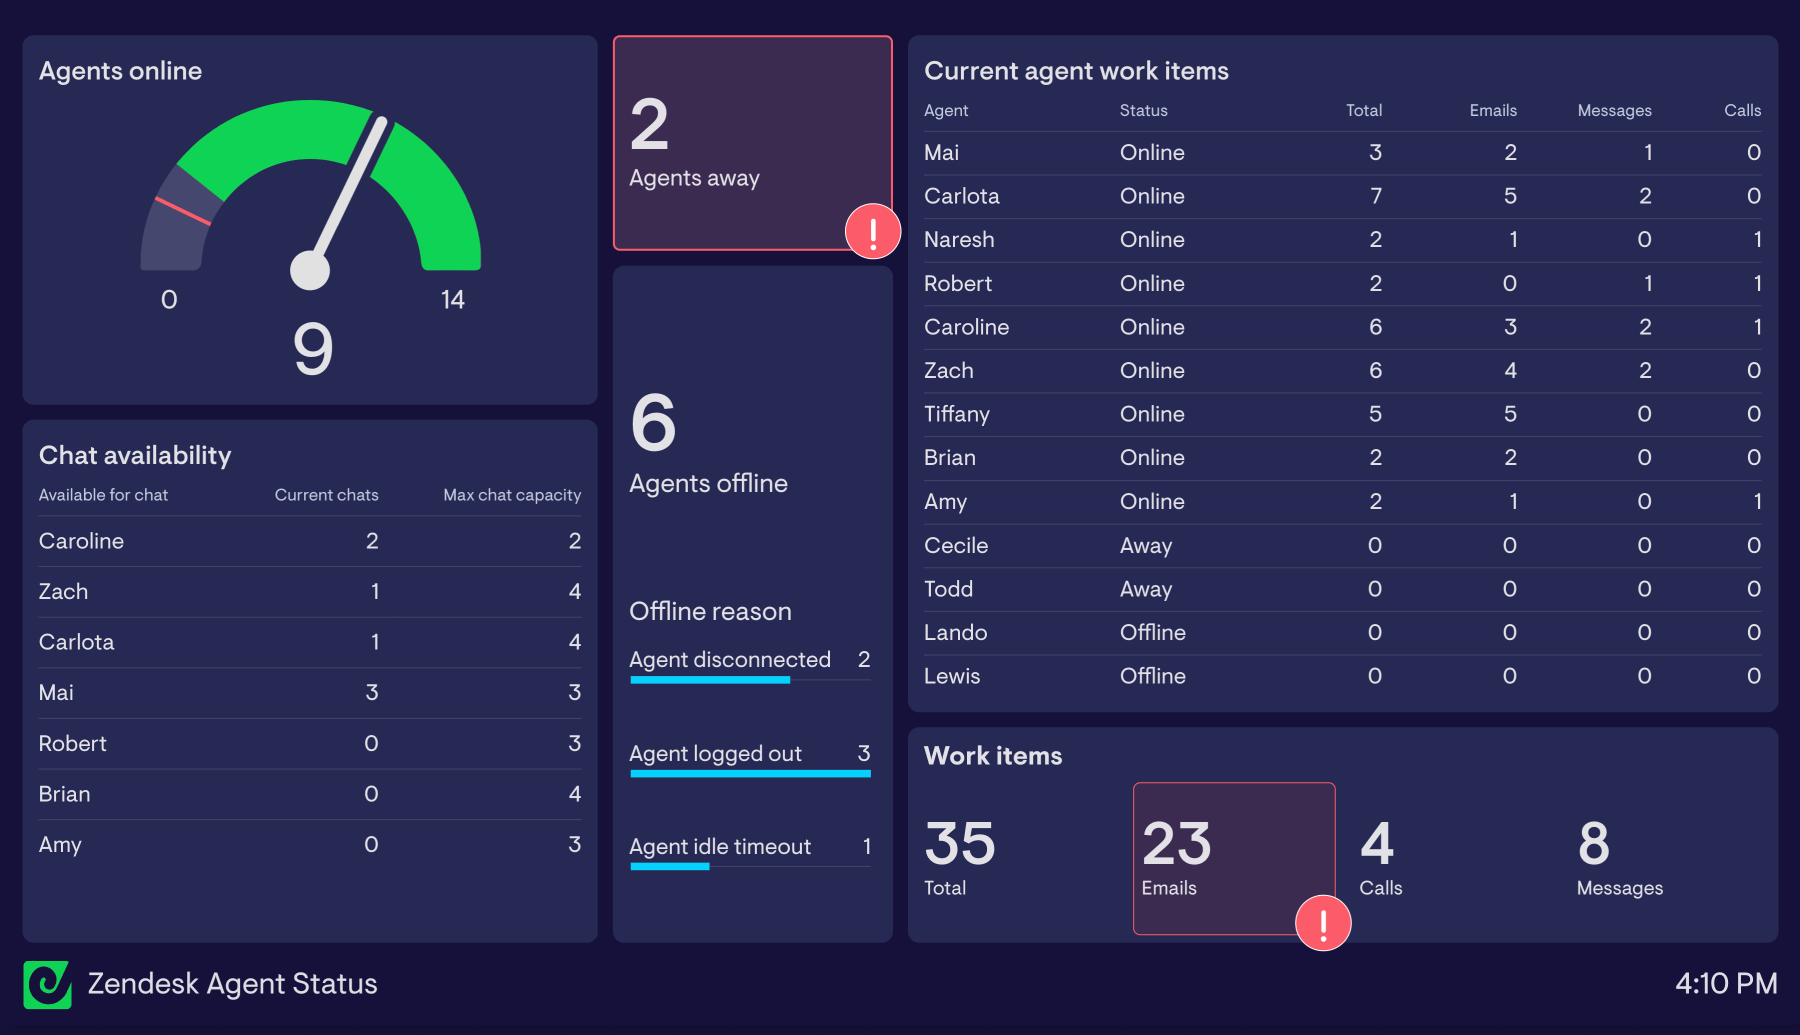
Geckoboard has a standalone integration with Zendesk’s Agent Status API, allowing you to easily spin up a dashboard containing unified agent status and workload metrics - or add them to your existing dashboards containing metrics from Support, Chat, Talk or Sell.
What’s on the dashboard?
- Number of agents currently online, away and offline
- Reasons for agents who are set to offline
- Current work items owned by each agent, broken out by channel (email, messaging, calls)
- Individual agent status
- Total number of work items owned by the team, broken out by channel
- Agent availability, workload and capacity, specifically for Chat
Browse other popular examples
A Zendesk dashboard gives support managers and team leads a real-time view of ticket volume, agent performance, SLA compliance, and customer satisfaction — pulled directly from Zendesk. It's designed to be displayed on a support floor TV or shared screen so the whole team can see live queue status without checking Zendesk individually.
Geckoboard is a live dashboard tool that connects to Zendesk Support, Chat, and Talk alongside Intercom, Aircall and more to display support metrics in real time. It's designed to run on a TV in the support team's workspace — keeping queue status, response times, and CSAT visible to everyone, at all times.
Key metrics include open tickets, tickets resolved today, first response time, average resolution time, CSAT score, SLA compliance rate, and agent ticket counts. Live queue dashboards show the current state of the inbox in real time.
Building a custom Zendesk dashboard is straightforward with Geckoboard's dashboard builder. Connect Zendesk Support to pull ticket, agent, and SLA data automatically into a live dashboard, then pick your metrics and build the view you need. Share with your team as a TV dashboard, shared link, or scheduled snapshot. Start a free trial or learn more about how Geckoboard works.
Use it to monitor performance in real time so support managers can see queue pressure building and act on it before SLAs are breached. It also helps make team performance visible — displaying live Zendesk metrics on a shared screen that keeps agents aware of their own performance and the team's progress throughout the shift.