What is a call center dashboard?
A call center dashboard (or contact center dashboard) visualizes live metrics such as number of calls, wait time, and Customer Satisfaction (CSAT). This enables call center teams to create a better customer experience by quickly reacting to changing situations.
In physical call centers, these dashboards are usually displayed on TVs where everyone can see them. However, they are also used by remote and hybrid teams. By creating greater awareness and visibility for key metrics, these dashboards make it more likely that issues are spotted early, and resolved quickly. They also provide a focal point for performance measurement, helping motivate the team to achieve their goals.
Examples of call center dashboards
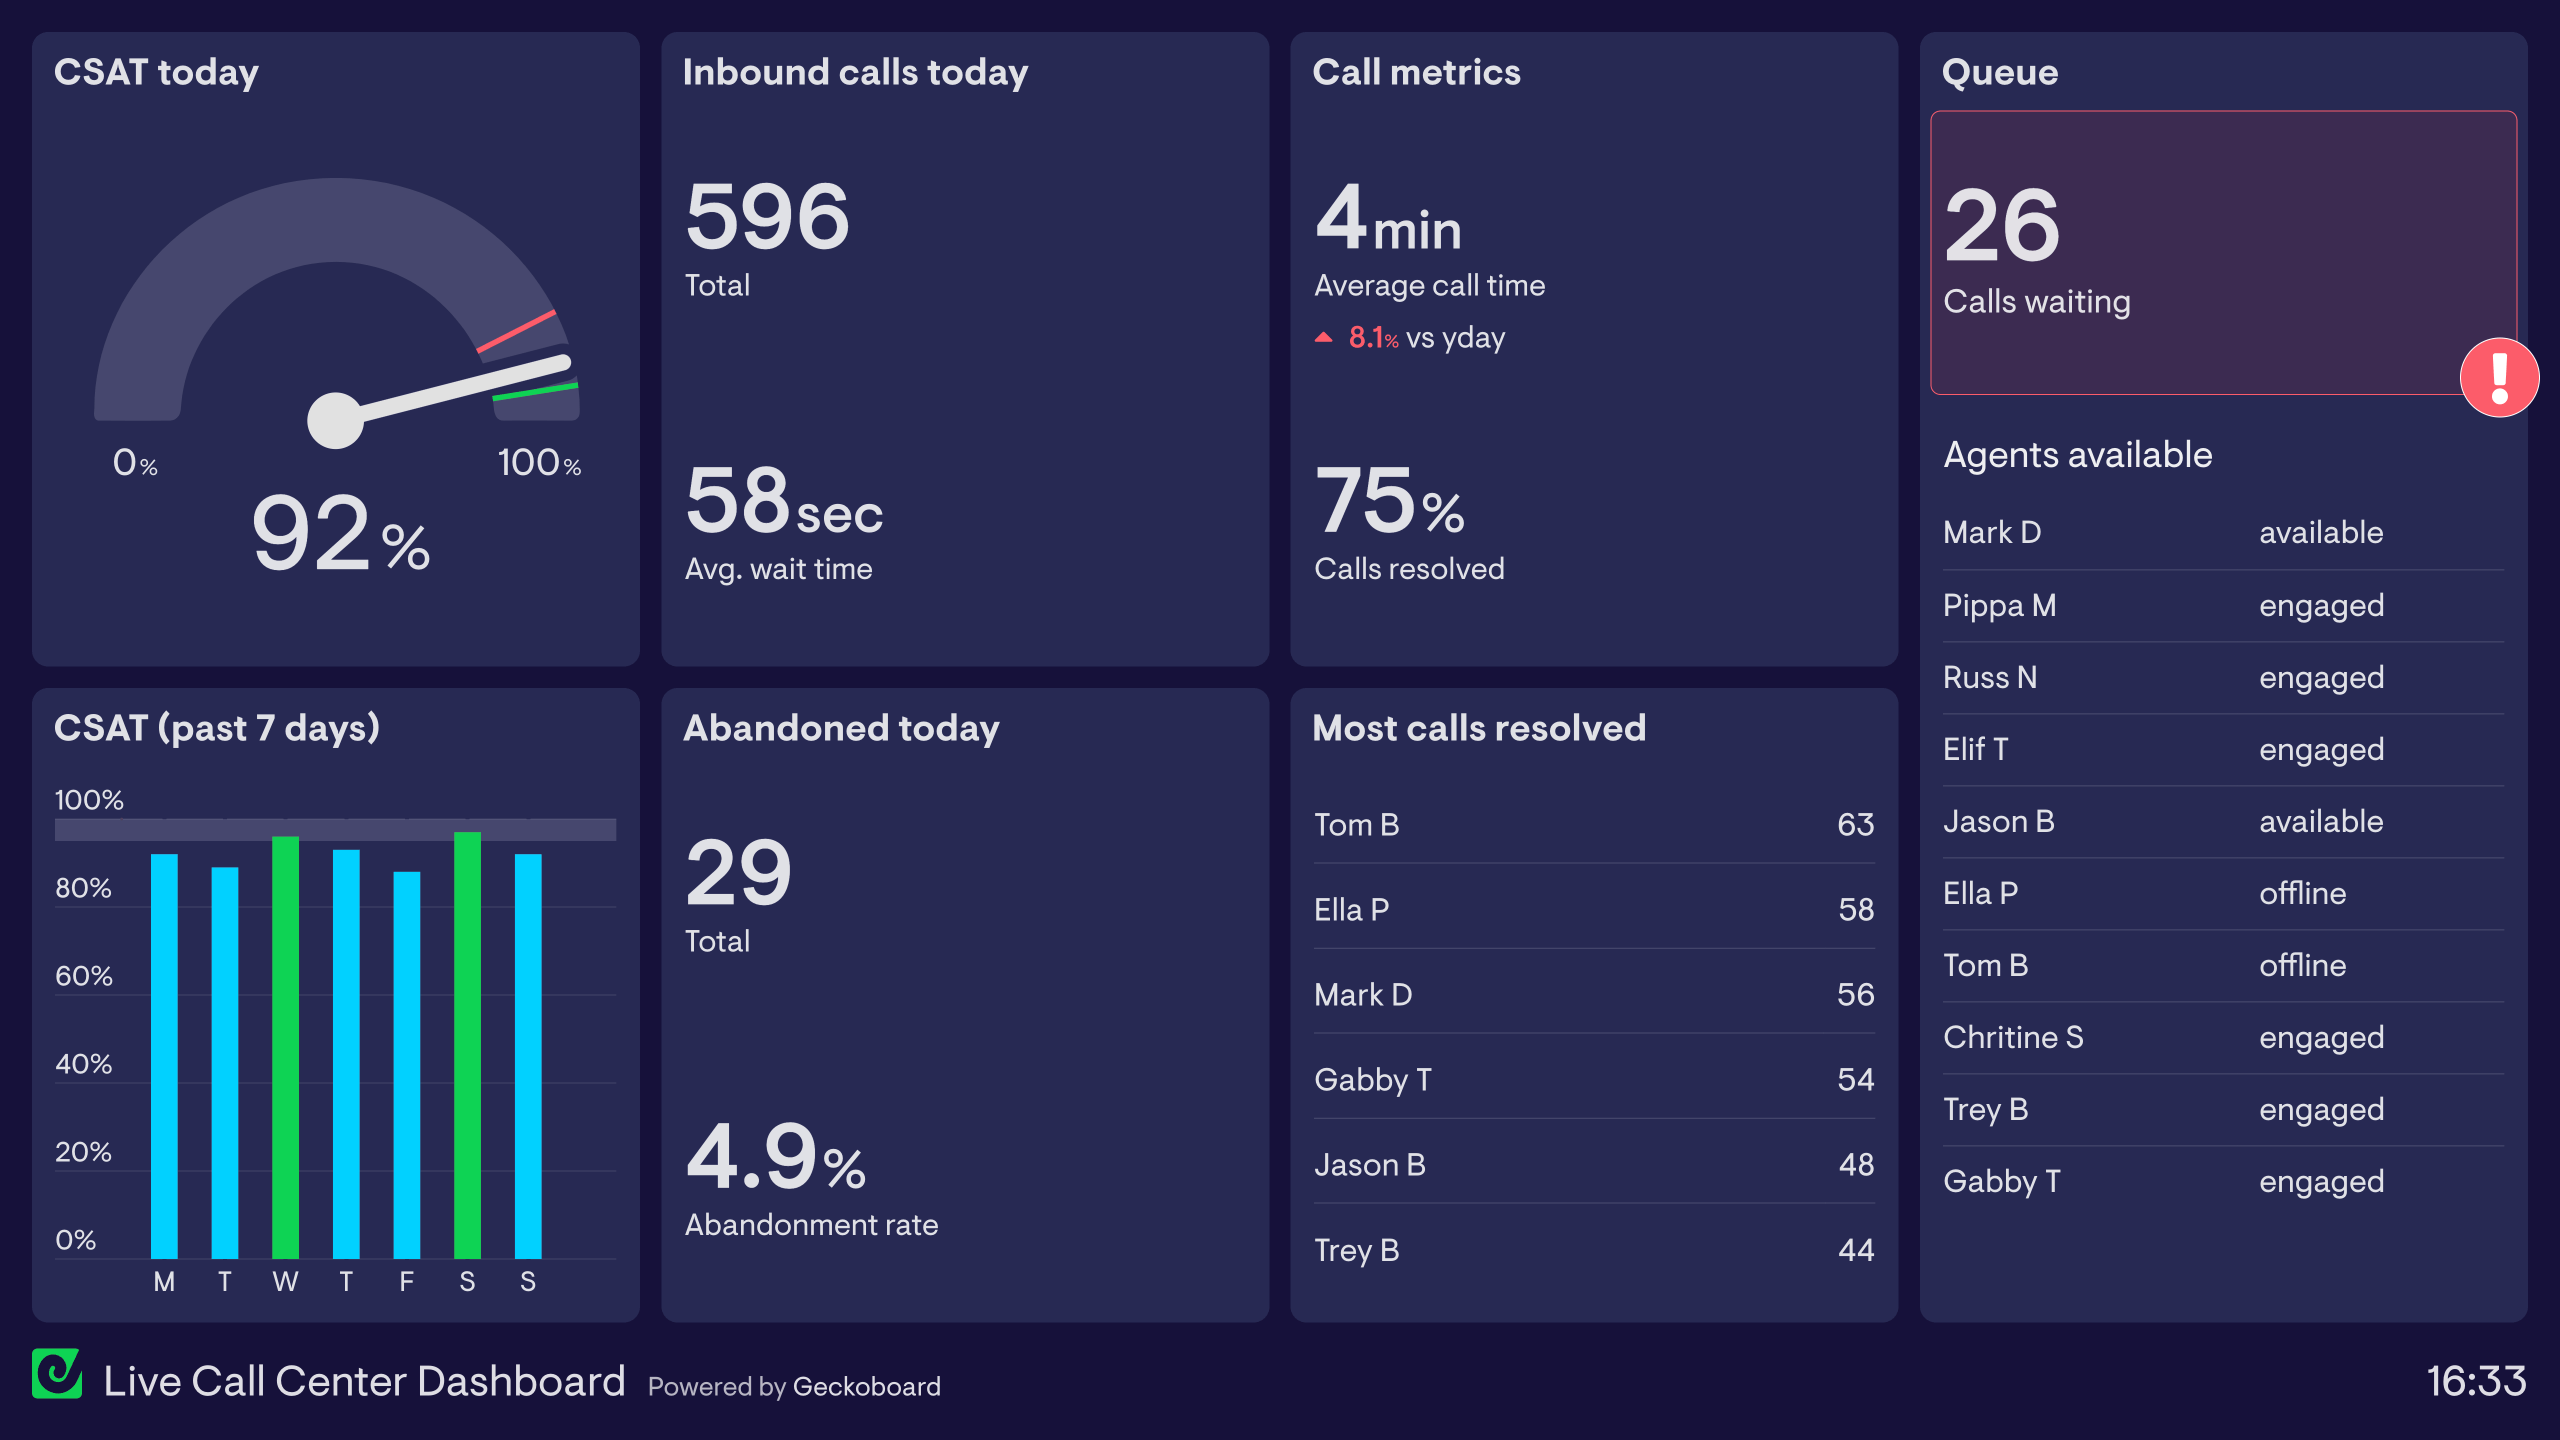
Live call center dashboard
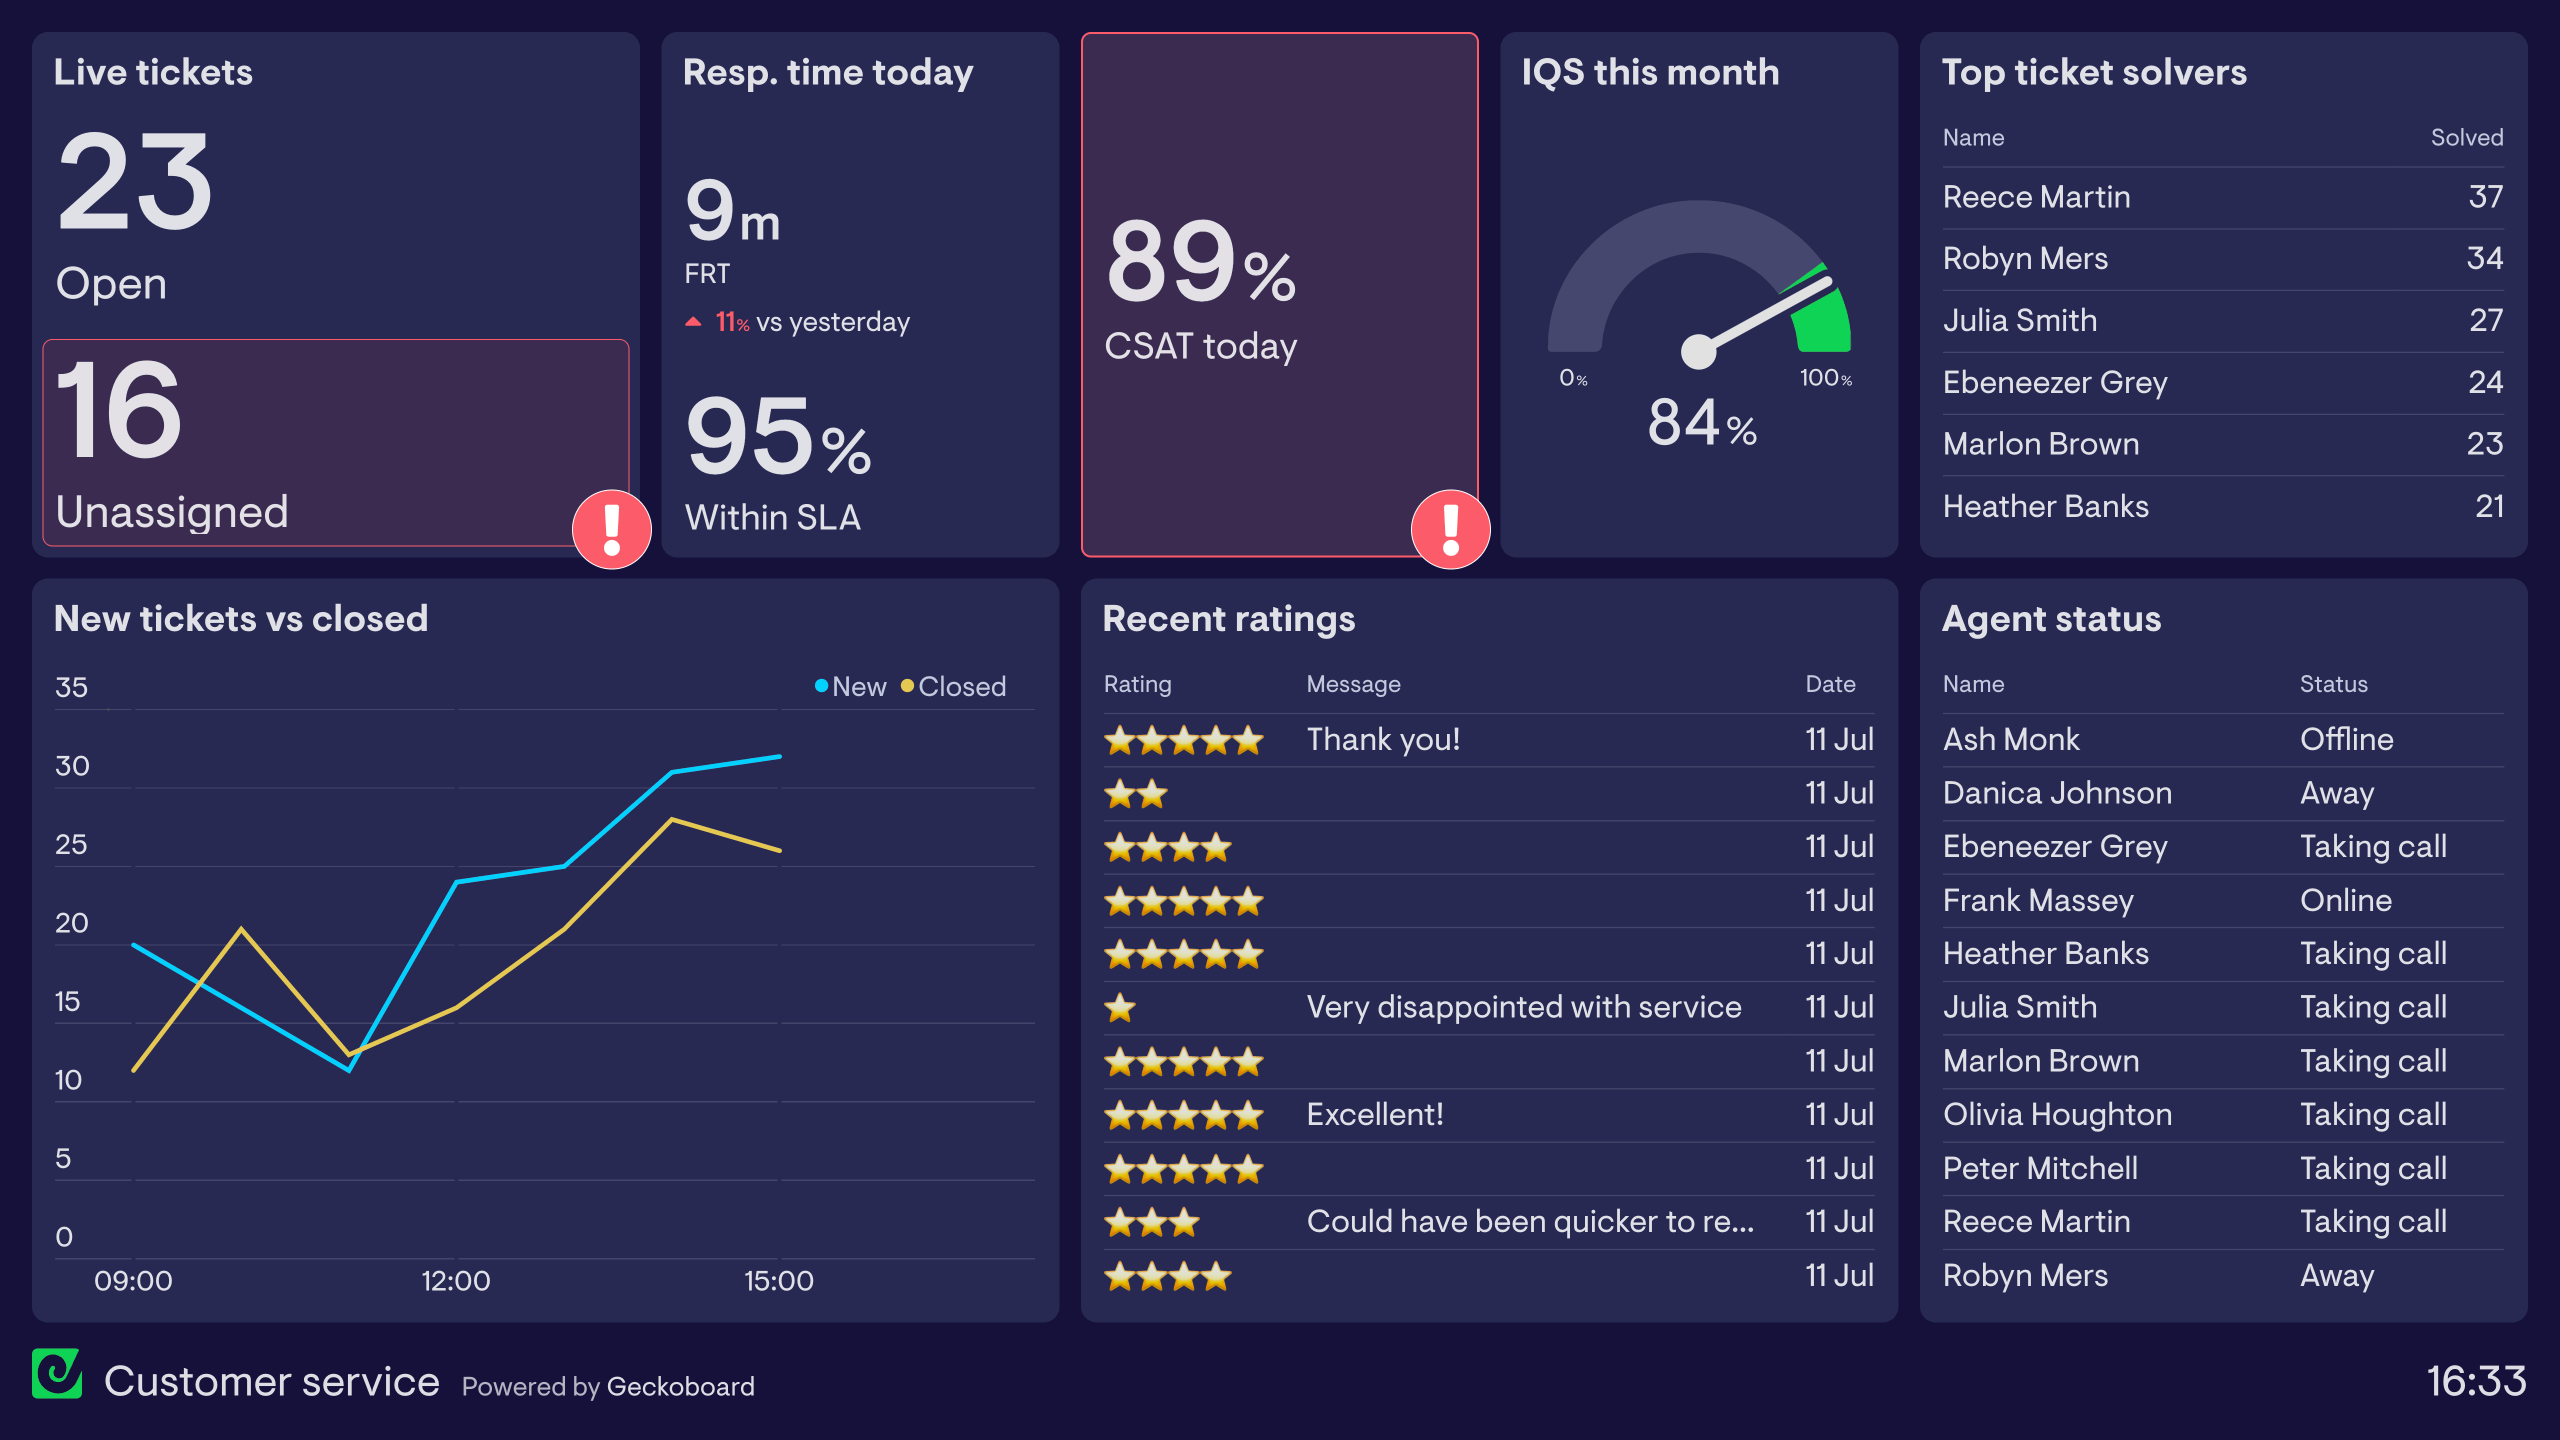
This dashboard is primarily focused on live data, which shows how the team is performing on that day. On the left, we can see the team’s Customer Satisfaction score (CSAT) today, visualized alongside their daily CSAT scores for the previous seven days. Their target is to achieve a CSAT score of above 95%, and this is highlighted in green when they do. Positive feedback loops like this can focus performance and improve motivation; If you’re thinking about gamifying a call center, this guide to gamification for support and sales teams explains how to do it with live KPIs (not gimmicks).
Next, we have information on the volume of calls that day, as well as Average Wait Time, and Abandonment Rate. Here the team can see if they are keeping up with customer demand. If they weren’t, they would expect to see the Wait Time and Abandonment Rate increase throughout the day. This focus on responding to call volume is balanced by a metric that shows the percentage of successful call resolutions, including a leaderboard for the most call resolutions by agent.
Finally, on the right, we can see the number of calls waiting right now, as well as the live status of agents. This alerts the team when they are experiencing a high volume of calls so they can react quickly.
Focus area
Inbound calls
Who looks at it?
Call center team, team leader
How often?
Continuously
- Zendesk SupportAircallRingCentralFreshdesk
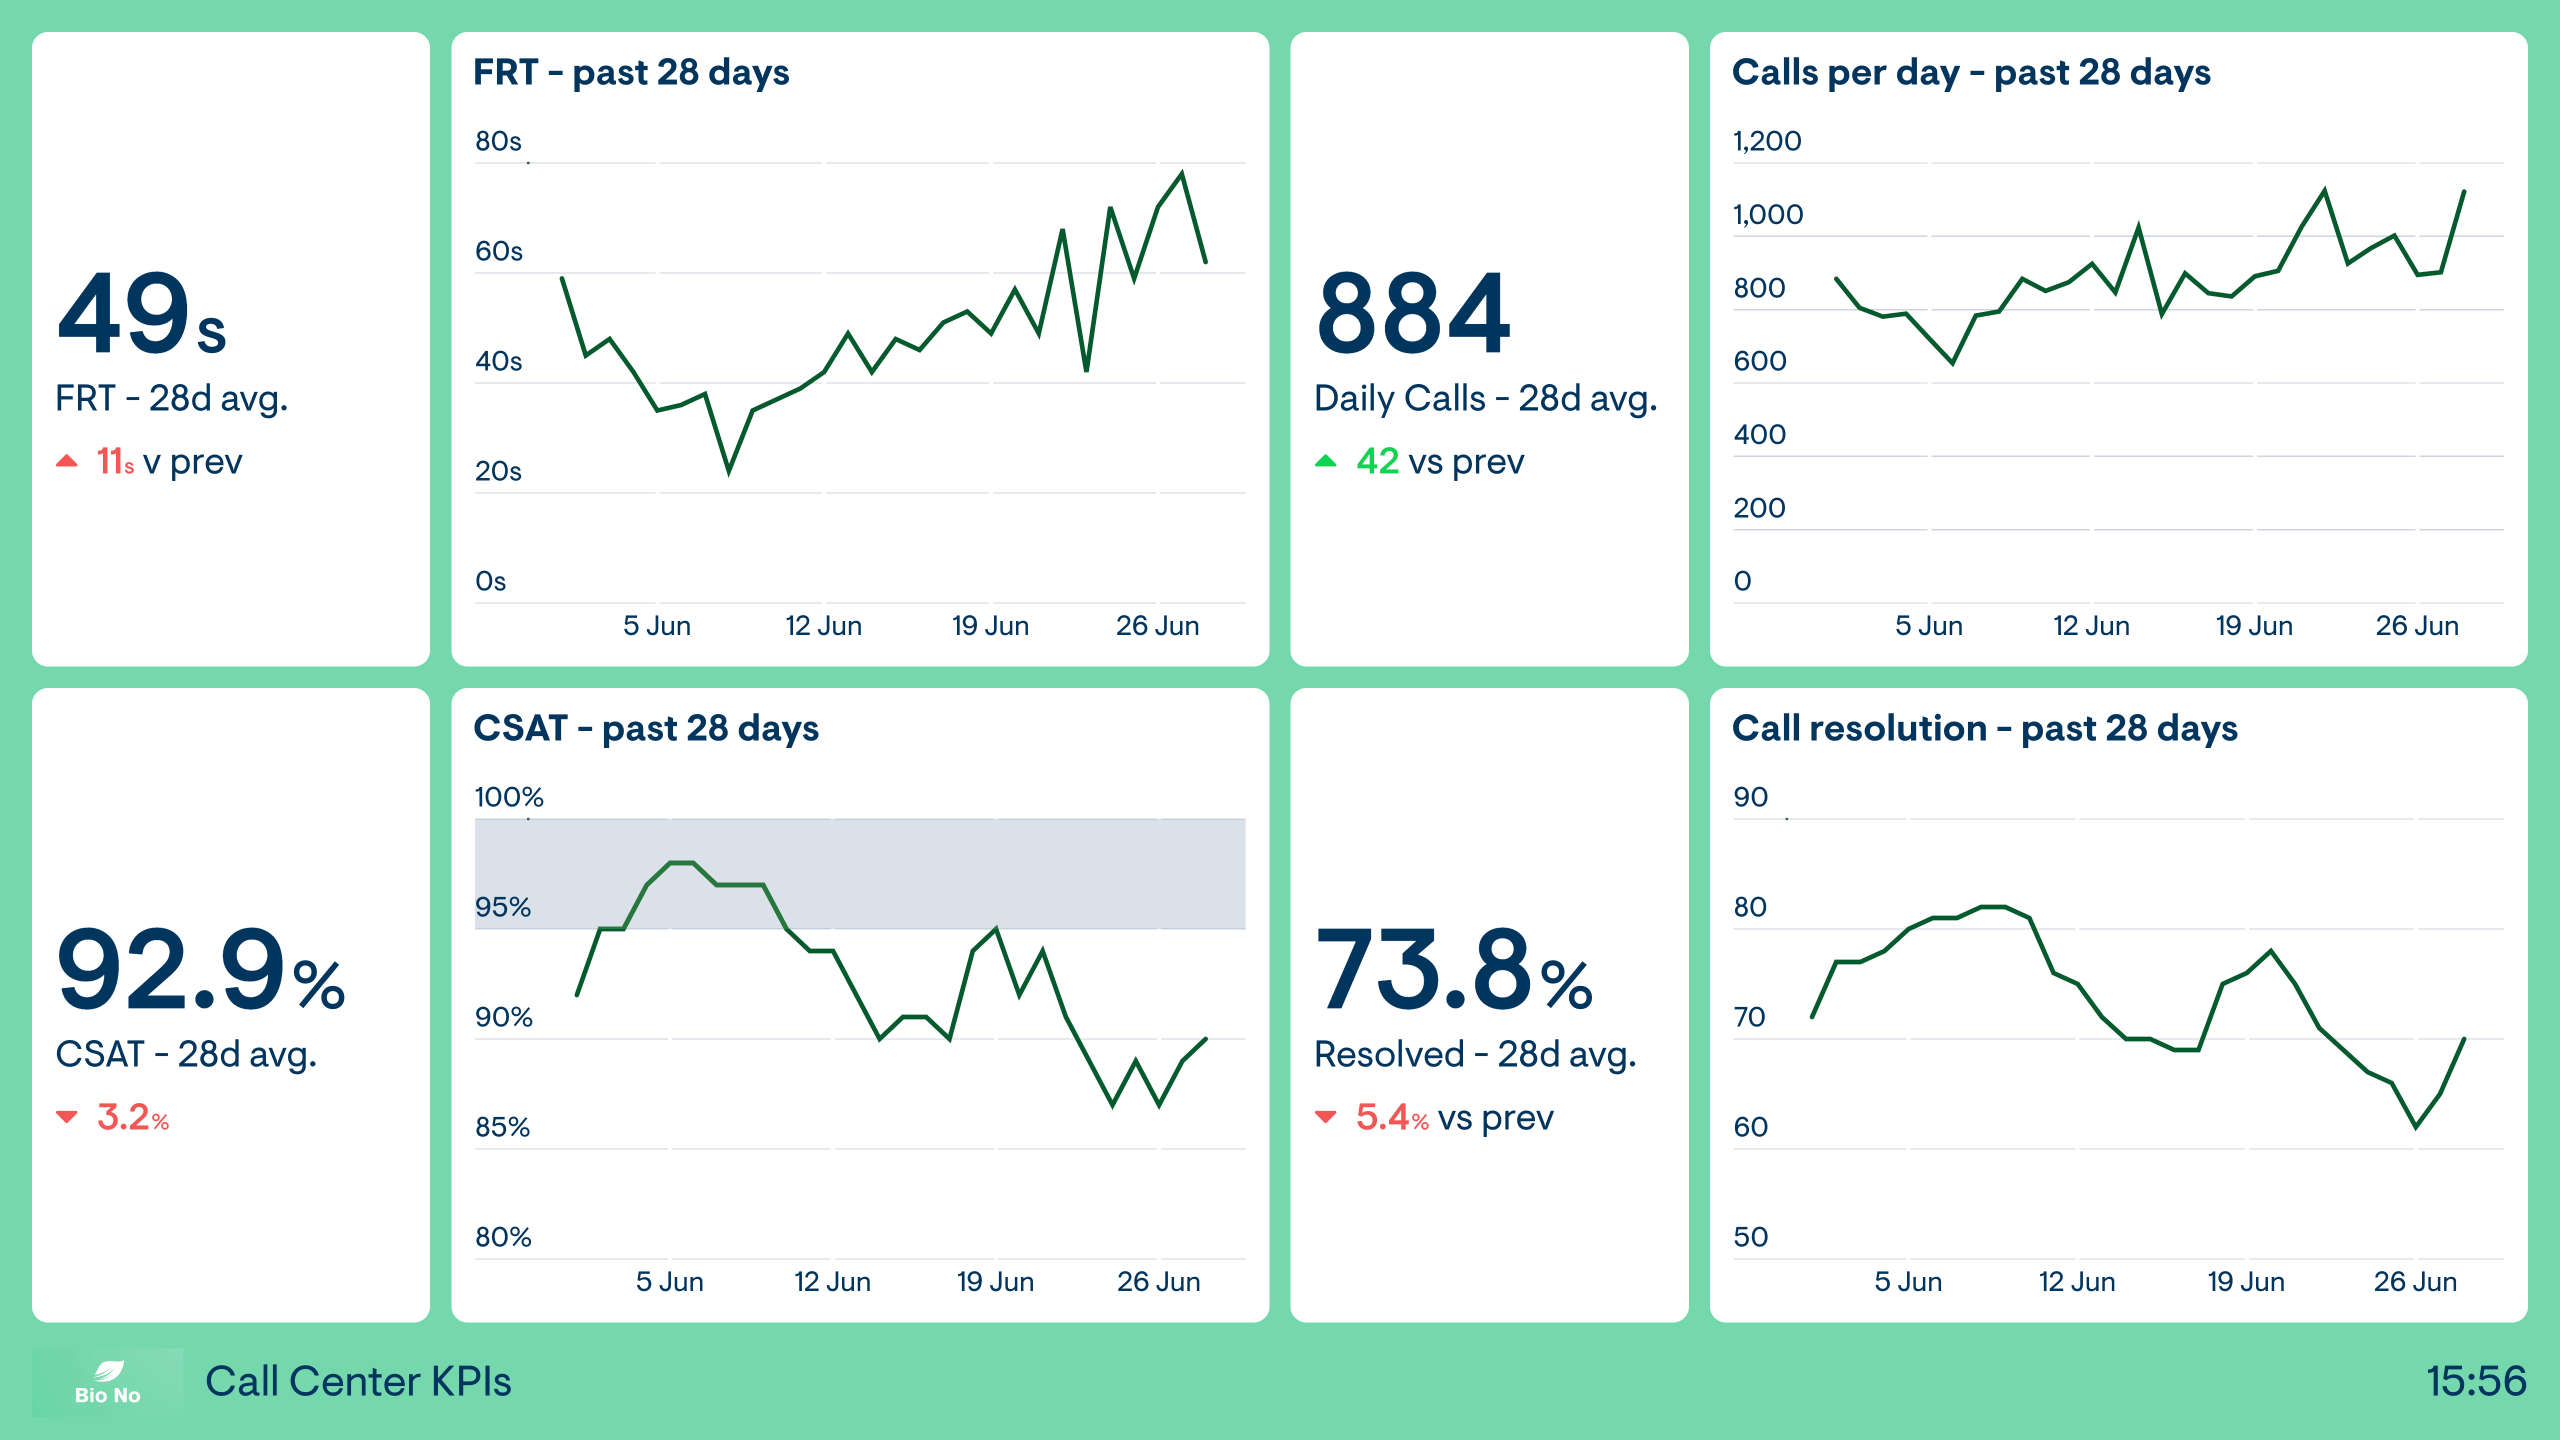
Call center KPIs
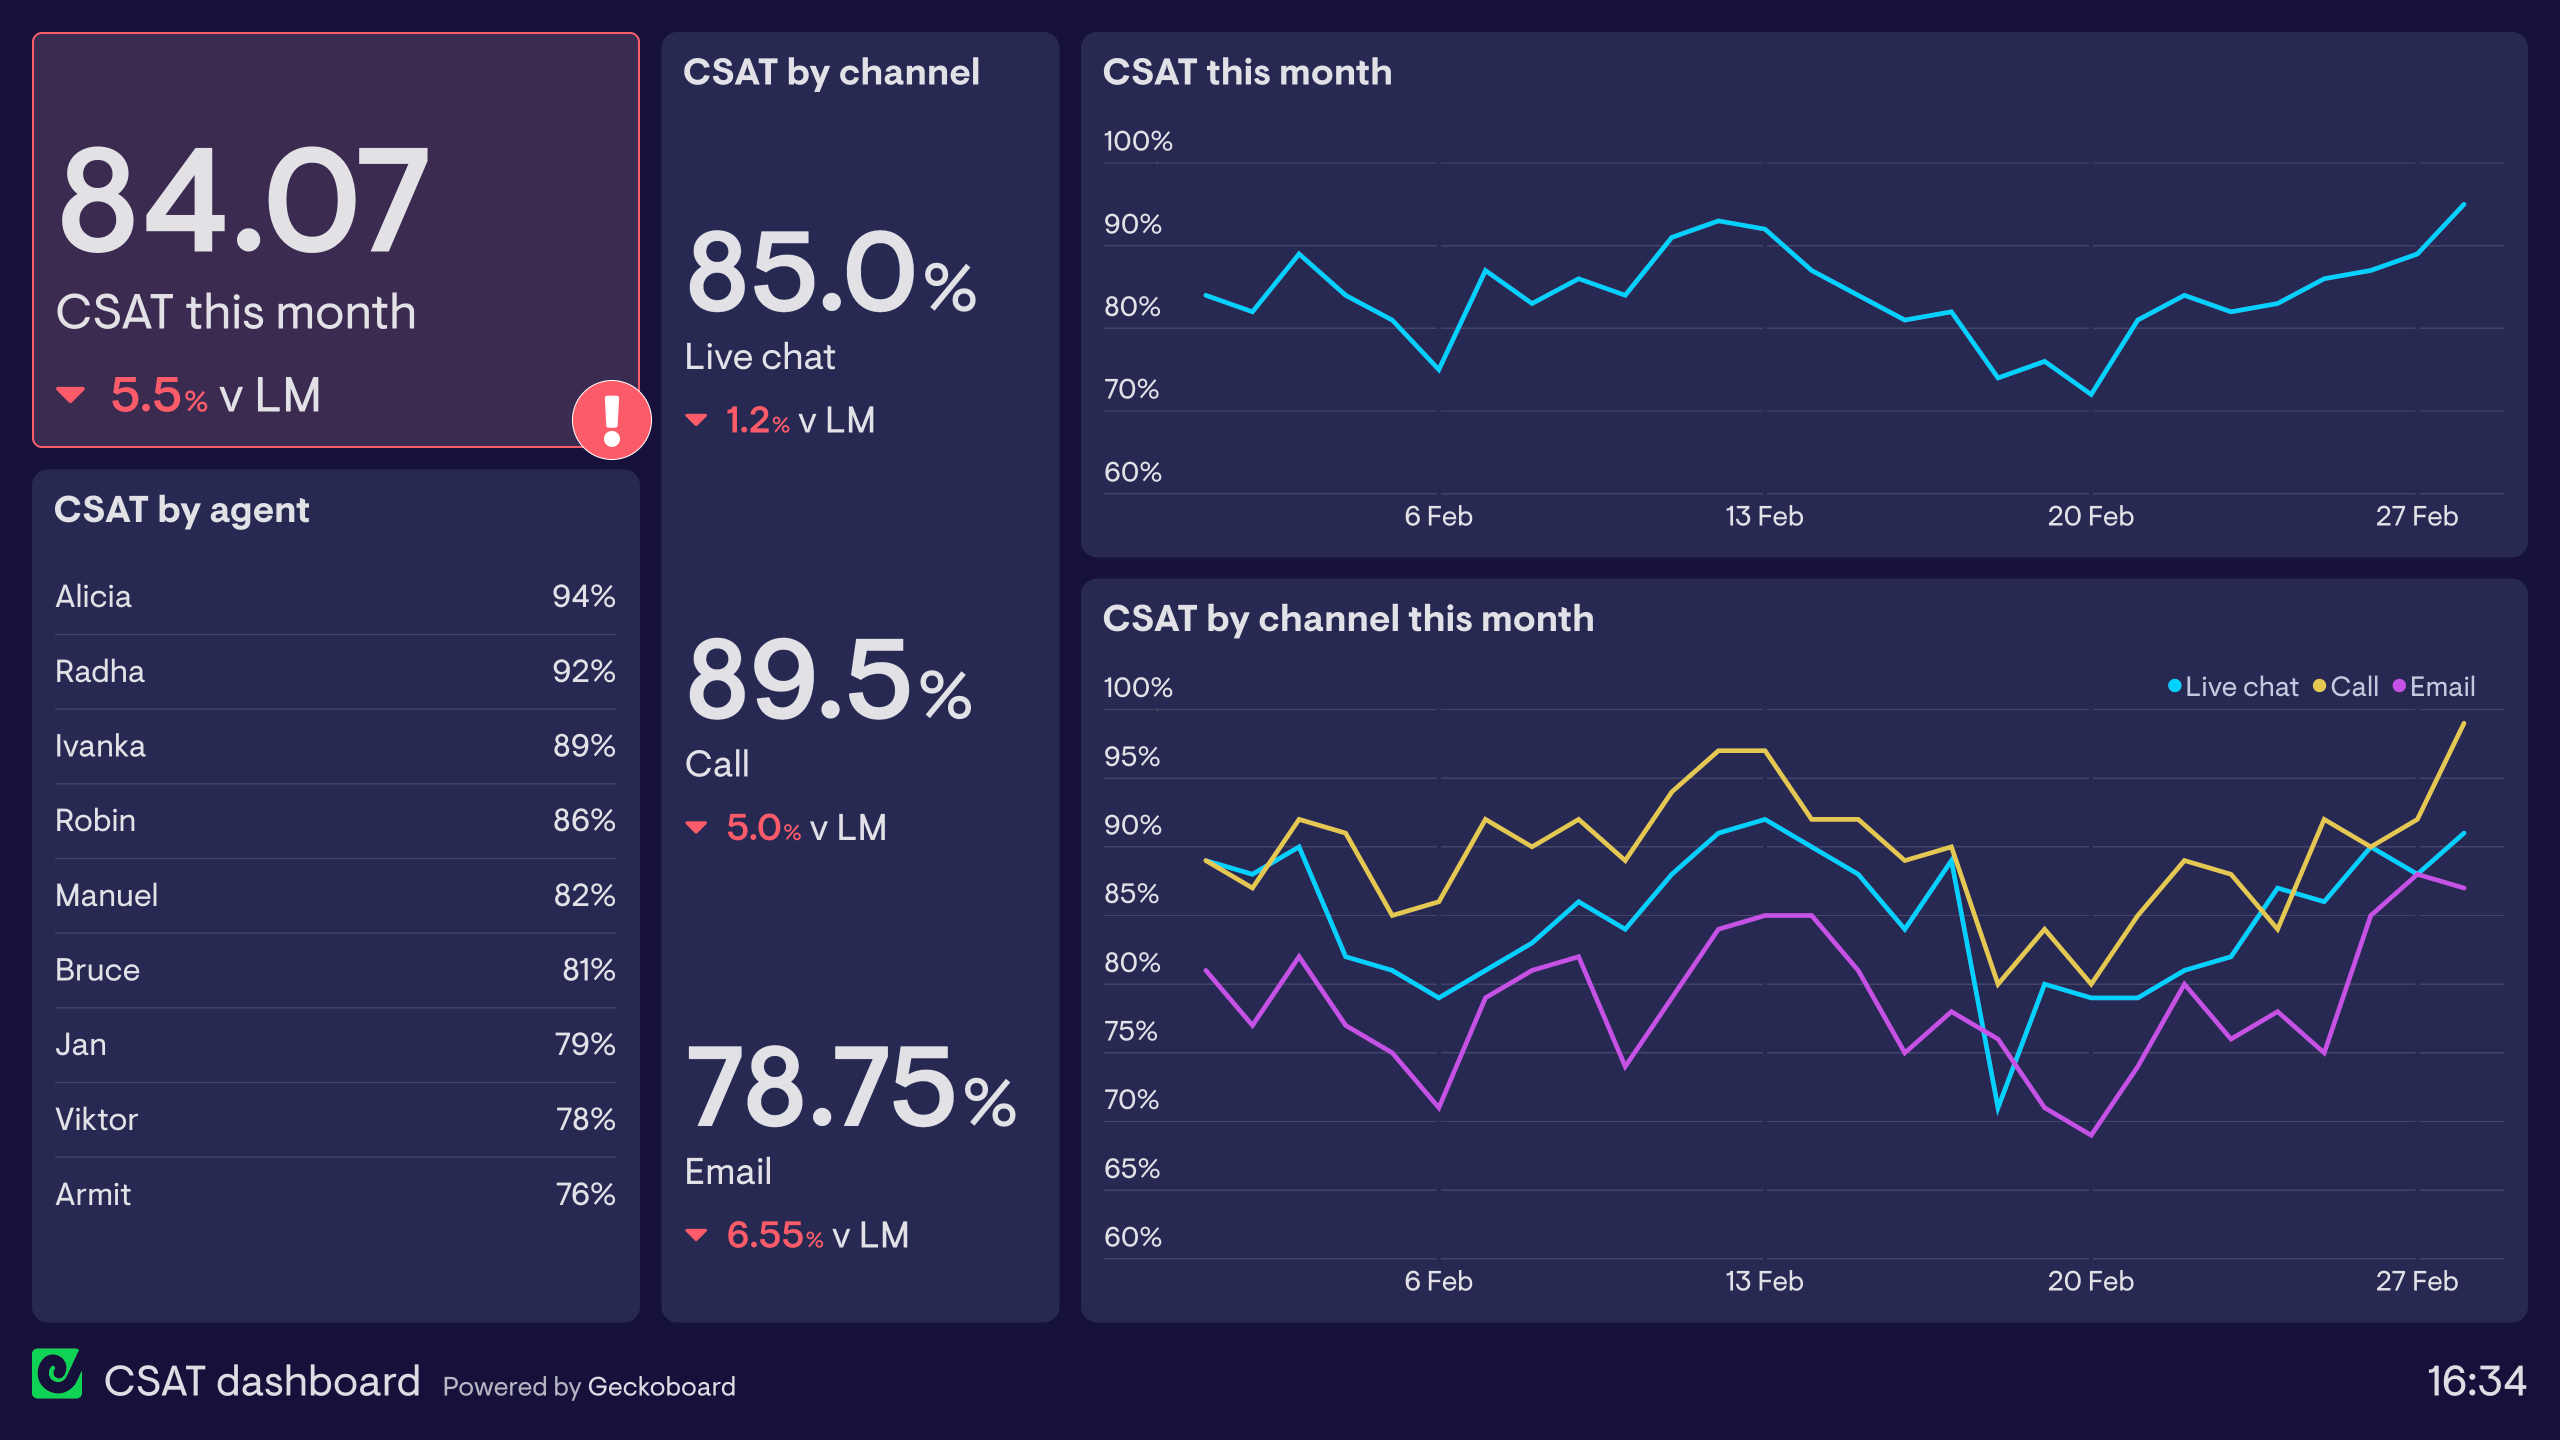
This call center dashboard is less focused on performance that day, and more focused on the overall KPI trends for the month. This broader perspective allows teams and team leaders to put their key metrics in context, so they can improve performance in the long term. It also helps them understand how call volume is changing so they can better allocate resources.
In particular, this dashboard is visualizing four KPIs: First Response Time (FRT), the average time taken to respond to each call; Customer Satisfaction (CSAT) taken from a short post-call survey; Calls per Day; and Call Resolution, which is the percentage of calls successfully resolved.
Focus area
Team performance
Who looks at it?
Call center team, team leader
How often?
Every day
- Zendesk SupportAircallFreshdeskRingCentral