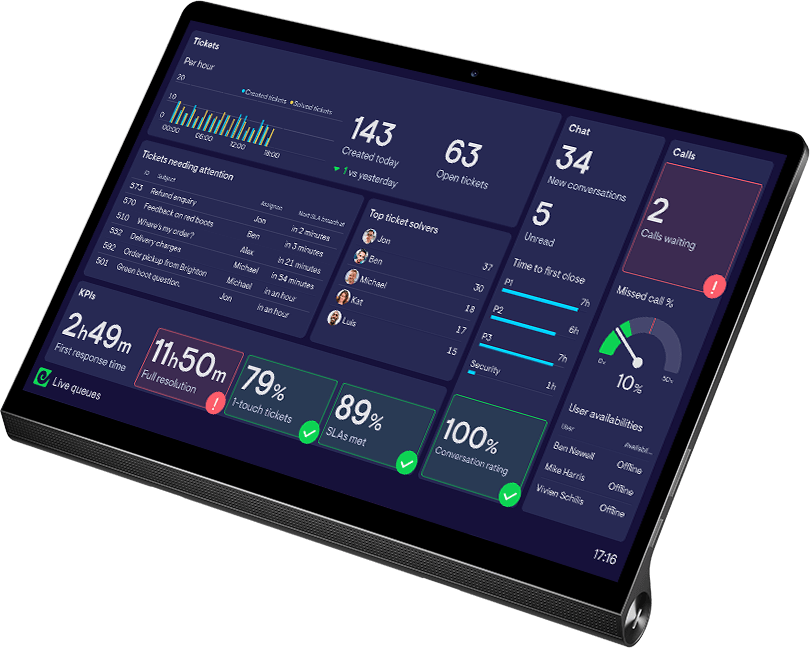
Real-Time Zendesk Dashboards for Support Teams
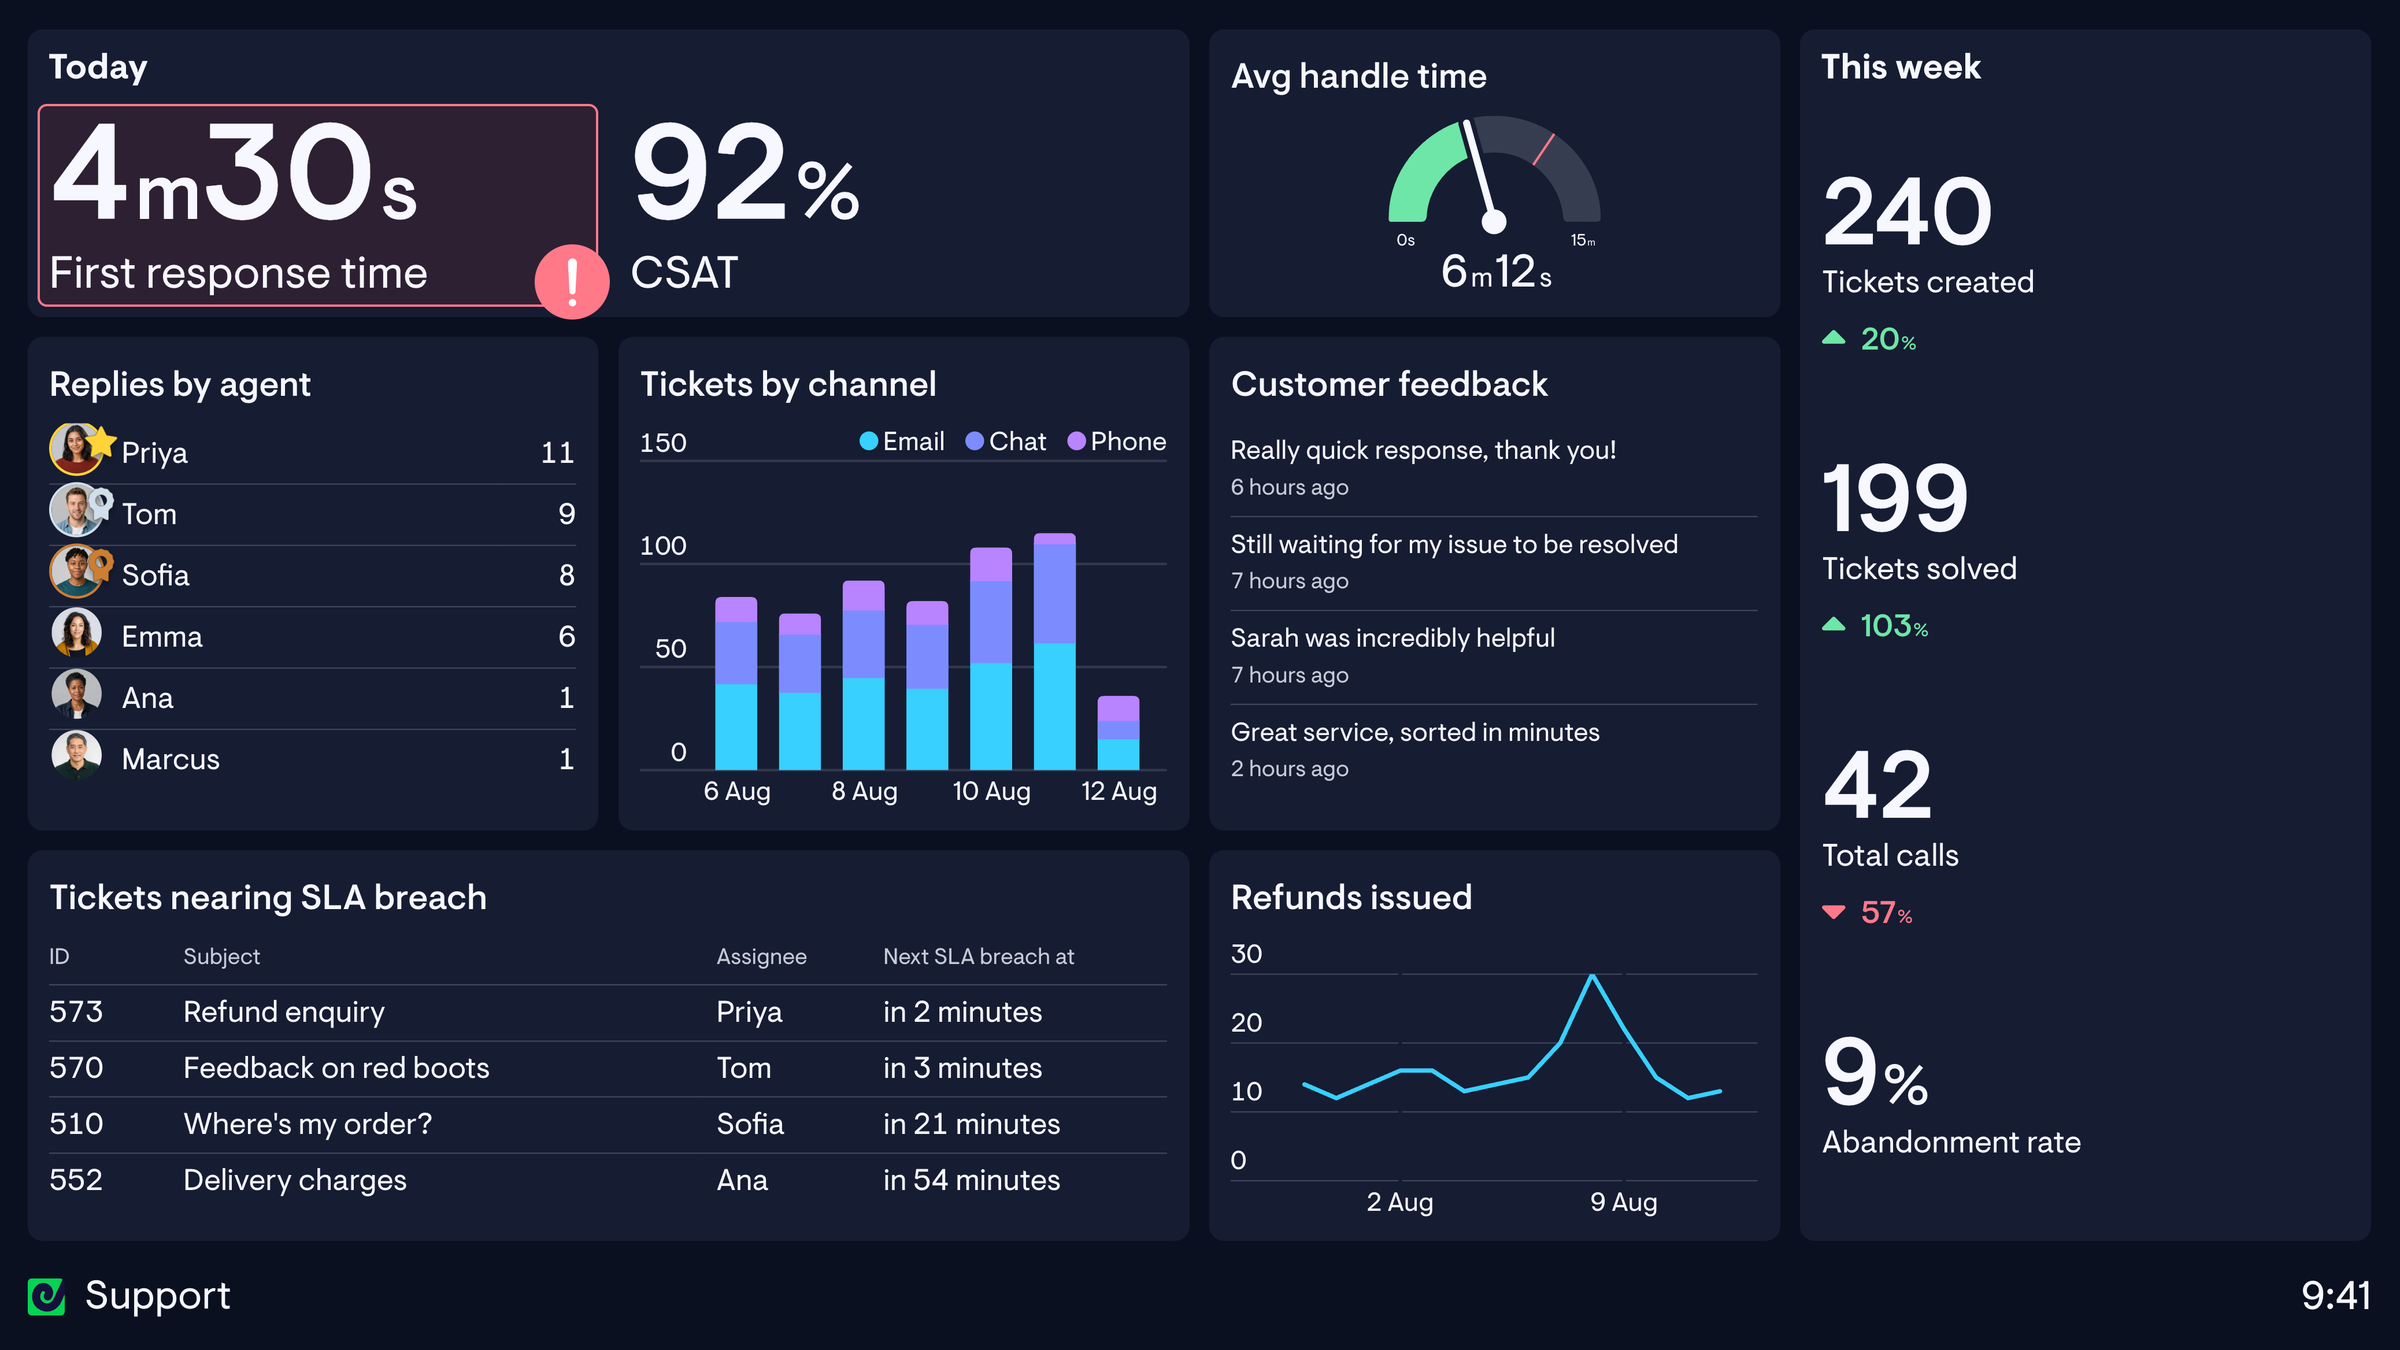


Real-time Zendesk data alongside 90+ other tools
Trusted by 1,000s of customer service teams
When support teams can see their data, they thrive
In most support teams it’s only managers who regularly look at the data. It’s out of sight, hard to use, and arrives late. But when teams can see what’s happening in real time, they self-correct and leaders don’t have to micromanage.
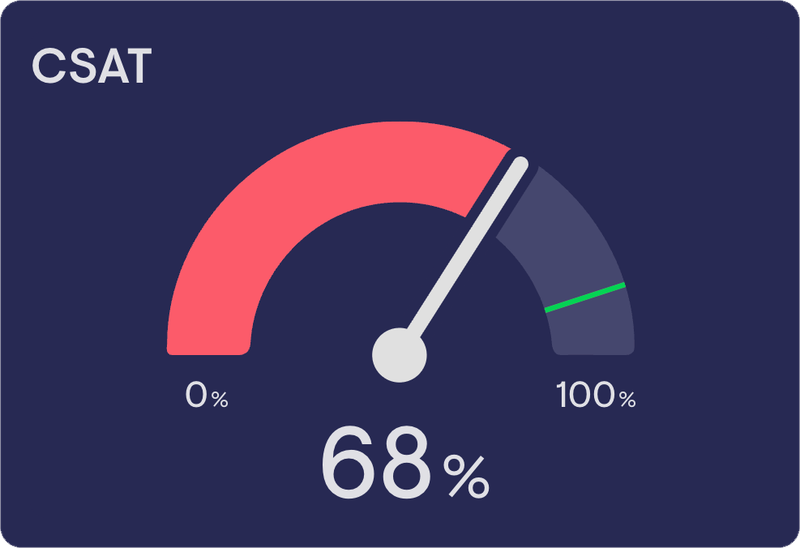
See when metrics go off track while there’s still time to fix them.
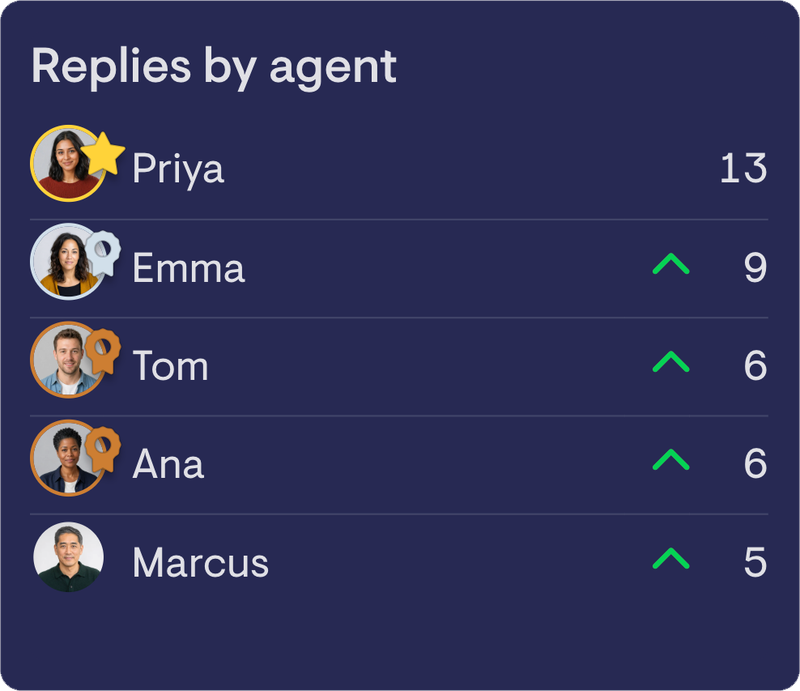
Recognize great work and boost motivation.
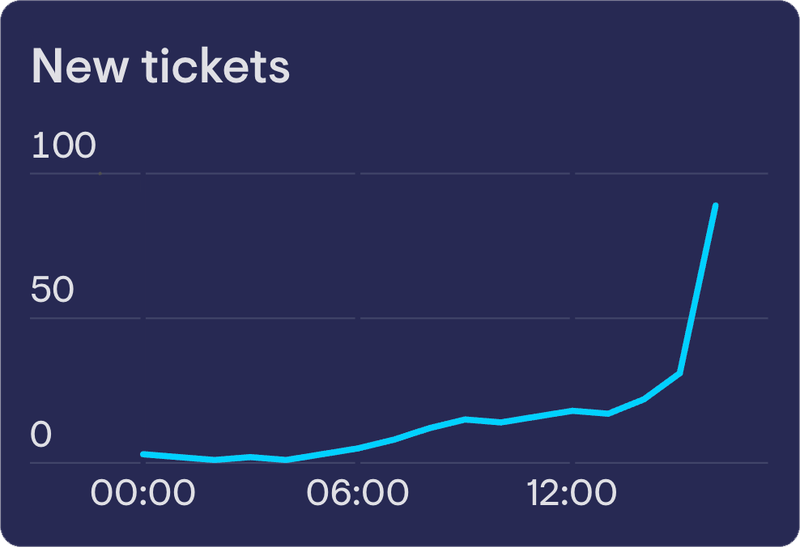
Manage workloads when volumes spike.
See the difference it makes

The dashboard is a great incentive for our teams, we use it throughout the day to motivate agents with competitions around top call answerer or top ticket resolver.

The dashboard creates transparency for the team and autonomy for the agents. It helps them to figure things out by themselves, removes unnecessary communication and avoids micromanagement.

Geckoboard makes your Zendesk data useful
Zendesk Support Zendesk Chat
 Zendesk Talk
 Zendesk QA
 Zendesk Sell
Customize your Zendesk metrics
Geckoboard comes with all the key support metrics across the Zendesk Suite, covering tickets, messaging, voice and QA, pre-calculated and ready to customize.
Filter, split and visualize them however you need. Construct metrics from your own custom fields. If there’s something missing, we can usually add it.

Bring all your support data into one place
Combine data from across the Zendesk suite, as well as multiple Zendesk accounts, on the same dashboard.
Also, add data from 90+ other sources, including Salesforce, HubSpot, Shopify, Jira, Pipedrive, Aircall and Google Sheets.
Share your metrics with the whole team
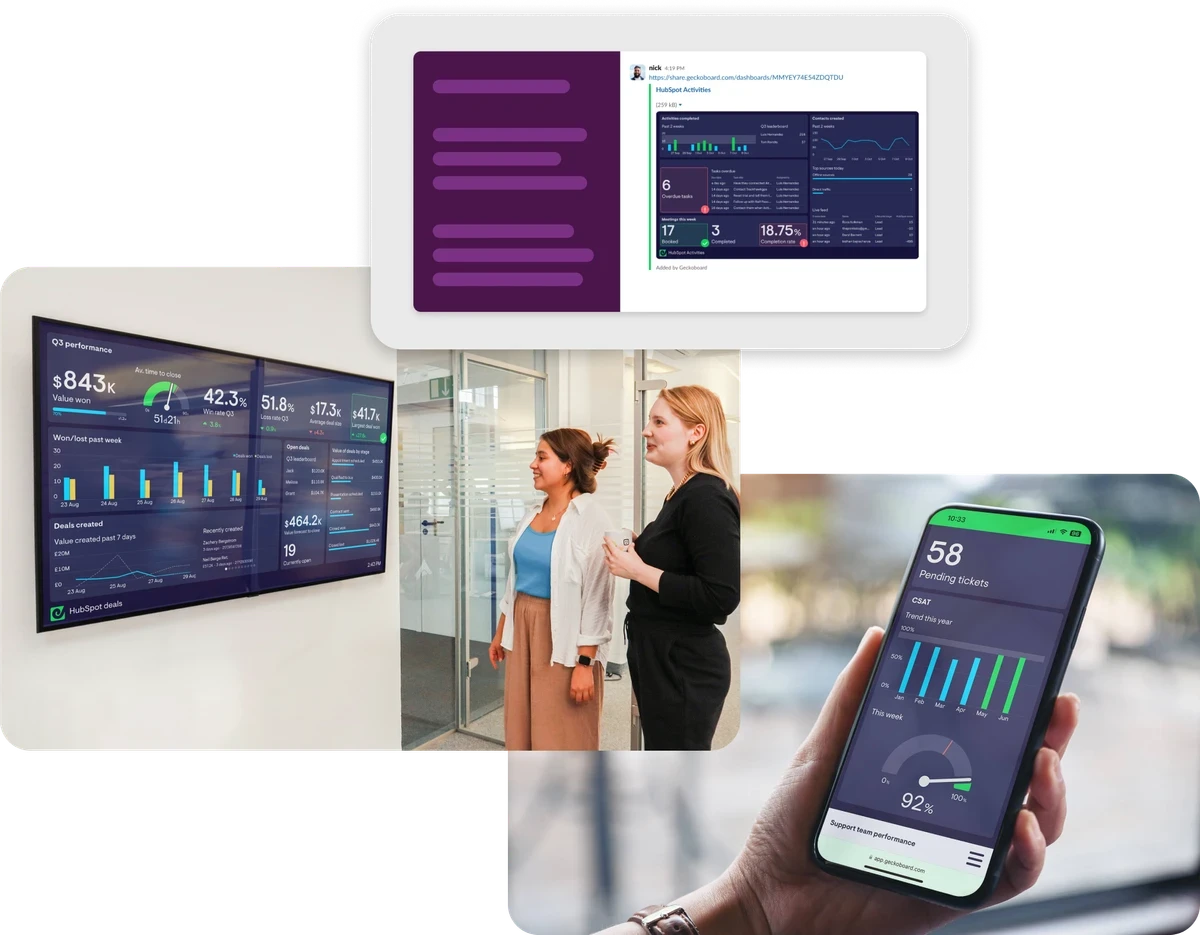
Geckoboard is built to get your data in front of people. Put dashboards on TVs, send snapshots to Slack and Microsoft Teams, embed them in your wiki, or create shareable dashboards with a link. Leaders and other teams can access the numbers without needing a Zendesk account.
Get alerted when something needs attention
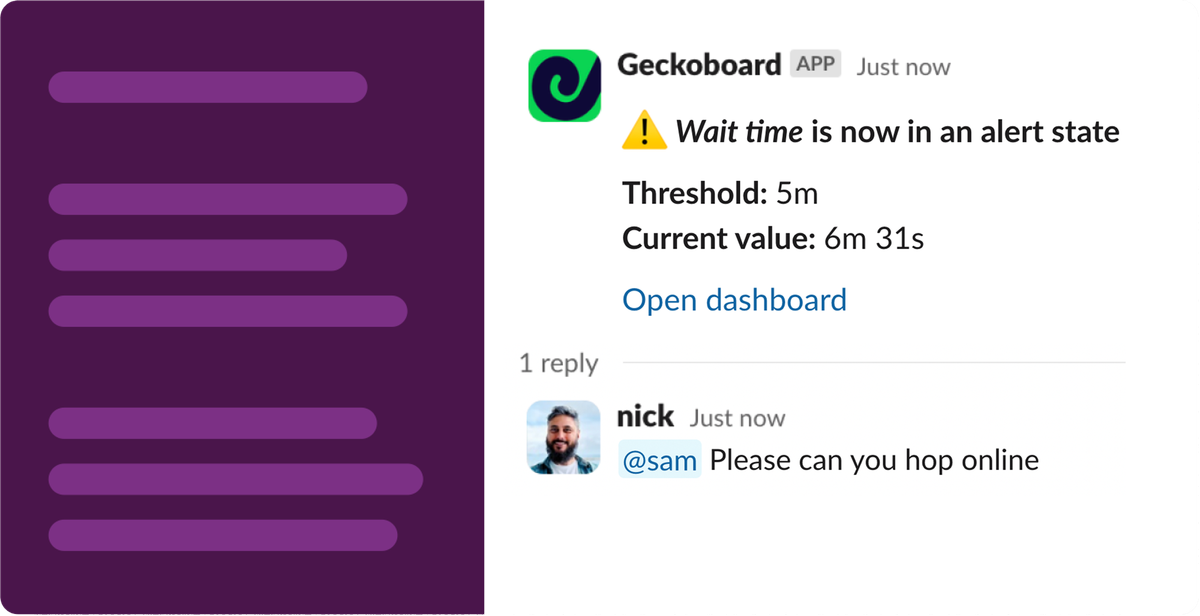
Set alerts on your key Zendesk metrics and notify the right people when something changes or crosses a threshold.
From there, they can drill into the data and click straight through to the relevant tickets in Zendesk.
Use your Zendesk metrics with AI
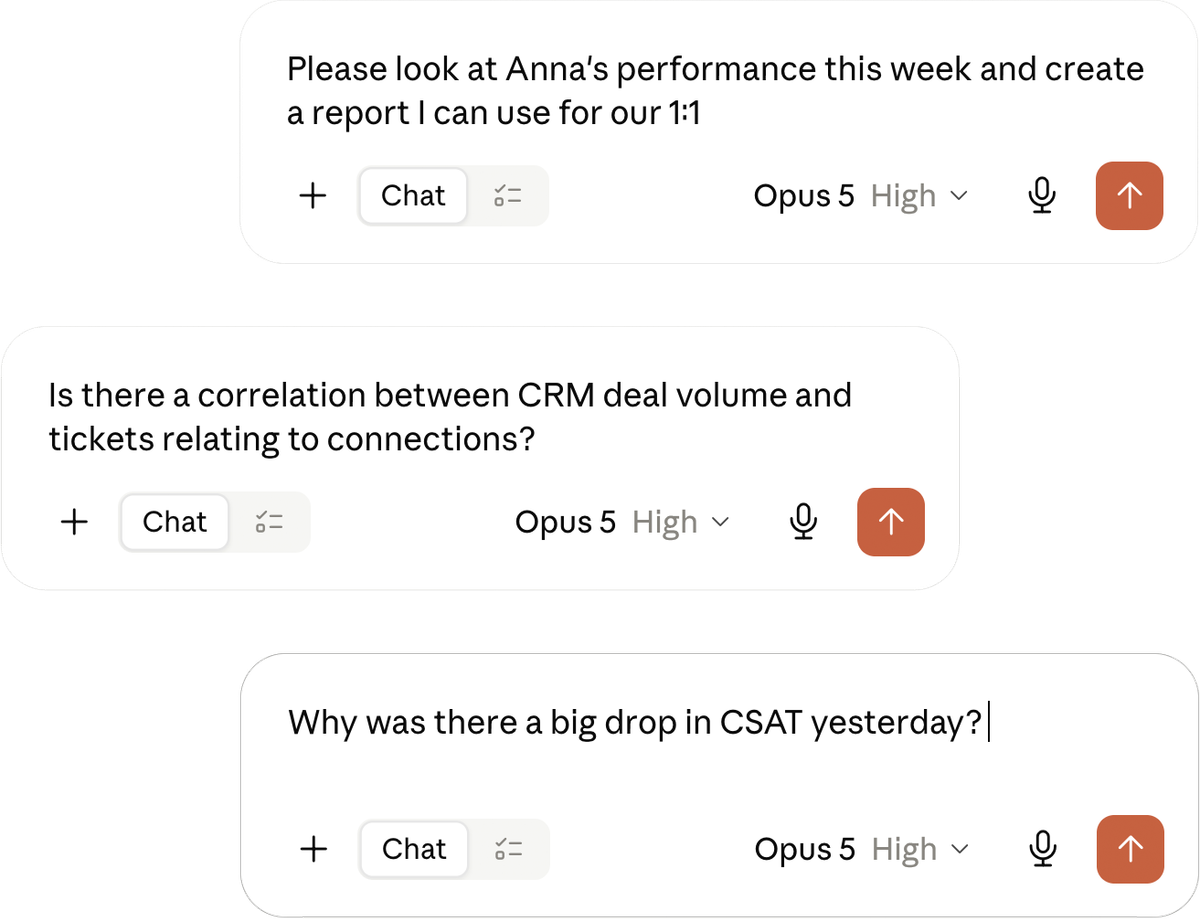
Geckoboard unlocks your Zendesk data for Claude, ChatGPT and other AI tools. Instead of asking AI to interpret raw tickets and work out your metrics itself, it gets direct access to trusted, pre-calculated metrics from the same engine that powers your dashboards.
See what you can build with your Zendesk data
Browse dashboards used by different support teams, get ideas for your own, and go beyond what you can create in Zendesk.
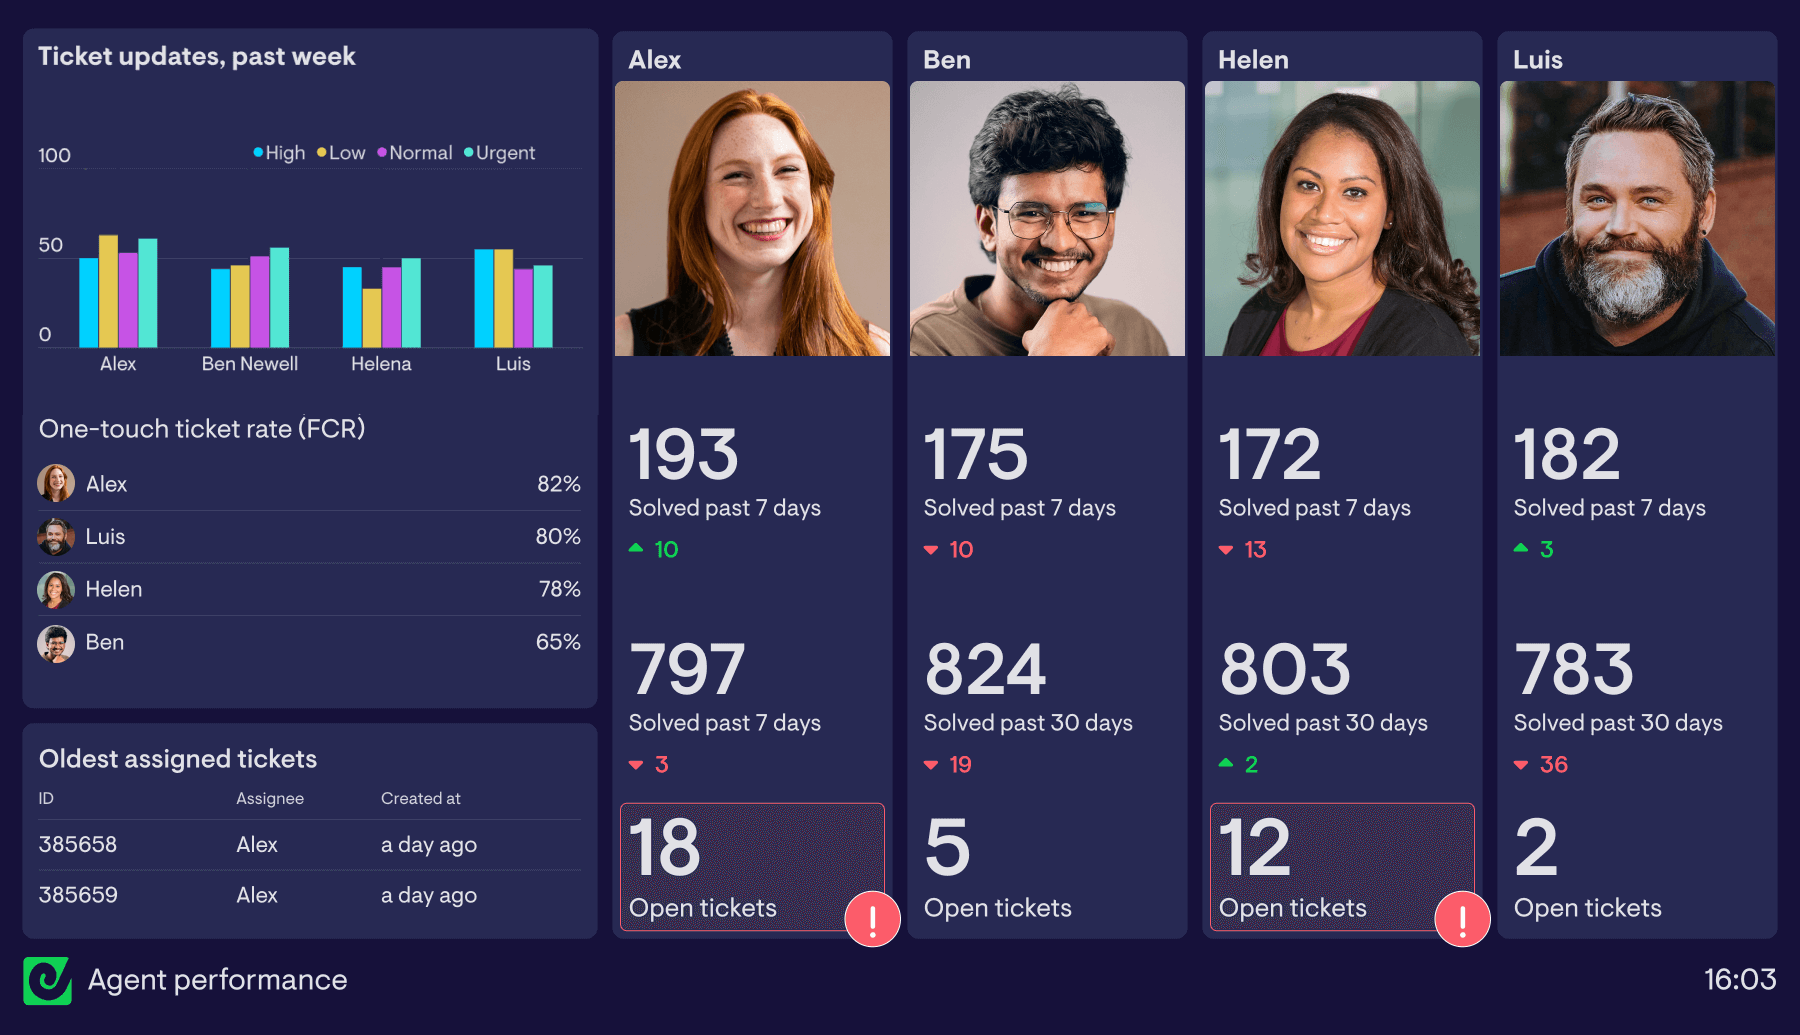
Support dashboard
A Zendesk dashboard surfaces real-time KPIs and ticket information from Zendesk, allowing managers and agents to monitor the queue throughout the day, be more responsive, and deliver stellar support
See more support dashboards
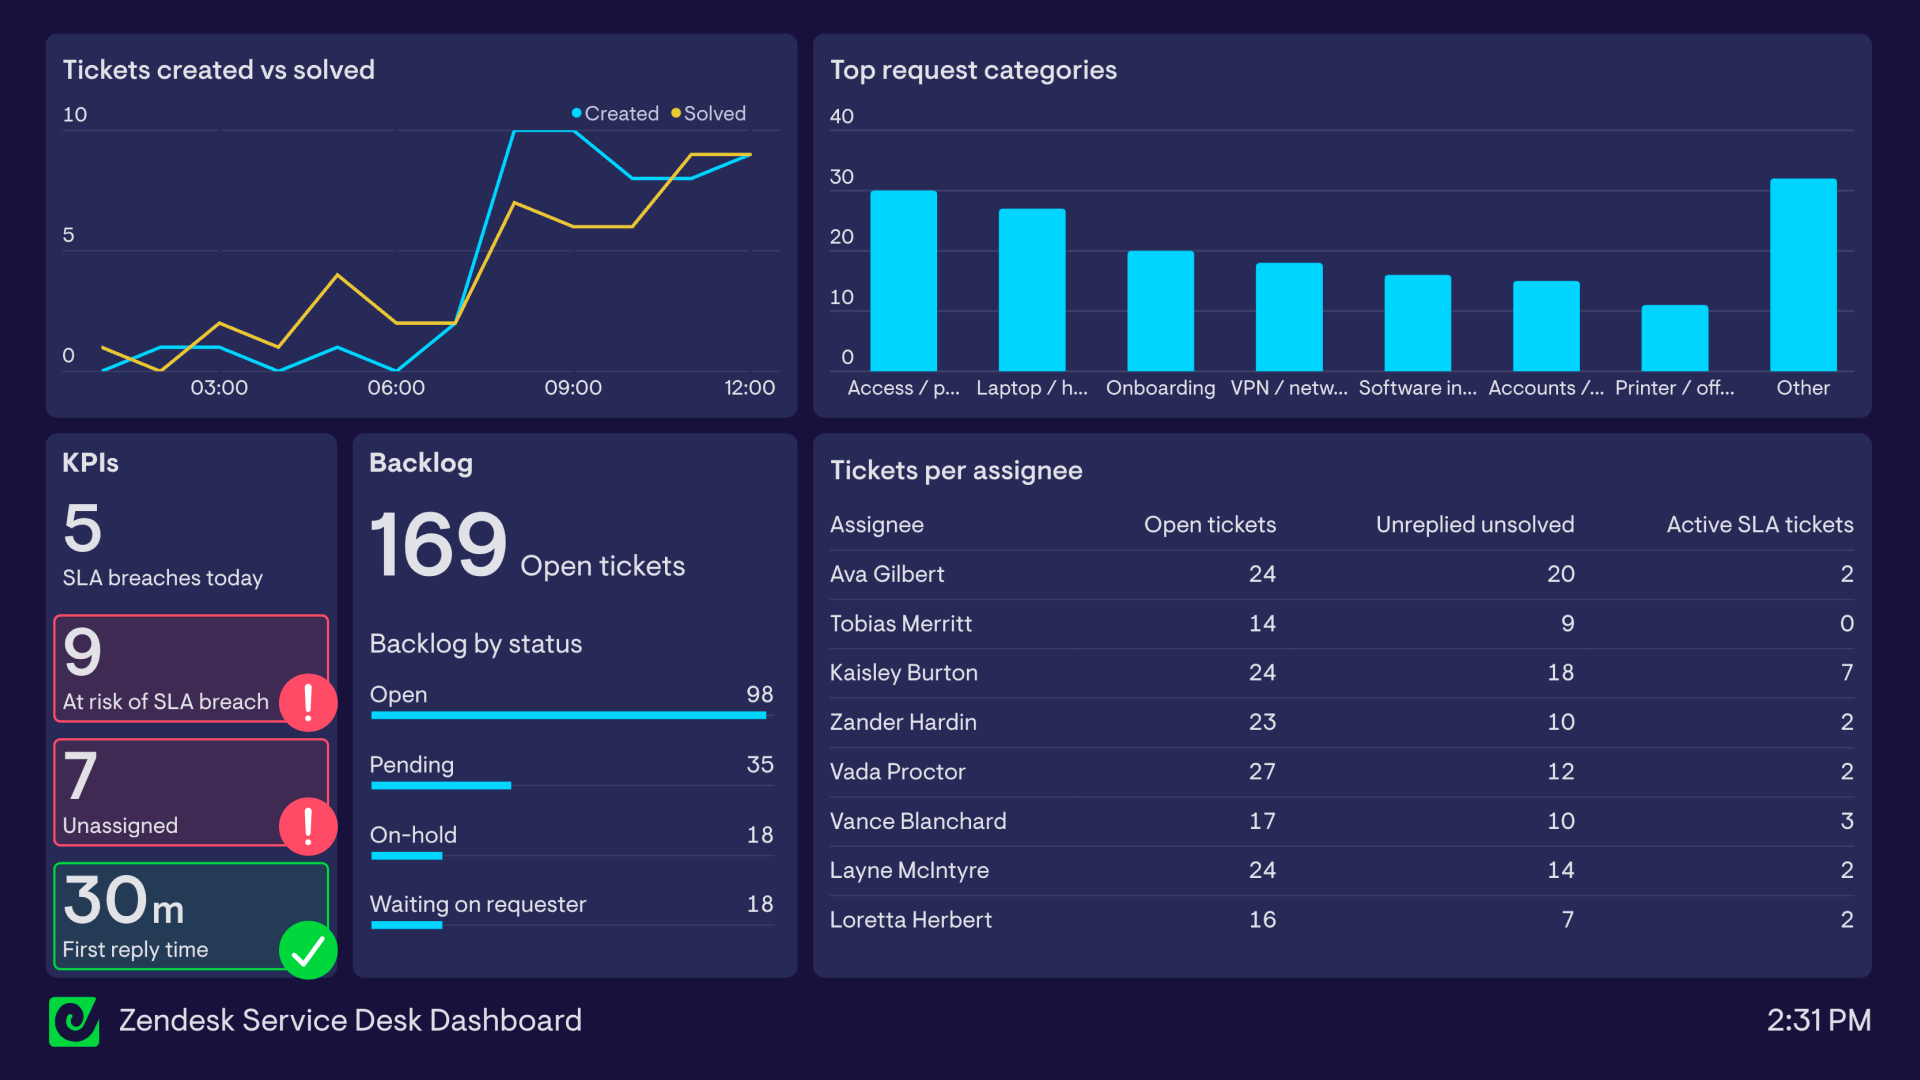
Service desk dashboard
A live Zendesk service desk dashboard for internal IT teams, focused on ticket flow, backlog health, SLA risk, and workload at a glance.
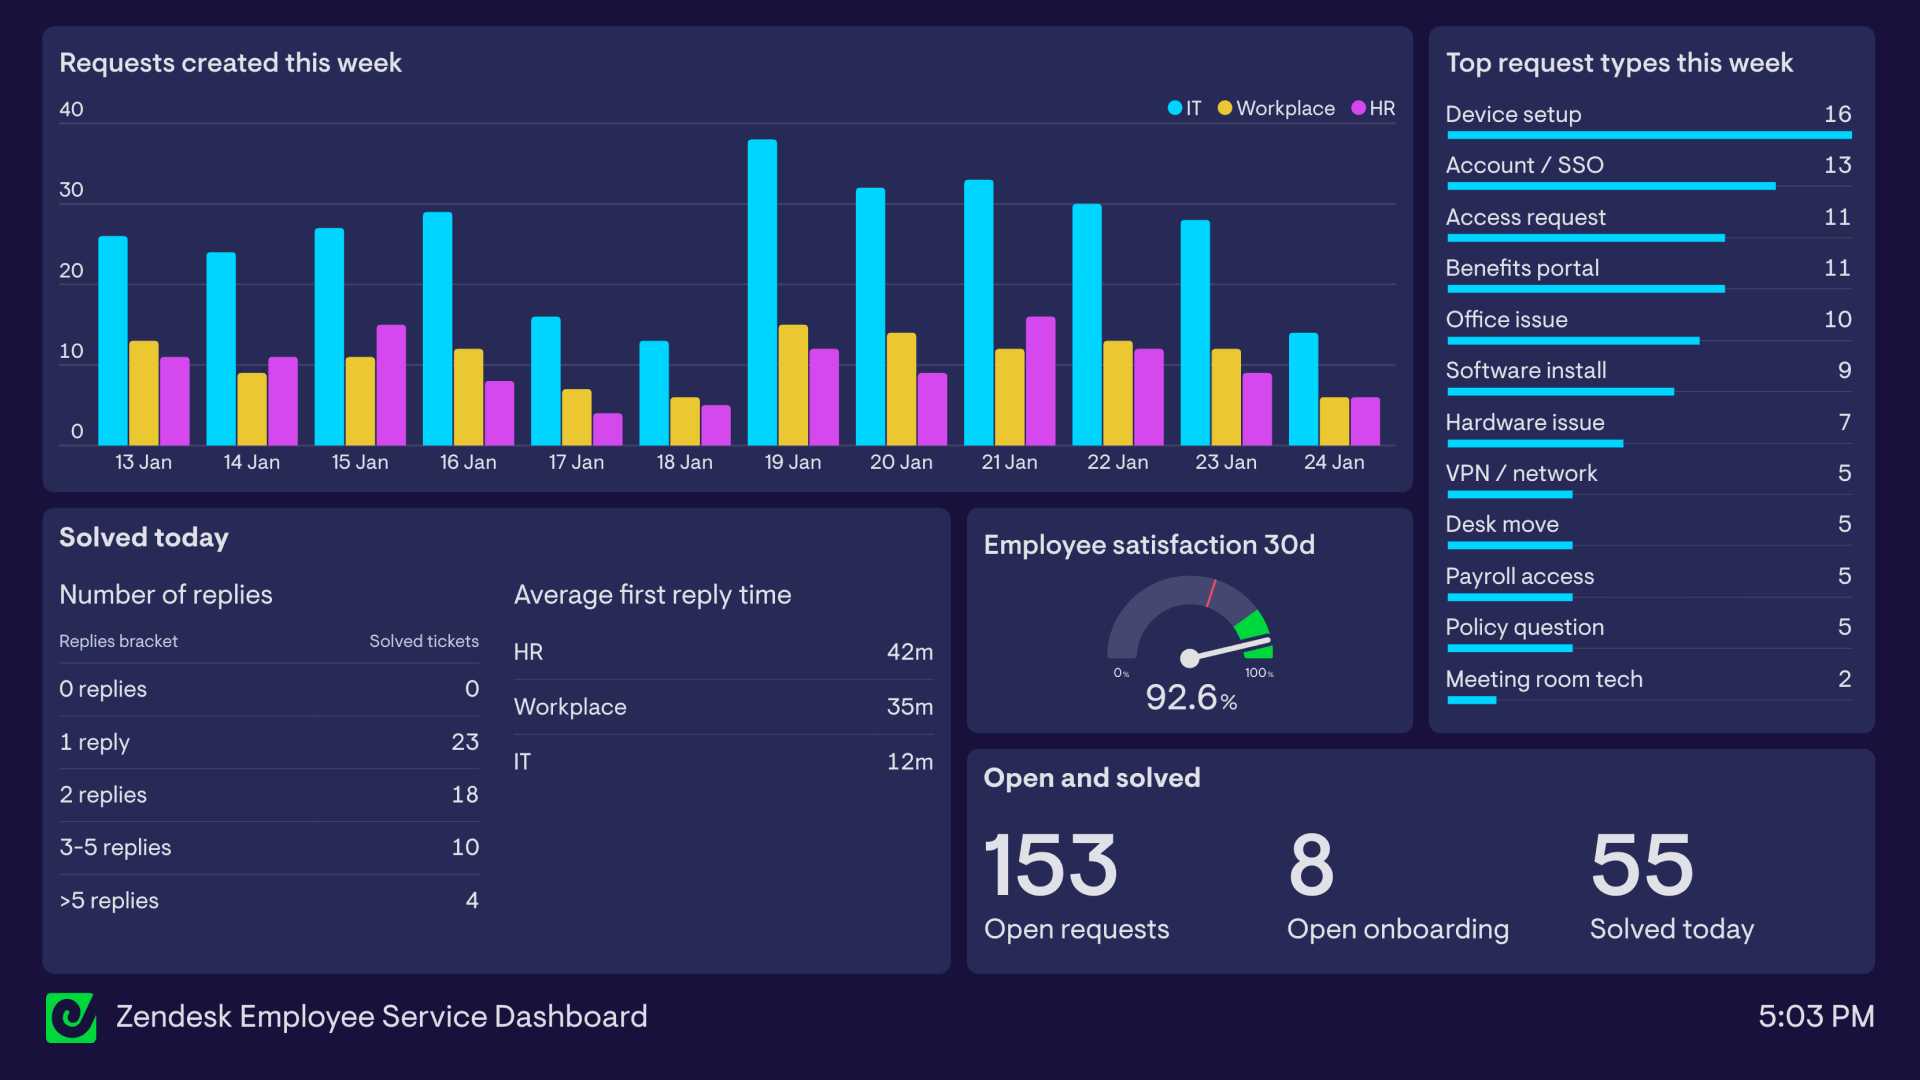
See more service desk dashboardsEmployee service dashboard
An employee service dashboard that brings IT, workplace, and HR Zendesk queues into one shared view of volume, responsiveness, and experience.
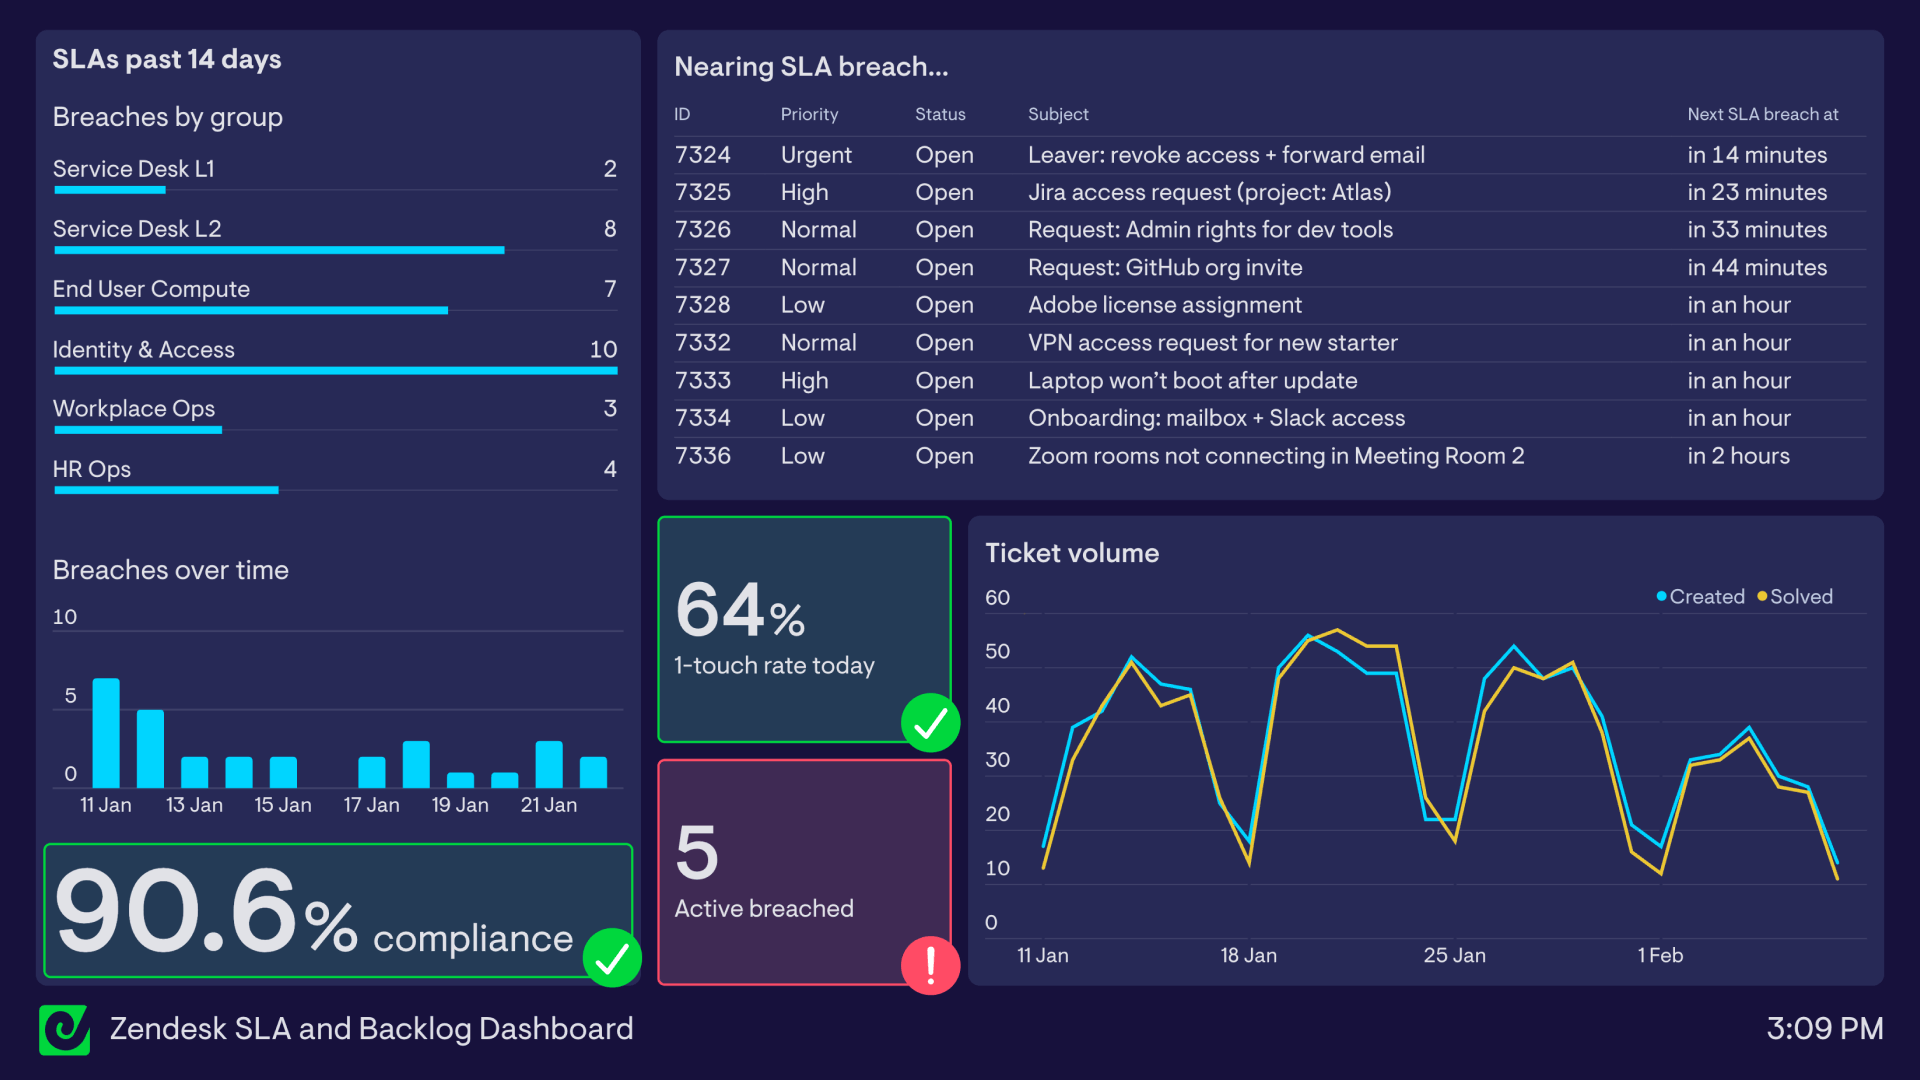
See more employee service dashboardsSLA and backlog dashboard
A Zendesk SLA and backlog dashboard for ITSM teams that makes drift, breaches, and volume trends visible on one screen.
See more sla and backlog dashboardsCSAT dashboard
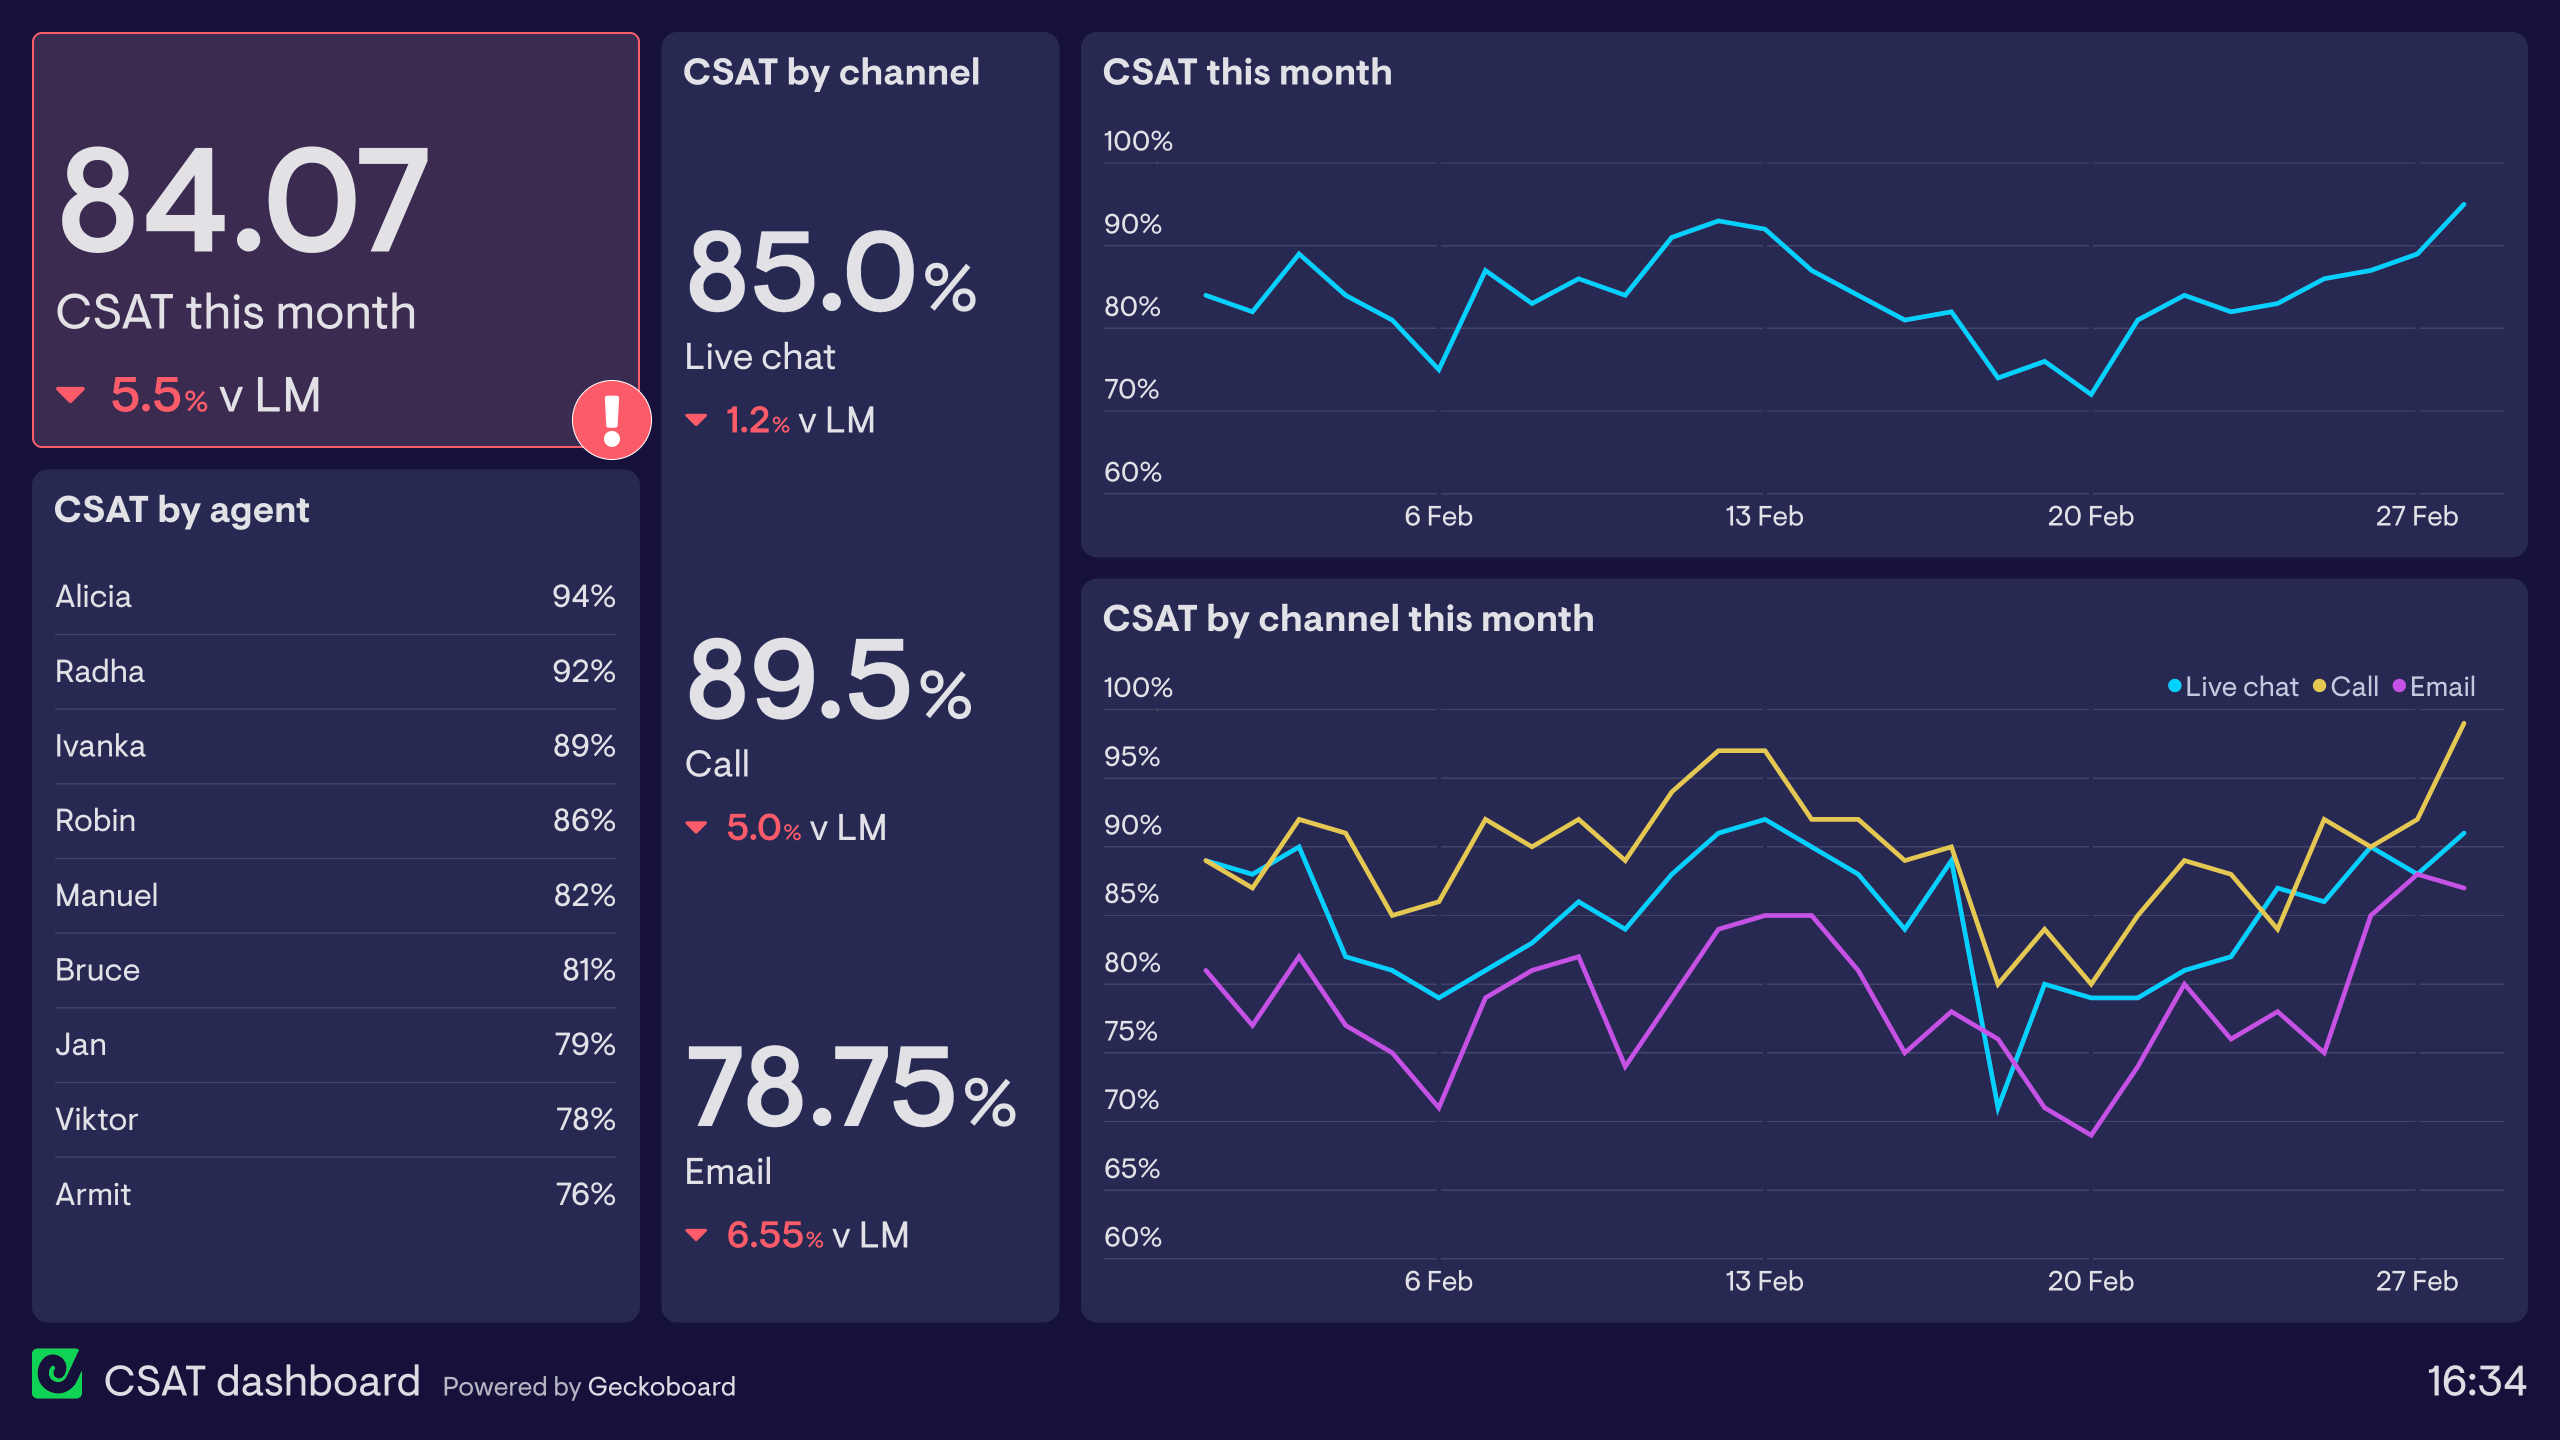
A CSAT dashboard breaks down one of the most important Customer Support KPIs, Customer Satisfaction (CSAT), helping teams better understand how and why it’s changing.
See more csat dashboardsHelpdesk dashboard
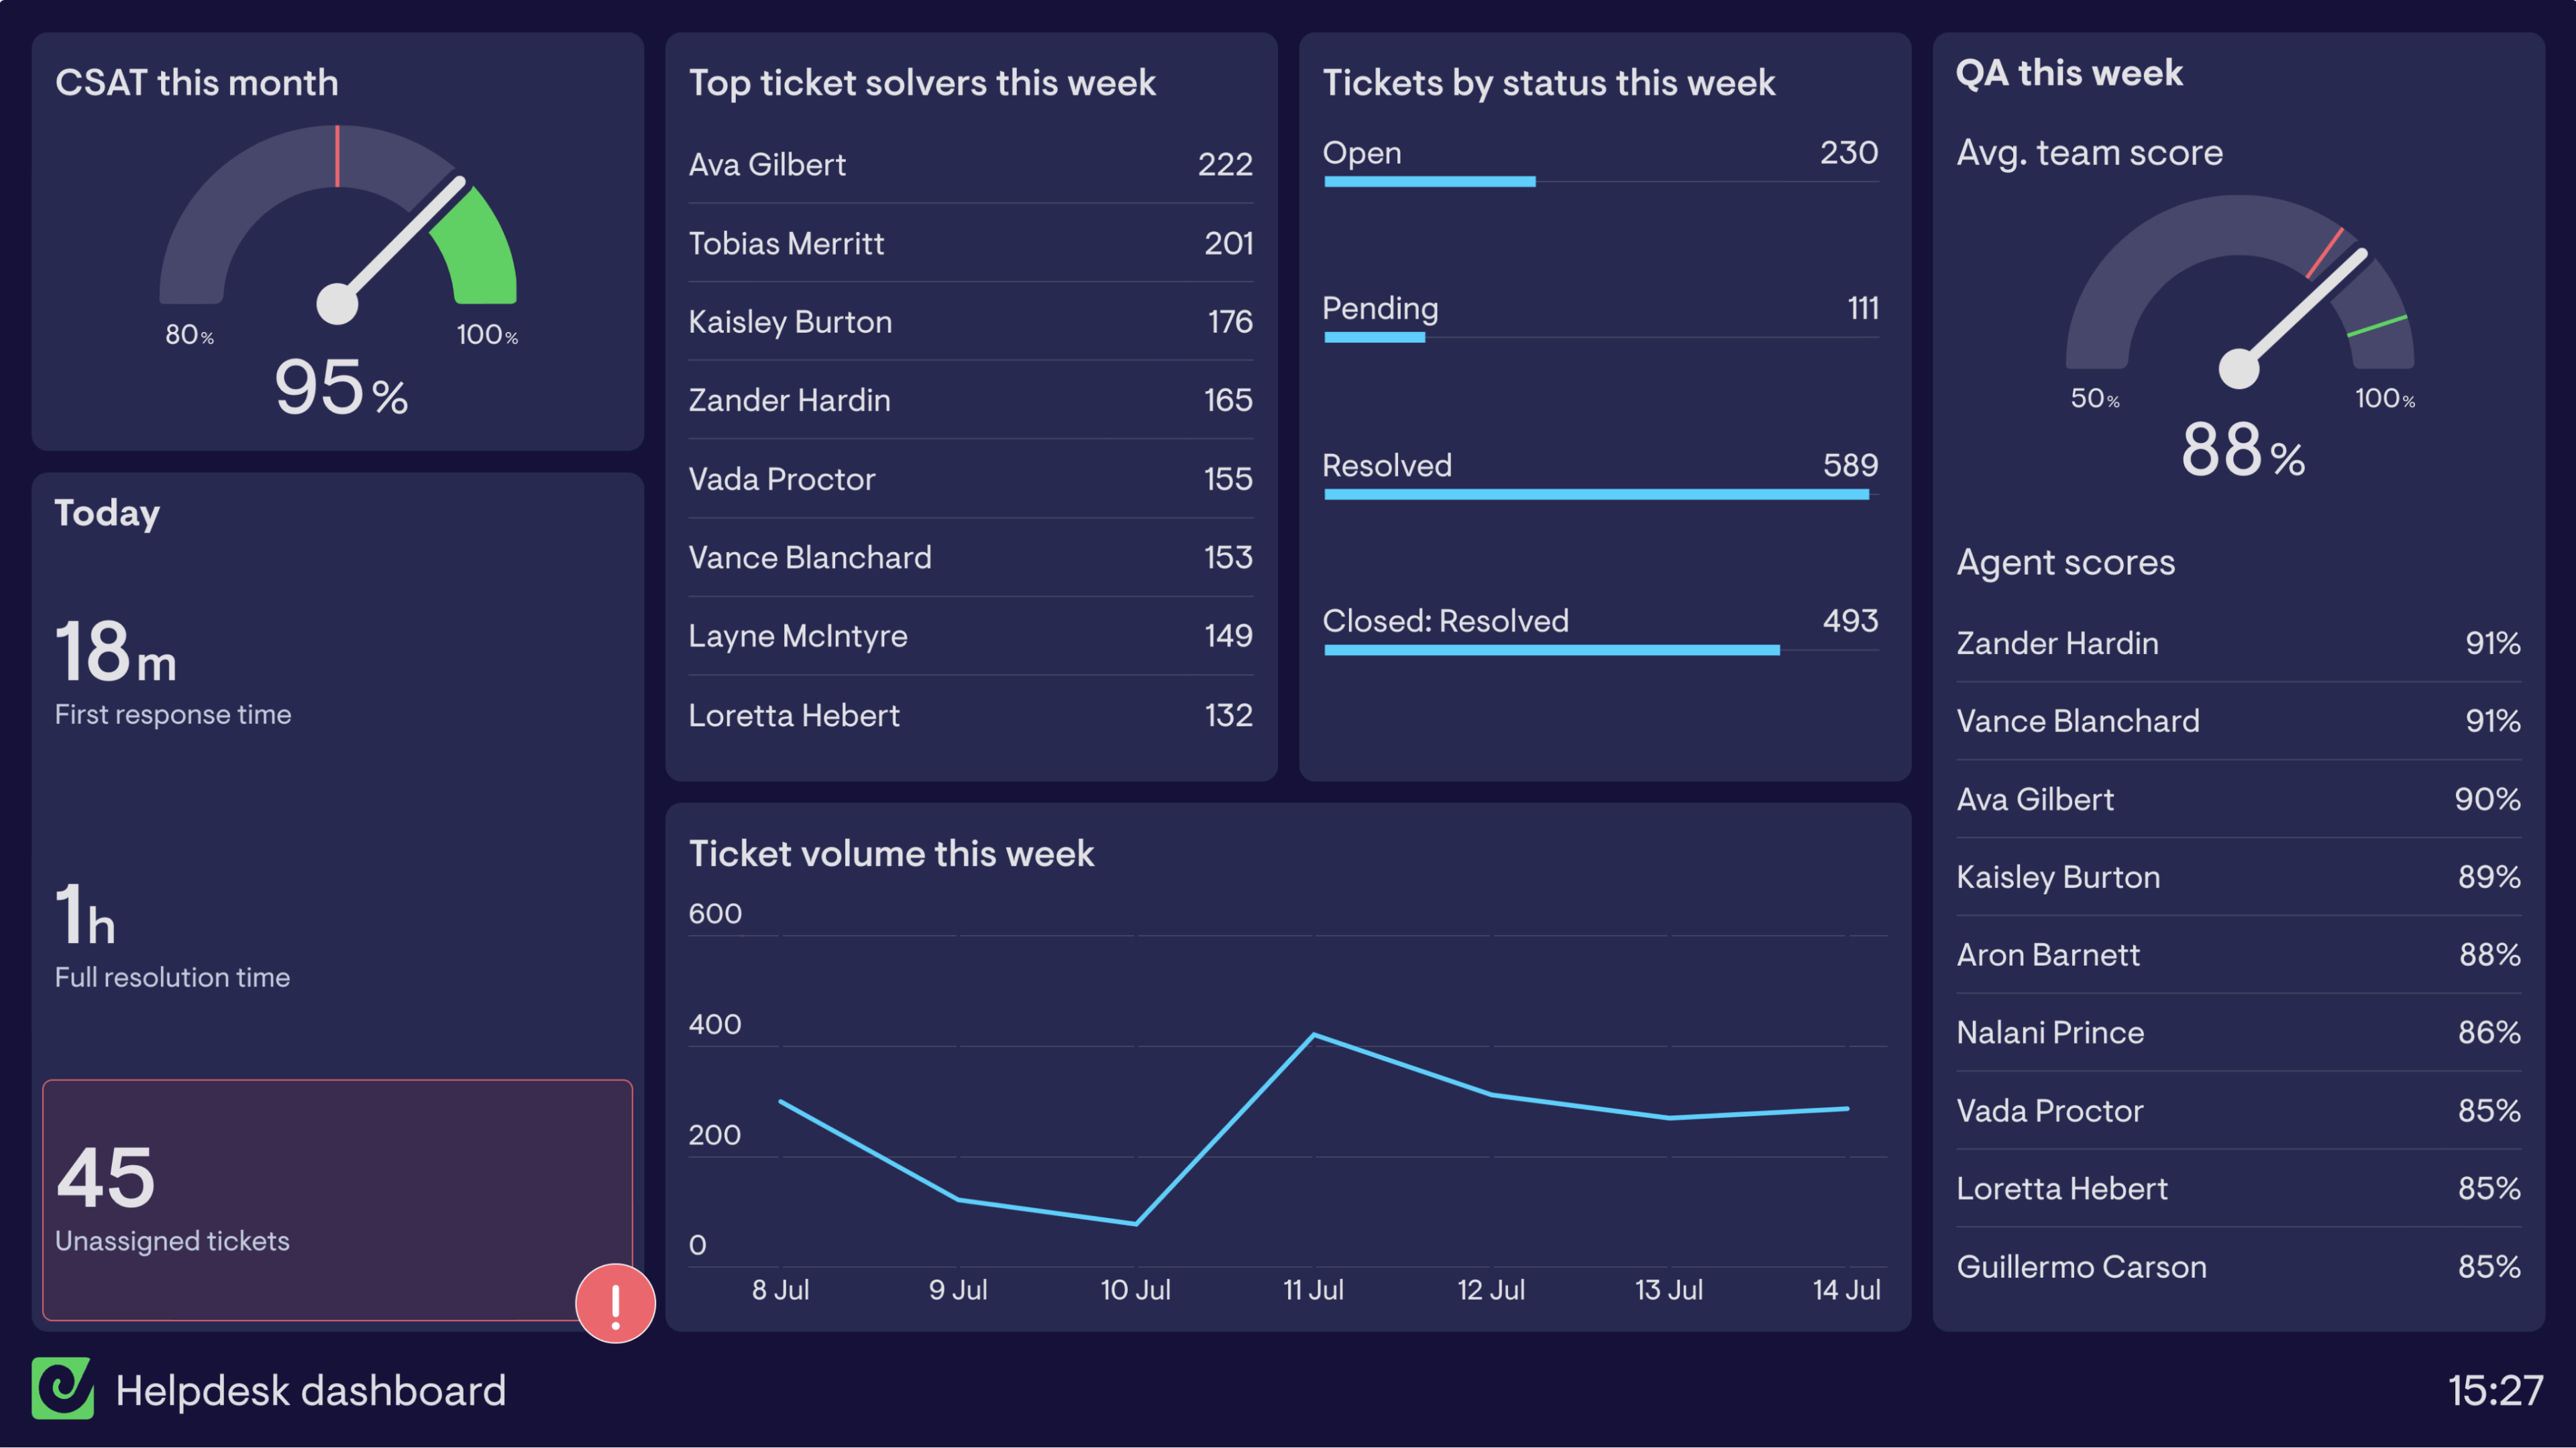
Enables helpdesk teams to monitor key metrics and make sure they’re hitting KPI targets.
See more helpdesk dashboardsCustomer service dashboard
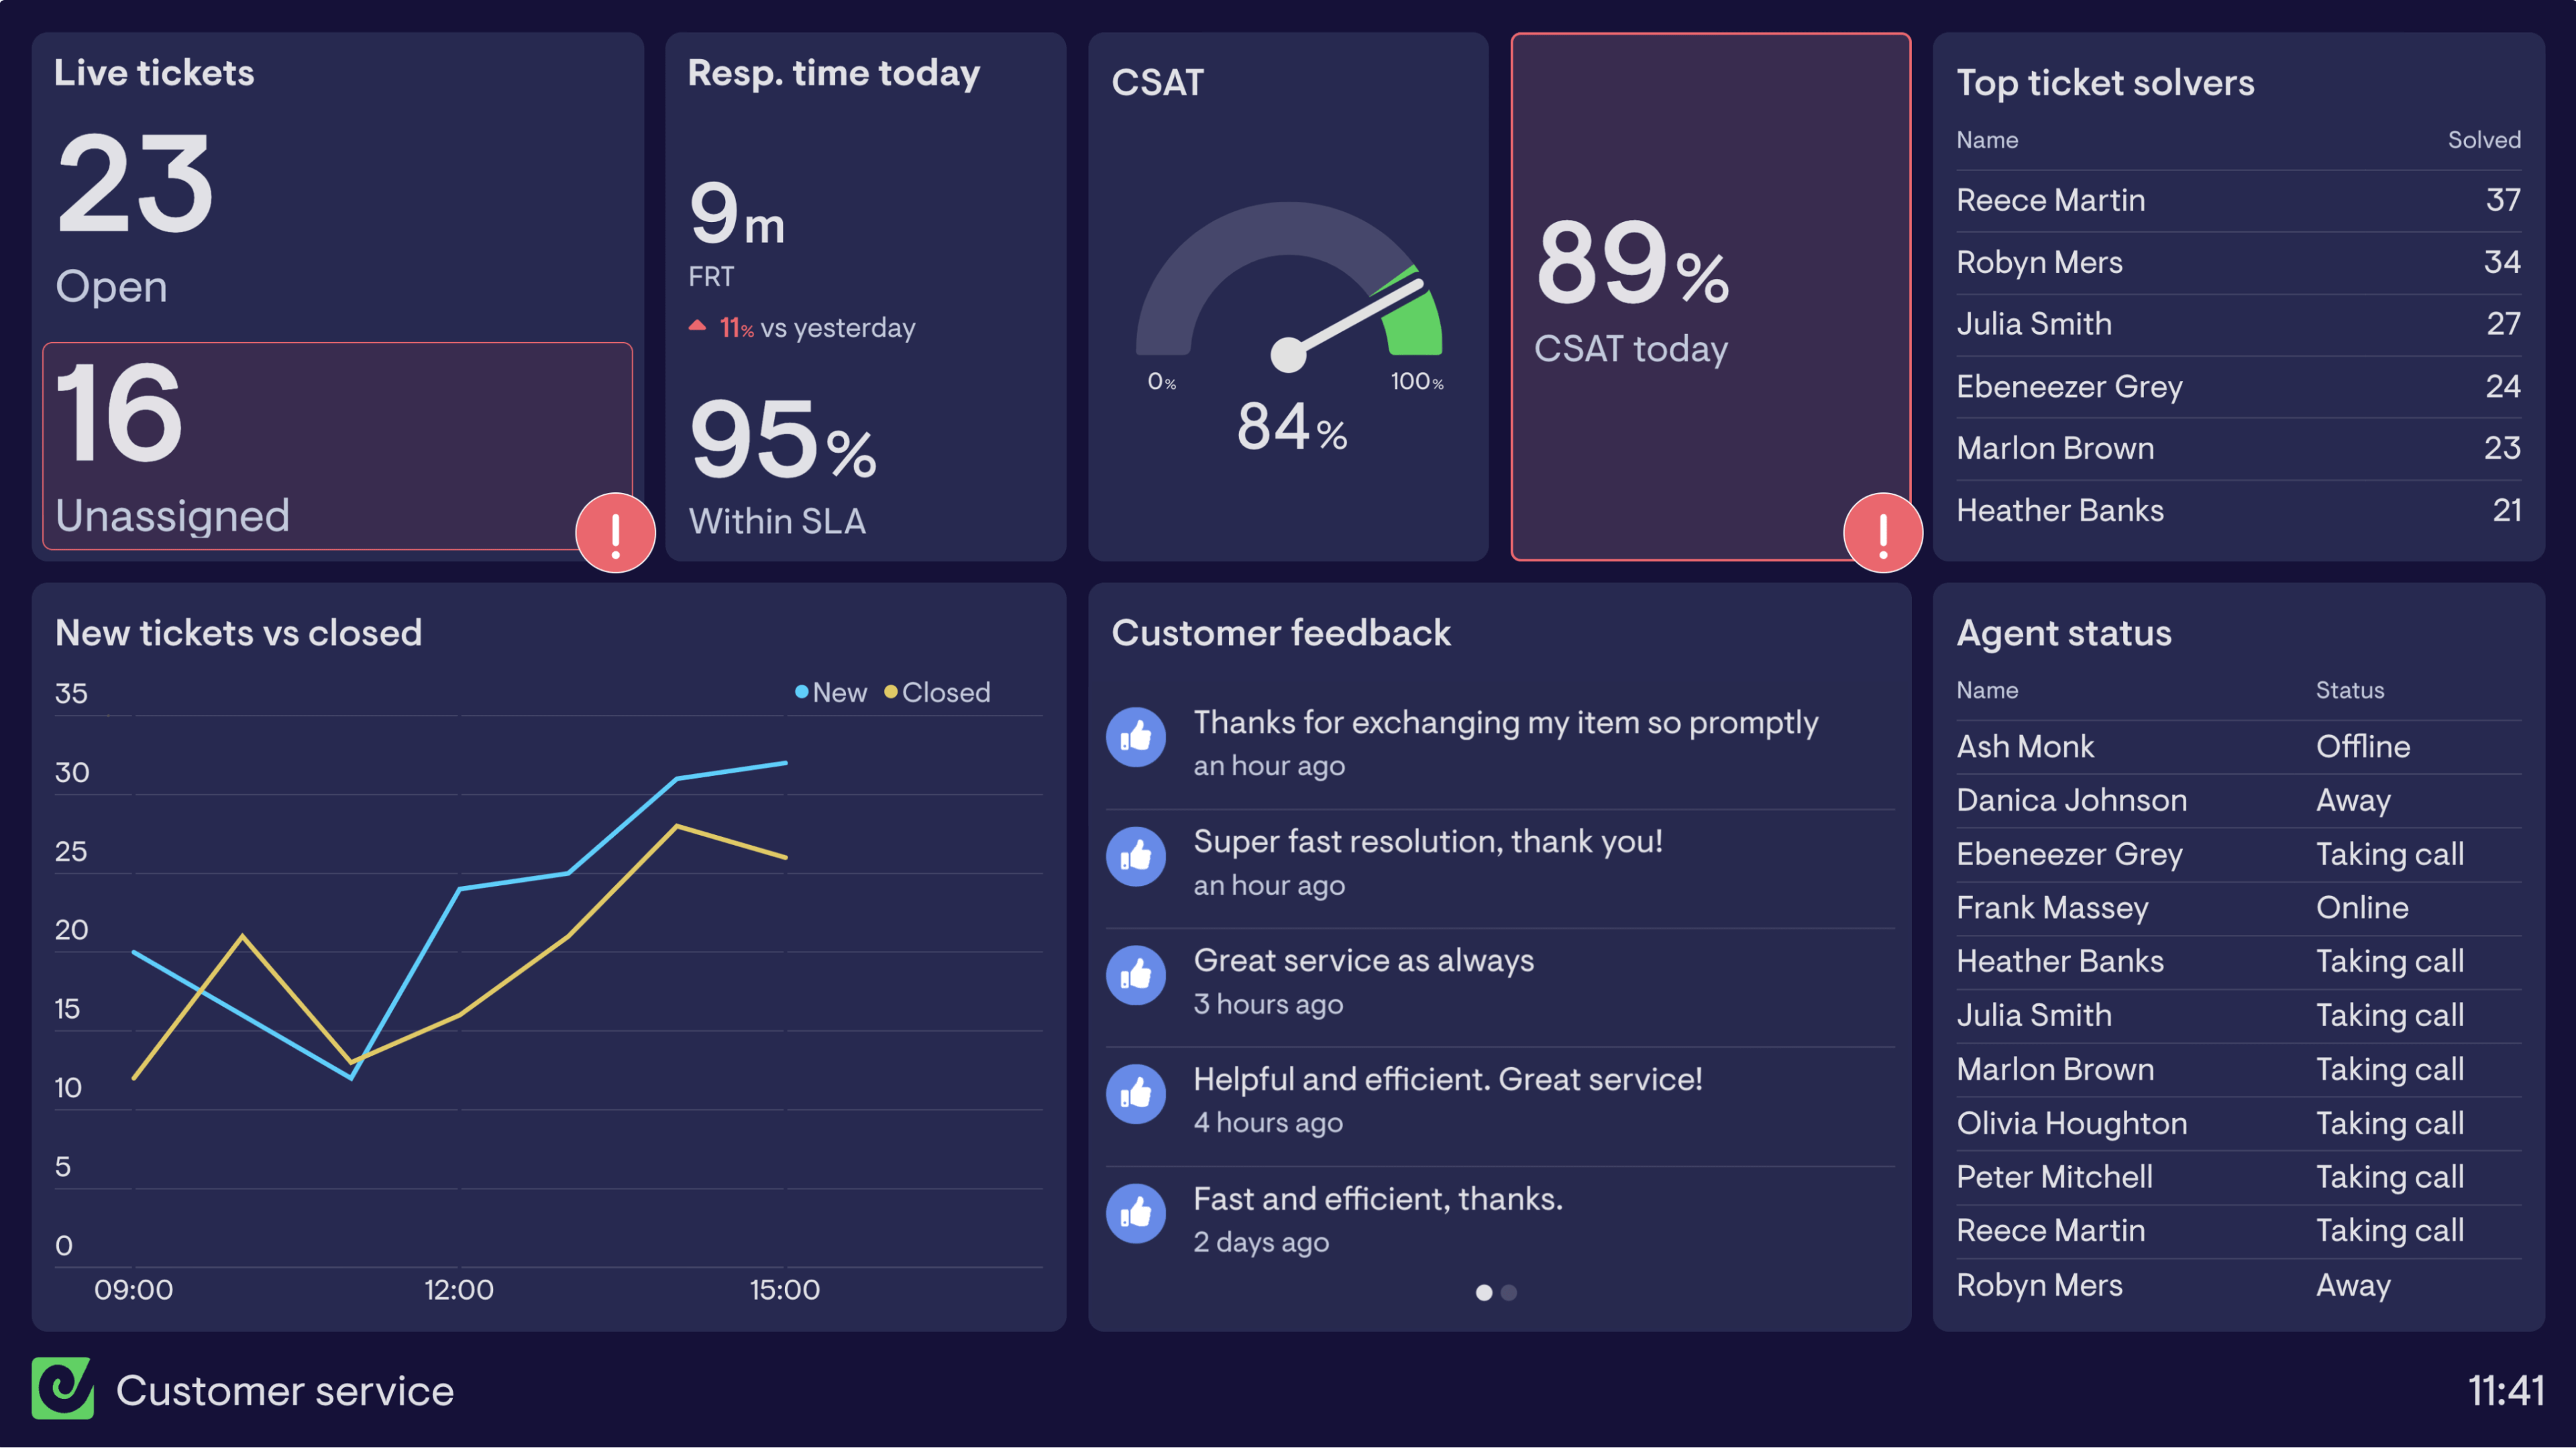
A customer service dashboard visualizes a support team’s performance in real-time, so they can react to important changes and make progress toward their goals.
See more customer service dashboardsSupport agent dashboard
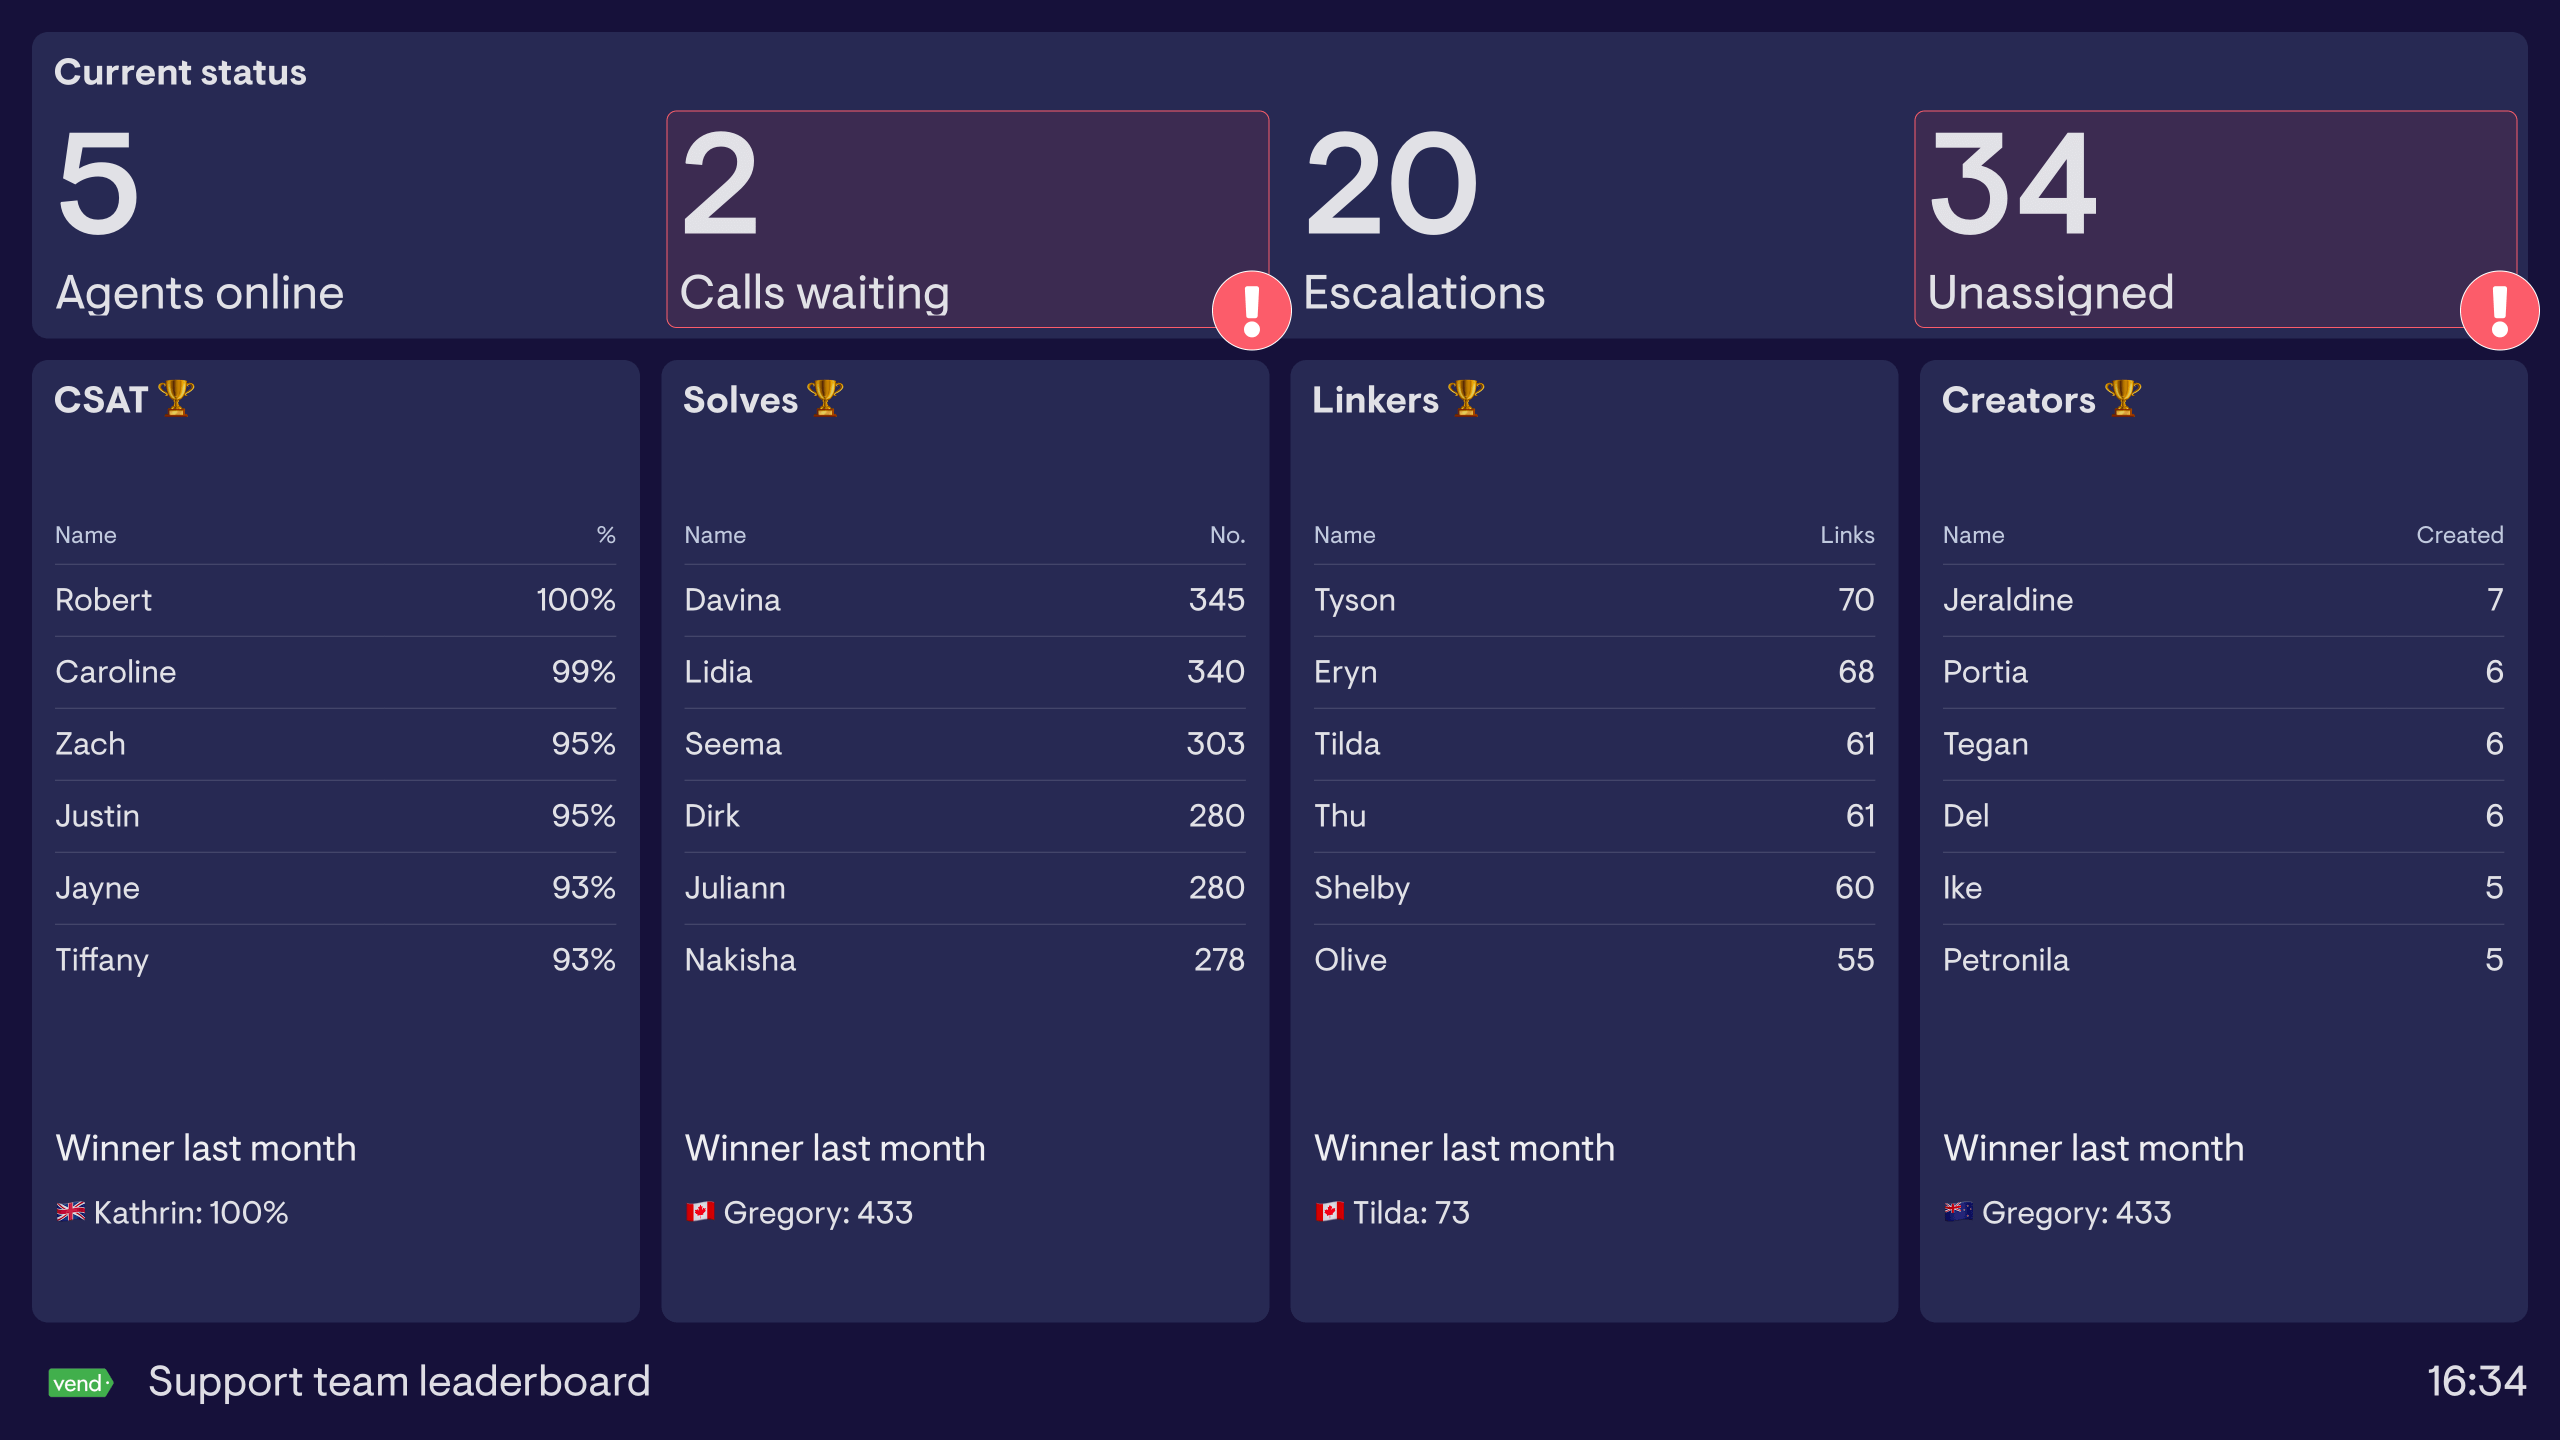
A support agent dashboard visualizes the performance of individual CS agents in order to foster a spirit of friendly competition.
See more support agent dashboardsSupport teams deserve great service too
Get expert help from a team that knows Zendesk, dashboards and support metrics inside out.
The Geckoboard support team has been outstanding, even implementing a missing metric for us in record time. Exceptional service.
Every conversation I’ve had has been top-notch. Best dashboard tool for Zendesk by far!
The Geckoboard team is incredibly supportive, helpful, and professional. They always provide real support to the end user.
Geckoboard team are also fantastic. On hand and quick to reply if any issues. Can’t recommend more!
Someone asking why you can’t just use Zendesk Explore?
If you’ve used Explore, you already know the answer. But if you need to convince someone else, we’ve got you covered.


Built for managers to analyze and create reports


Purpose-built for teams to monitor real-time data
Takes time to master
Easy and intuitive
Visualizes Zendesk data only
See data from 90+ sources alongside Zendesk metrics
Access on desktop
View on desktop, TV, mobile, Microsoft Teams, Slack, and more
Refreshes daily/hourly
Refreshes instantly/every few minutes
Customizable live dashboards require an Enterprise plan
Works with any Zendesk plan
Geckoboard integrates with Zendesk Support, Zendesk Chat, Zendesk Talk, Zendesk QA and Zendesk Sell through separate integrations.
If you’re using omnichannel routing, you can use Geckoboard’s standalone Zendesk Agent Status integration to monitor agent availability and workload across channels in real-time.
A range of Zendesk Messaging metrics can be accessed through both our Support and Agent Status integrations.
Popular metrics from our Zendesk integrations include:- Support: first reply time, full resolution time, ticket volume, unsolved tickets, unassigned tickets, open tickets, top ticket solvers, tickets by channel, group, agent or tag, CSAT, CSAT comment feed, percent of tickets with a rating, SLA achievement rate, SLA breached tickets, tickets nearing SLA breach, one-touch ticket rate, requester wait time, on-hold time, number of agent replies, number of agent updates, average replies per ticket, average replies per solved ticket, and more.
- Chat: chat volume, missed chats, chats by tag, chats in queue, acceptance rate, average wait time, chats currently being served, chat duration, response time, agents currently online, away or invisible.
- Talk: agent availability, agents on wrap up, call volume, average time to answer, longest wait time, wrap up time, abandonment rate, answer rate, average call duration, average wrap up time, missed calls, voicemails, callbacks waiting, and more.
- QA: average quality score for the whole team, individual quality scores, highest scores, review feed.
- Messaging (via Support integration): active in queue, active assigned, inactive in queue, average time in queue, longest time in queue, average handle time, longest handle time, and more.
- Sell: revenue, pipeline, number of deals, sales leaderboards, and more.
Most metrics can also be filtered by the following dimensions to give even more precision — assignee, brand, channel, group, priority, status, tag or custom field.
The best way to check if a specific metric is supported by our integration though is to try it for yourself. Alternatively, ask our friendly support team.
Geckoboard is ideal for creating an up-to-date view of metrics you, your team or stakeholders should be regularly monitoring, which can include data from several sources.
Examples might include dashboards for monitoring high level metrics from across your whole support operation, or more specific dashboards focused around metrics related to a specific number or even specific agents. For inspiration, check out our Zendesk dashboard examples.
Zendesk Support widgets update every 10 minutes, Zendesk Chat every 1 minute, Zendesk Talk every 30 seconds and Zendesk Sell every 25 minutes for Call metrics, and 30 minutes for Deal metrics. Zendesk Agent Status widgets update every 30 seconds. Messaging metrics update instantly. See this help article for refresh rates of all our other data sources.
Absolutely, and you can add metrics from different Zendesk accounts to the same dashboard too.
Geckoboard is designed to be easy for anyone to use without any training or complicated setup.
To help along the way, we’ve put together useful articles answering common questions, and for anything else, our friendly and knowledgeable team is on hand 24/5 to help you succeed with your dashboards, whatever time zone you’re in. Pro and Enterprise plans offer even snappier support, with priority support and dedicated support reps available.
You can try Geckoboard completely free for 14 days by signing up for a free trial — no payment details required. Our prices are available here.
Ready to get started?