Boost your team’s performance with...
Real-time dashboards for HubSpot Service Hub

Data drives performance, when it’s shared the right way
Geckoboard gives Customer Service teams instant access to live KPIs and data from across HubSpot, helping them perform at their best. No manual refreshing, no reports to dig thorough. Just real-time insights.
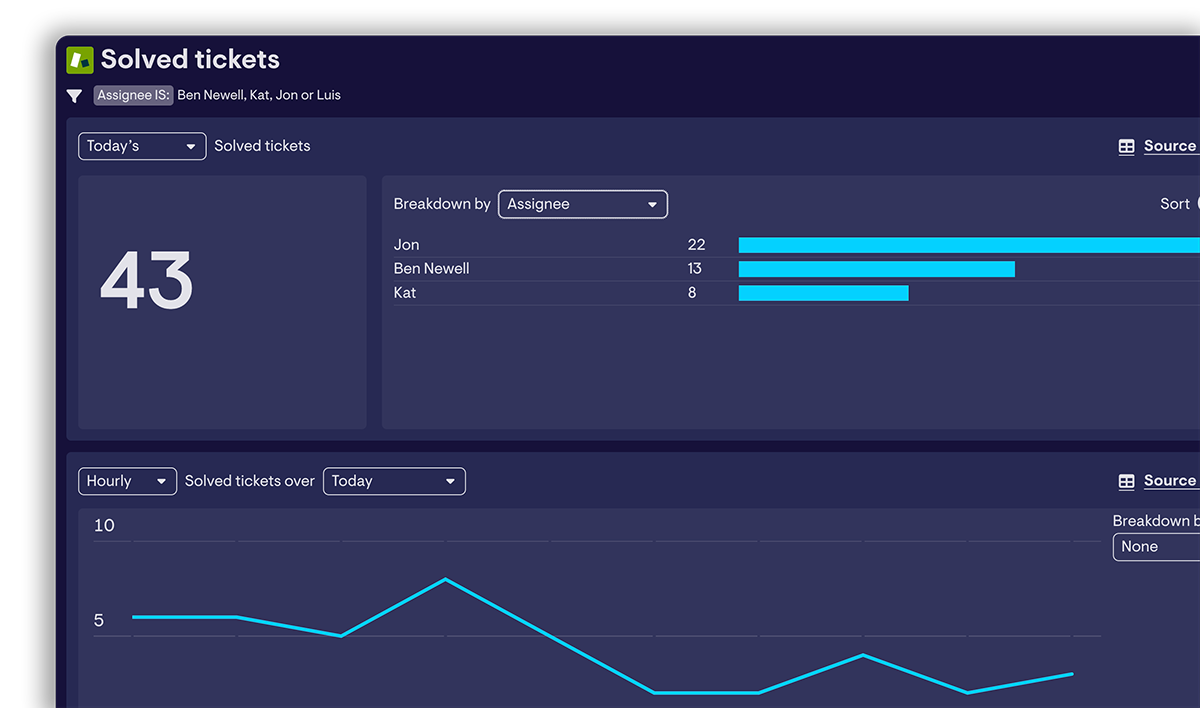
Bring key metrics into one focused view
Connect HubSpot to Geckoboard and instantly visualize real-time data from your HubSpot account. Access dozens of metrics from across your ticket pipelines, dial them in with powerful filters, and build up your own custom dashboard in minutes.
See data from 90+ sources alongside Service Hub data
Easily add data from CRMs, phone systems, databases and other tools and see all your important data in one place.


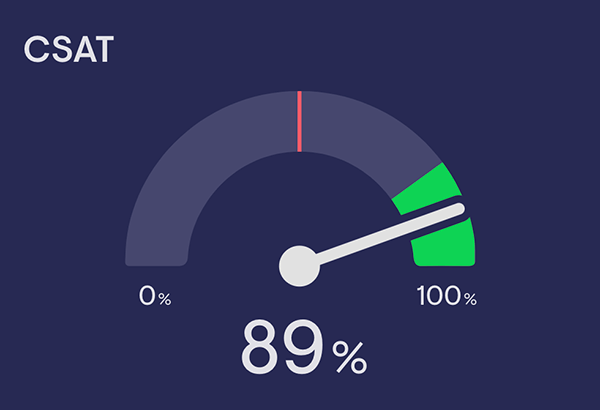
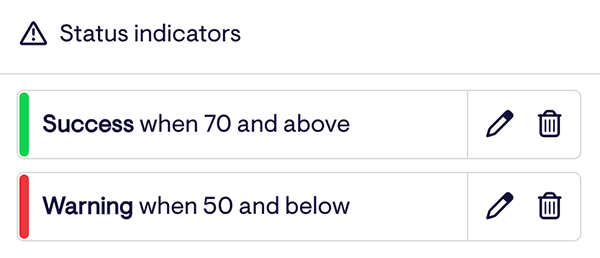
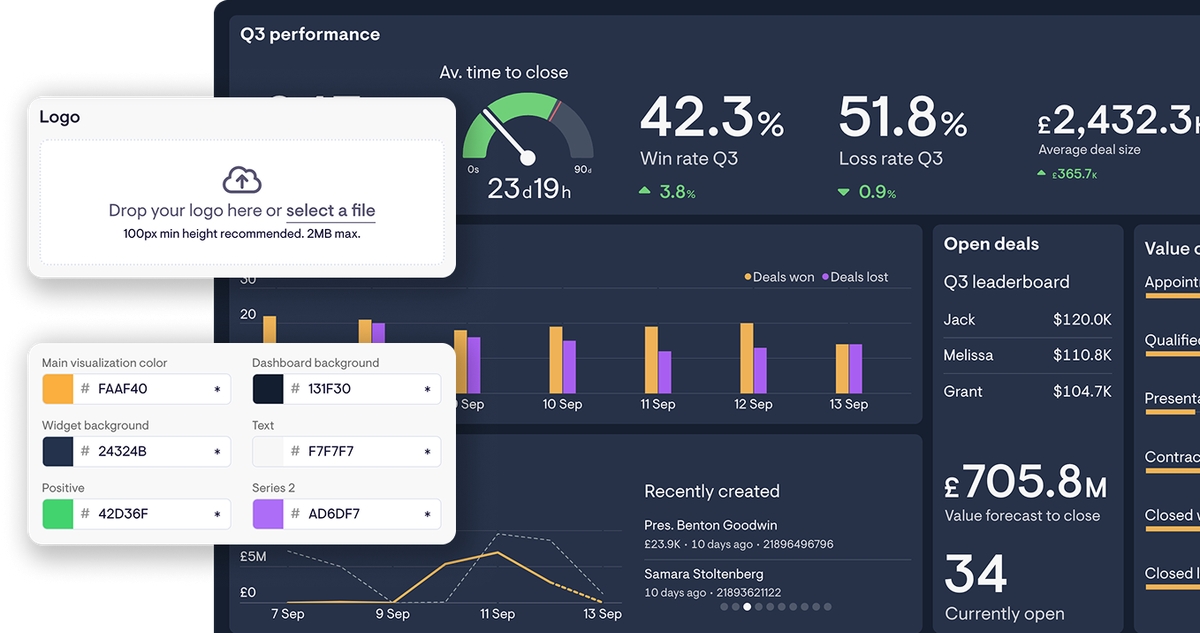
Focus attention on the metrics that matter
Create dashboards that focus on every aspect of your customer service operation — from company-wide targets to individual agent performance.
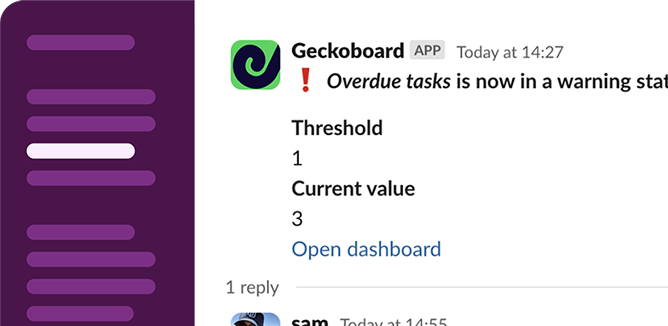
Turn data into action
Geckoboard’s dashboards are clear, engaging, and built for impact, making it easy for teams to understand key metrics — and respond in real time.
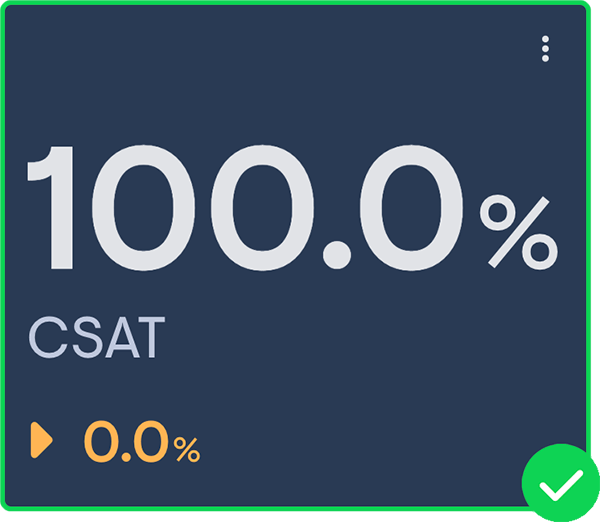


Putting numbers in front of the team has really increased awareness. They care – they don’t want to be in the red! It really pushes them forward to lift each other up and push themselves
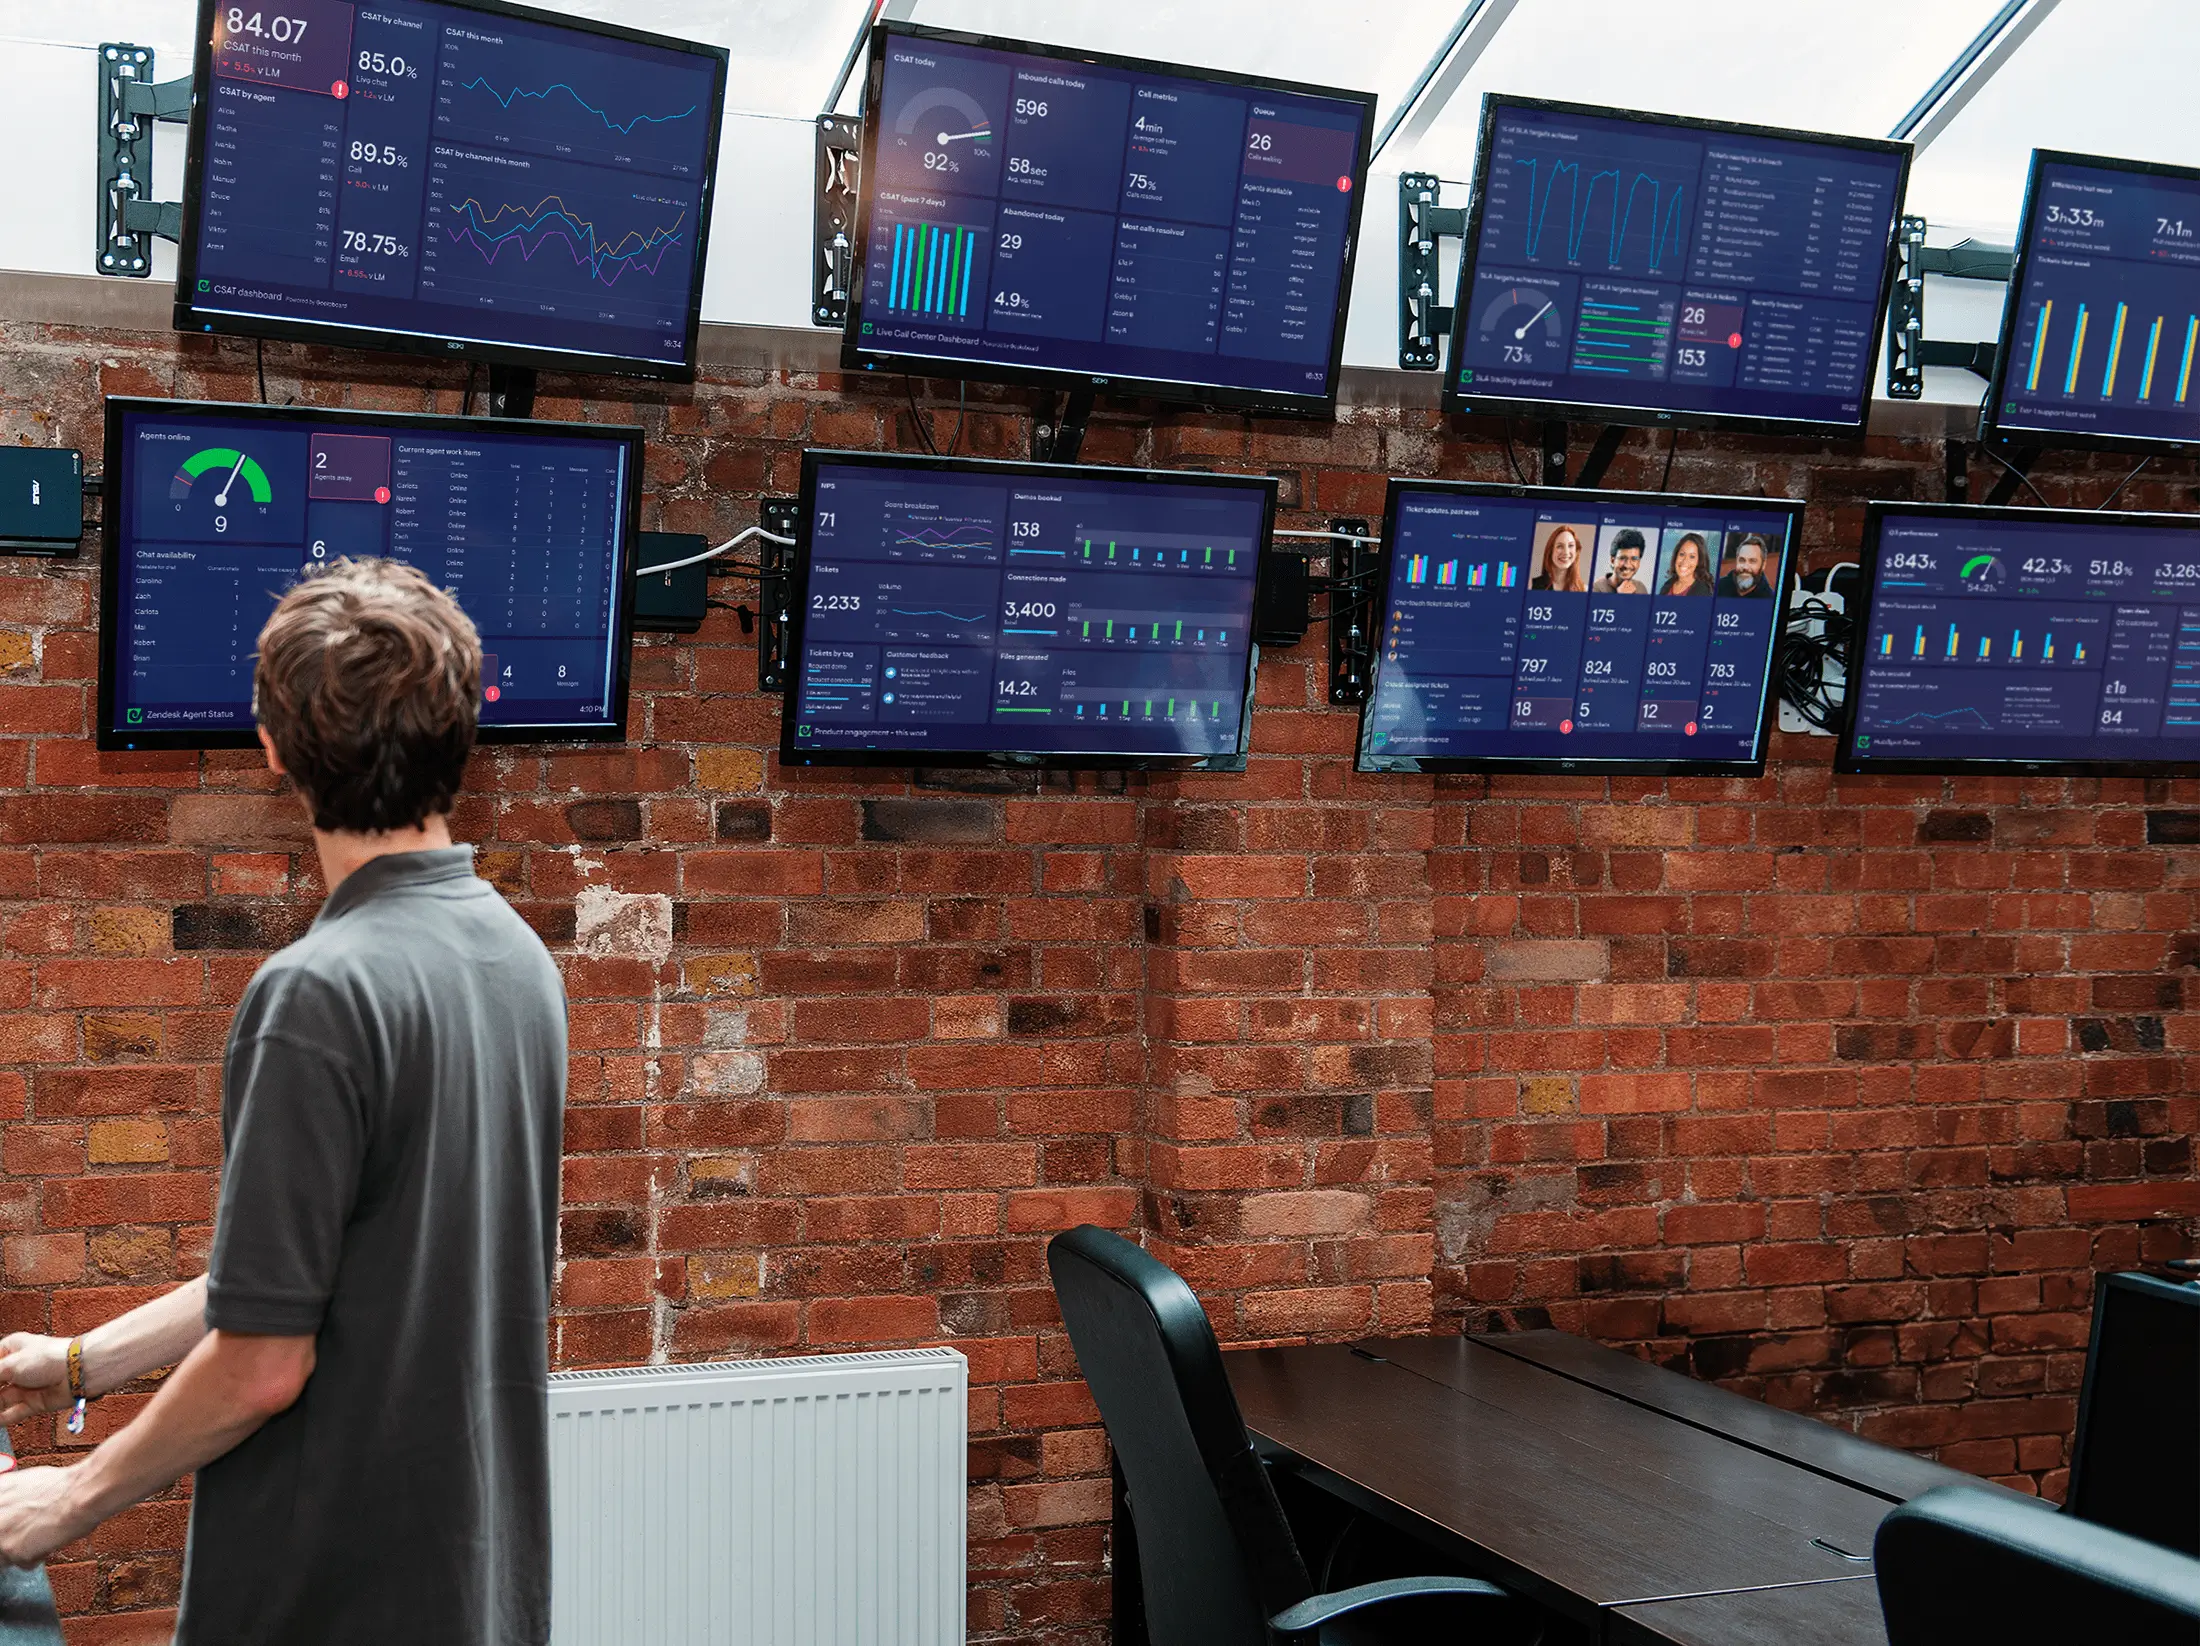
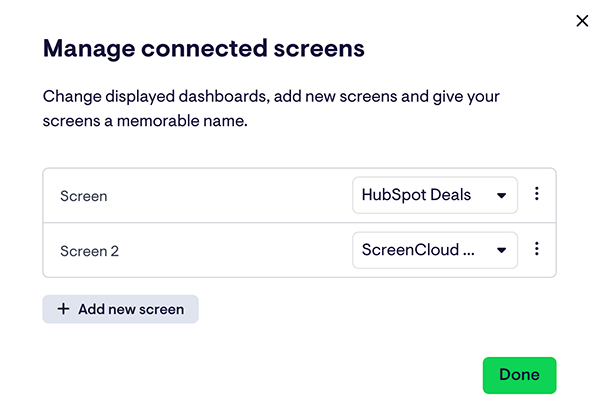
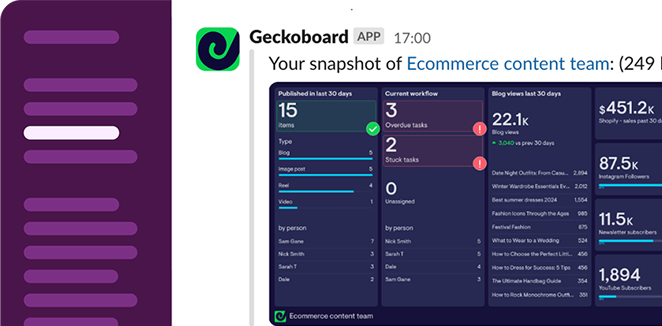
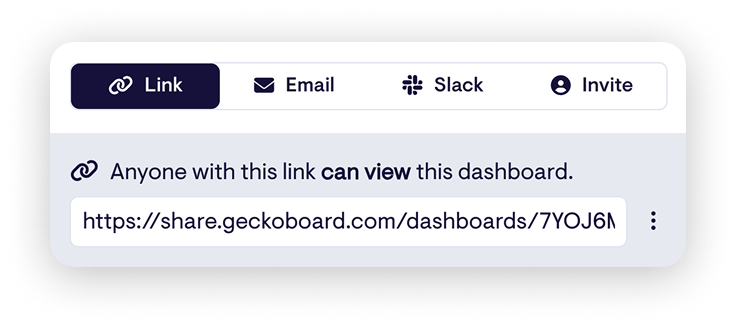
Share HubSpot Service Hub dashboards with your team
Make it easy for teams and stakeholders to access up-to-date HubSpot data, wherever they’re working from. No HubSpot upgrades required.

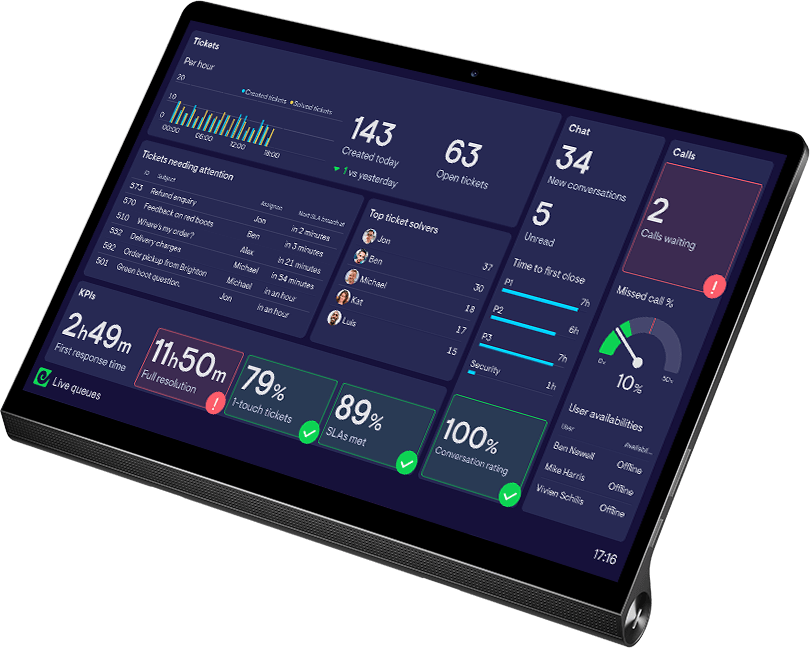
Access on mobile
Stay in sync on the move with mobile-friendly dashboards.
Access on mobile
Stay in sync on the move with mobile-friendly dashboards.
Expert help, whenever you need it
With years of experience, we’re here to help you get the most from real-time data.

The Geckoboard support team has been outstanding, even implementing a missing metric for us in record time. Exceptional service.
Every conversation I’ve had has been top-notch. Best dashboard tool for Zendesk by far!
The Geckoboard team is incredibly supportive, helpful, and professional. They always provide real support to the end user.
Geckoboard team are also fantastic. On hand and quick to reply if any issues. Can’t recommend more!
Geckoboard vs HubSpot reporting
HubSpot’s dashboards are there for deep analysis. Geckoboard is built for live, team-wide visibility.
Built for managers to analyze and create reports
Purpose-built for teams to monitor real-time data
Takes time to master
Easy and intuitive
Visualizes HubSpot data only
See data from 90+ sources with HubSpot metrics
Access on desktop
View on desktop, TV, mobile, Microsoft Teams, Slack and more
Refreshes every 2 hours
Refreshes every few minutes for real-time accuracy
Geckoboard’s HubSpot integration focuses on ticket data from Service Hub, as well as sales data from Sales Hub. We’re always expanding our integration, but as of Q3 2025, Geckoboard’s HubSpot integration supports these metrics:
- Tickets: tickets created, tickets closed, time to close, time to first response, all tickets, ticket list, and support for custom properties
- Deals: deals created, deals won, deals lost, deals closed, open deals, deals forecast to close, time to close, as well as all deals
- Value of deals: value of deals of deals won, value of deals lost, value of deals closed, closed, value of open deals, value of deals forecast to close, value of all deals
- Time spent in deal stage
- Weighted value of deals: weighted value of deals created, weighted value of deals closed, weighted value of open deals, weighted value of deals forecast to close, weighted value of all deals
- Conversion: win rate, loss rate
- Feeds: deals created, deals closed
- Activities: activities created, activities completed, all activities, list of activities, meetings, calls, tasks
- Contacts: contacts created, unassigned contacts, all contacts, list of contacts
- Companies: all companies, companies created, companies list
- Leads: all leads, leads created, open leads, leads in progress, qualified leads, disqualified leads, lead qualificaiton rate, lead to deal conversion rate, time to first touch, time spent at lead stage, leads list
All metrics can be filtered and broken down by pipeline, and you can show data from different pipelines on the same dashboard. You can also filter most metrics by custom properties if you have them set up in HubSpot.
As for other filters, these depend on the metric you’re visualizing. There are too many to cover here, but below are some examples based on the broad metric types. If you need to check if we support something not listed here, sign up for free to check it out, or ask our team.
- Ticket data: pipeline, status, create date, close date, ticket name, owner, team, source, priority
- Deal data: Deal name, stage, deal owner, closed lost reason, closed won reason, created by, team, type, last modified date, original source, latest source
- Activity data: create date, activity date, deal, assignee, team, type, contacts
- Contact data: create date, owner, team, lifecycle stage, country, original source, first page seen, lead status, next activity date, date of entering a specific stage
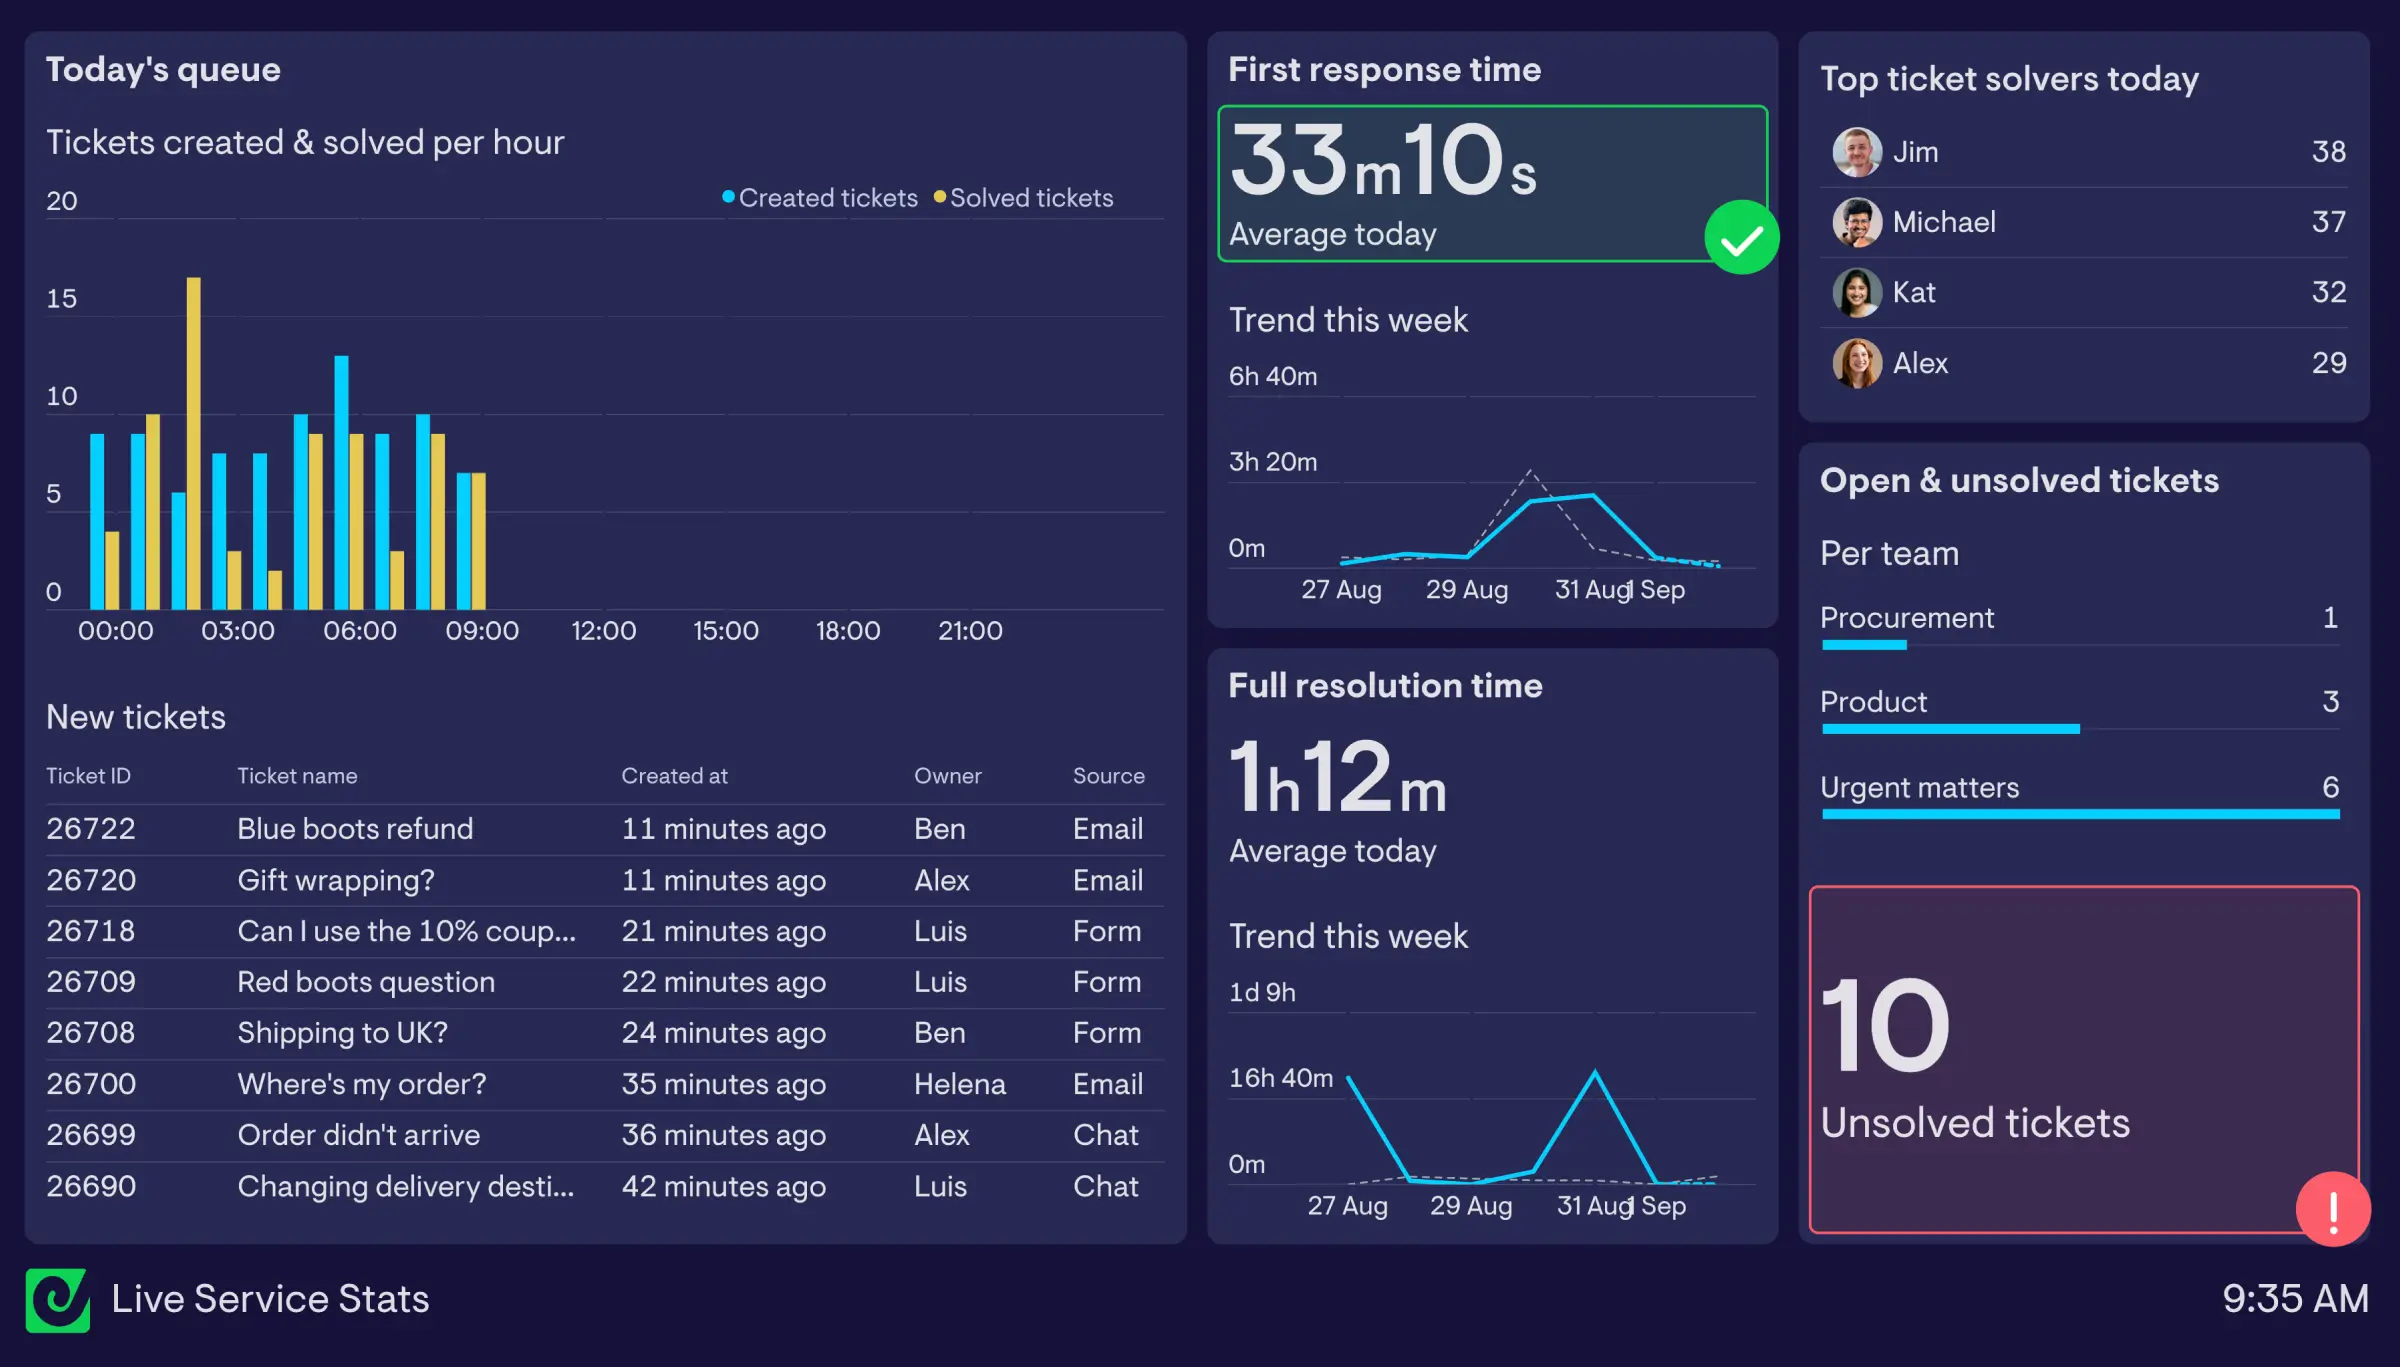
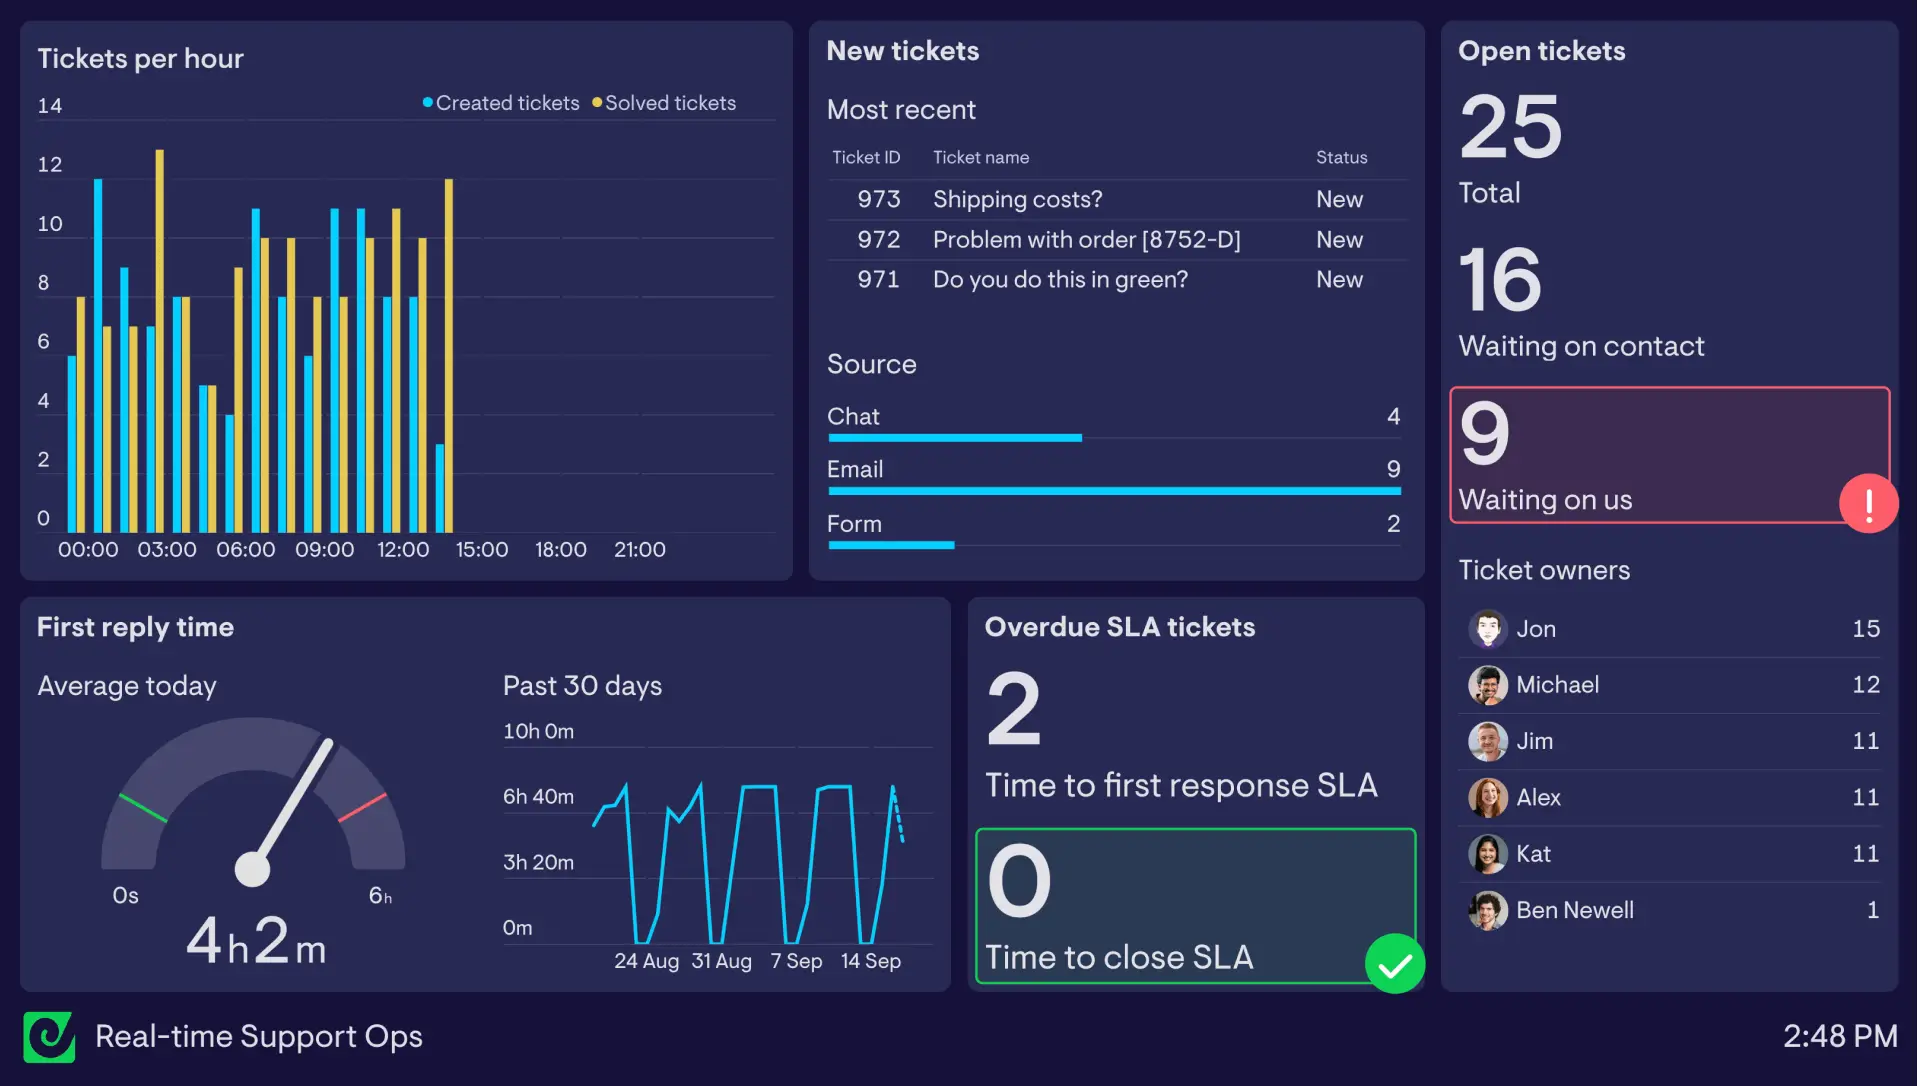
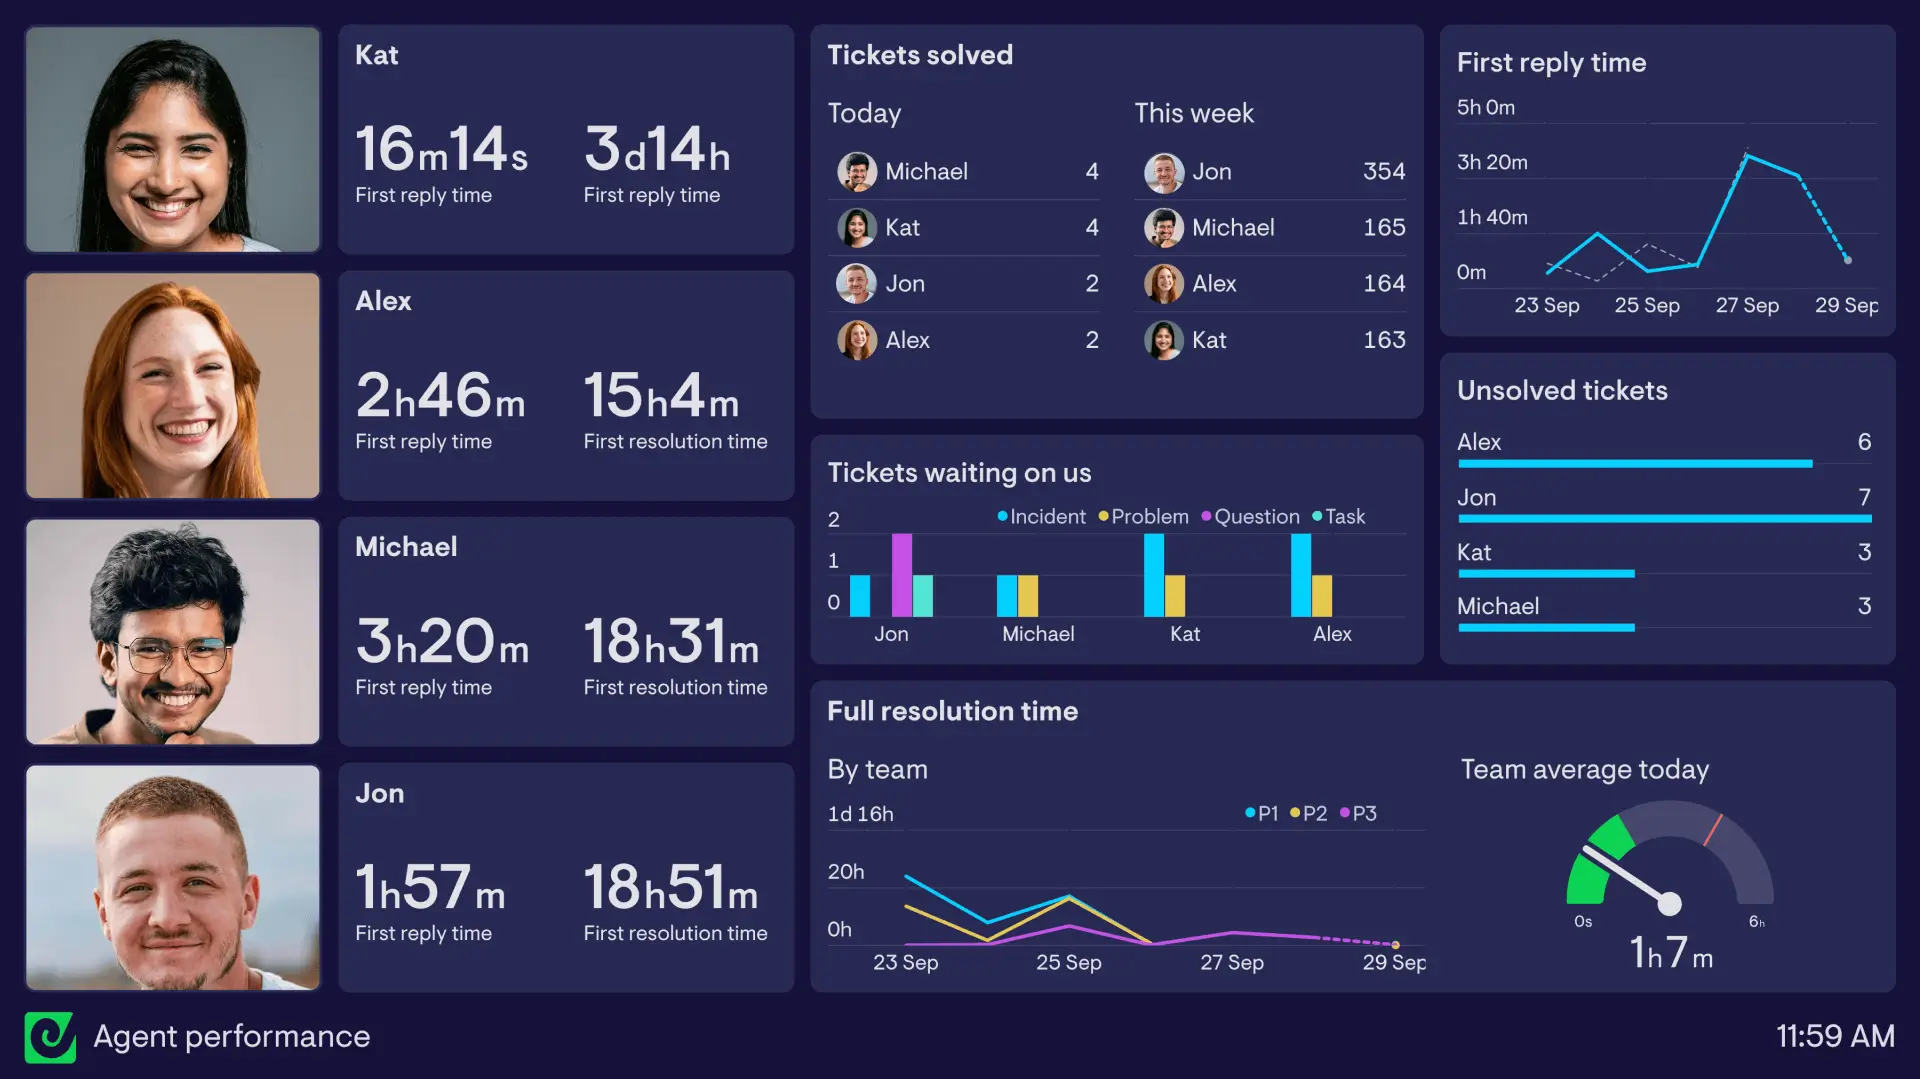
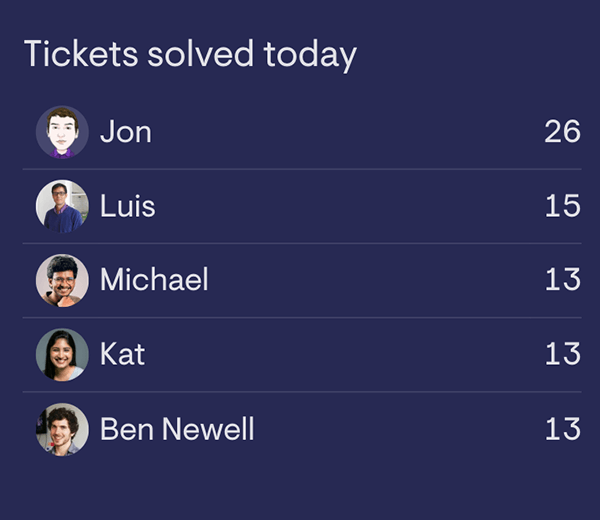
Geckoboard is ideal for creating a real-time view of ticket metrics that you, your customer service agents or stakeholders should be regularly monitoring. This can include data from several HubSpot pipelines and other sources too. Examples might include dashboards for monitoring ticker queues, performance of team members (replacing that manual leaderboard), raising the visibility of customer service KPIs like first response time, or a mix.
It’s easy to set up a direct connection between HubSpot and Geckoboard without any technical knowledge. You can read our step-by-step guide to connecting HubSpot, but in summary, sign up to Geckoboard, and select HubSpot from the list of data sources. You’ll be prompted to log in to HubSpot and then confirm you want to create the connection by clicking ‘choose account’.
That’s it! After a quick import process to pull through the past few weeks of data, you’re ready to add some HubSpot widgets to your dashboard.
Absolutely. If you’re an admin on your Geckoboard account, you can manage and remove your data source connections from the Admin menu in the top right of your Geckoboard account. Disconnecting a data source this way immediately deletes all data and credentials related to it from our system.
10 minutes is the standard refresh rate for our HubSpot integration, but some metrics update instantly. See this help article for refresh rates of all our other data sources.
Absolutely, and you can add metrics from different HubSpot accounts to the same dashboard too.
Geckoboard is designed to be easy for anyone to use without any training or complicated setup.
To help along the way, we’ve put together useful articles answering common questions, and for anything else, our friendly and knowledgeable team is on hand 24/5 to help you succeed with your dashboards, whatever time zone you’re in. Pro and Enterprise plans offer even snappier support, with priority support and dedicated support reps available.
You can try Geckoboard completely free for 14 days by signing up for a free trial — no payment details required. Plans then start from $60/month, with options for more dashboards, users and TVs on your account. View our pricing here.
Ready to get started?