HubSpot Service Hub dashboard examples
A HubSpot Service Hub dashboard gives support managers and teams a real-time view of performance — ticket volume, response times, SLA compliance, and CSAT — pulled directly from HubSpot. On a shared screen or sent as a snapshot, it keeps the whole team aligned on what matters and aware of where things need attention.
Real-time Support Ops Dashboard
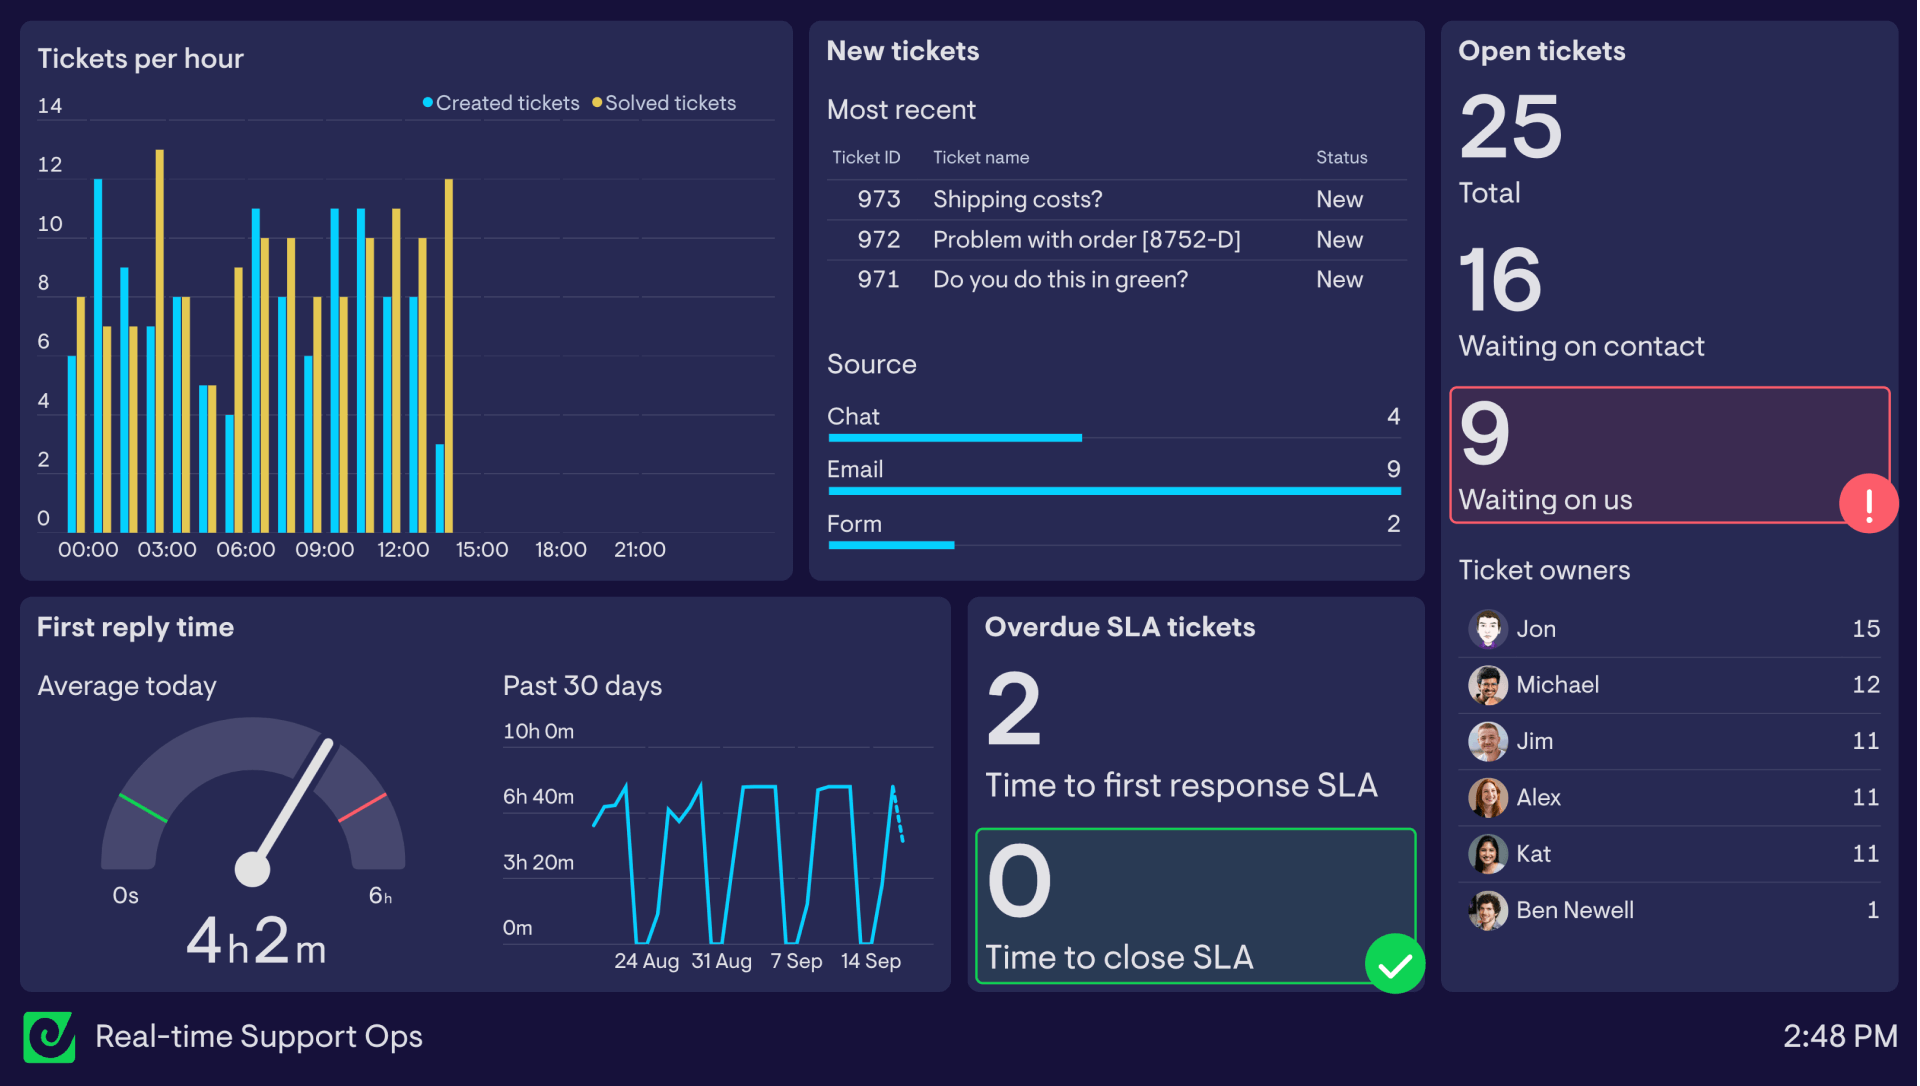
Keep your support operation firing on all cylinders with this real-time HubSpot Service Hub dashboard. Designed for support managers and agents alike, it surfaces the live metrics you and the team need to balance workloads and stay ahead of any bottlenecks.
Track ticket volume as it fluctuates throughout the day, see which channels are driving demand, and monitor new and open tickets by status. Instantly spot SLA breaches, track time to first response, and keep an eye on each agent’s current workload so tickets can get reassigned before queues build up.
Agent Performance Dashboard
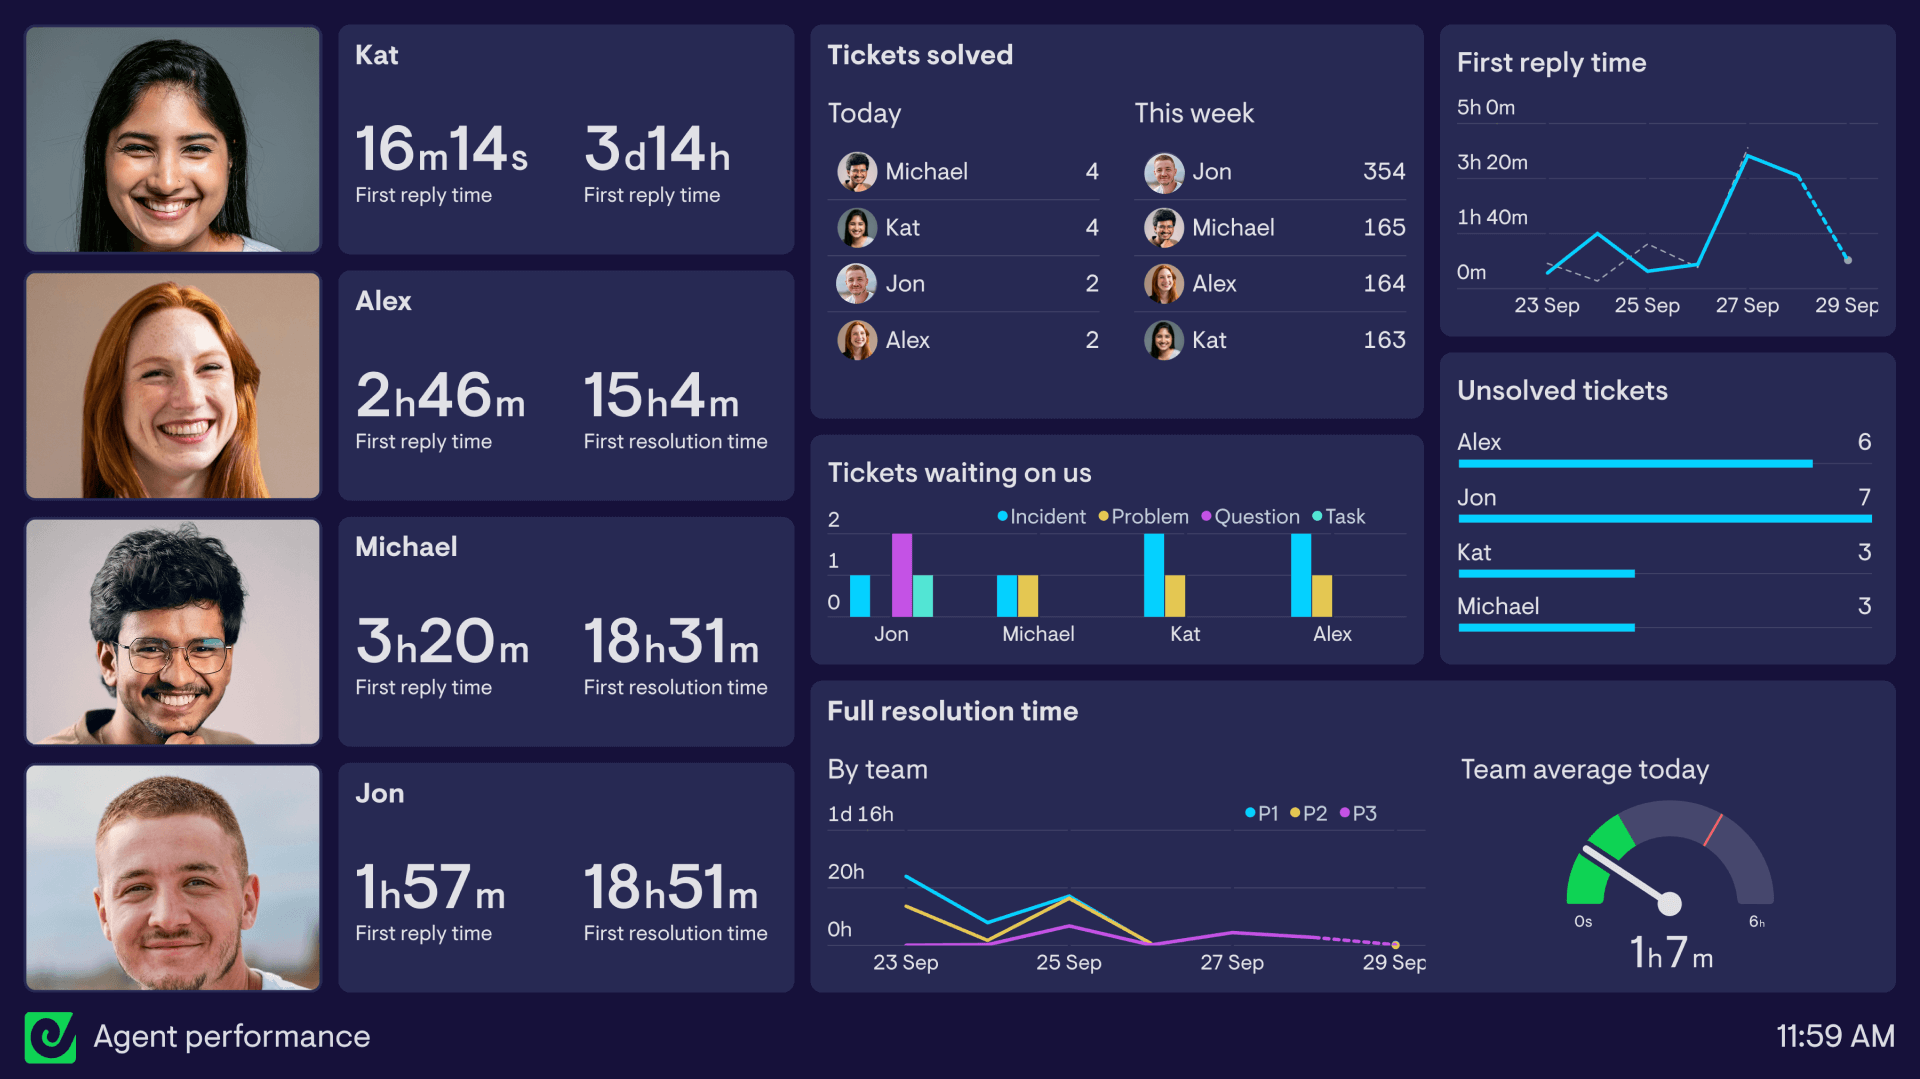
This real-time HubSpot Service Hub dashboard gives both managers and agents a live view of individual performance. It surfaces key metrics including:
- First reply time per agent
- First resolution time per agent
- Tickets solved (today and this week)
- Tickets waiting on us (by type, e.g. incident, problem, question, task)
- Unsolved tickets per agent
- Full resolution time (by team and priority)
- Team average response time today
Because the data refreshes automatically, agents can see how they’re doing in the moment, creating a motivational, transparent environment that encourages quicker responses and better service. For managers, it’s a powerful tool for comparing performance, spotting coaching opportunities, and balancing workloads before bottlenecks appear.
By visualizing these metrics in real time, support leaders can build a culture of accountability and continuous improvement within their HubSpot Service Hub team. Agents are motivated by seeing their performance stack up against teammates, while managers gain instant visibility into overall team performance, workload distribution, and service quality trends. This makes it easier to drive consistent improvements across the entire support function.
Browse other popular examples
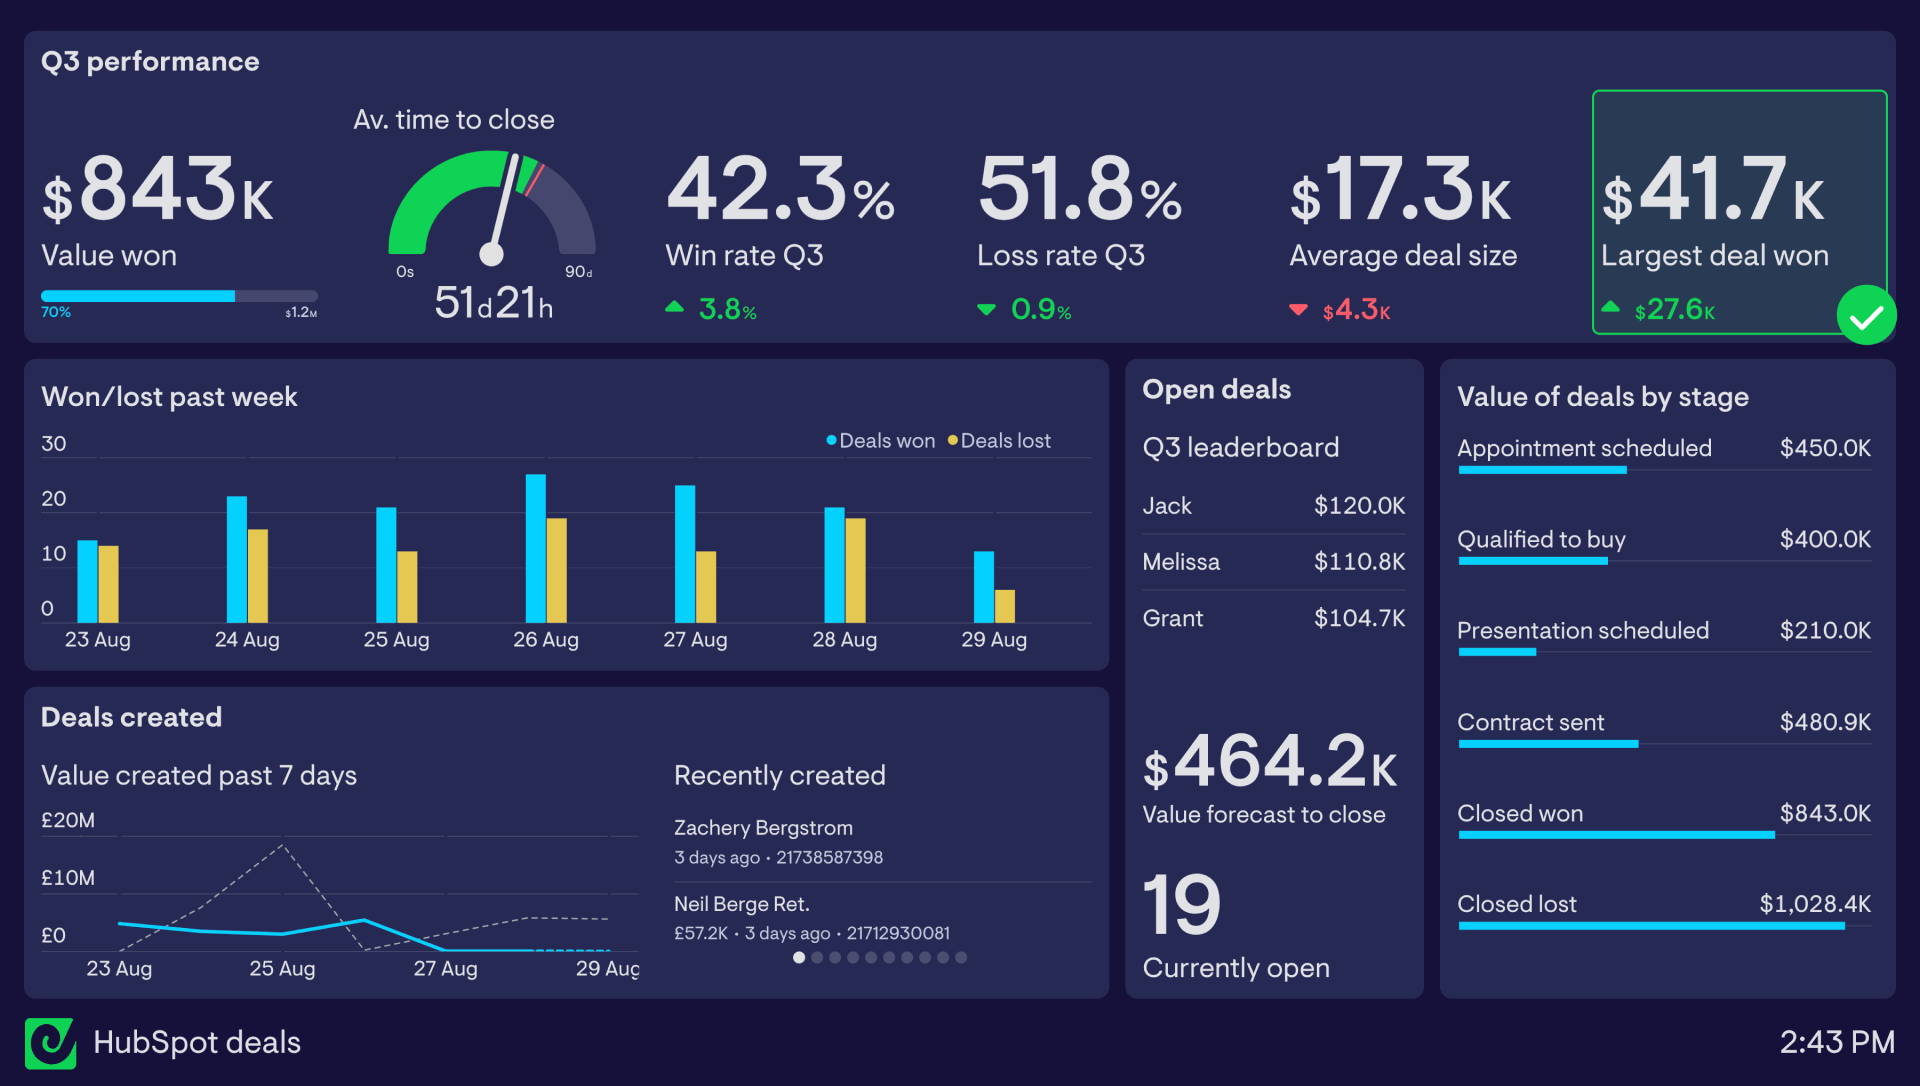
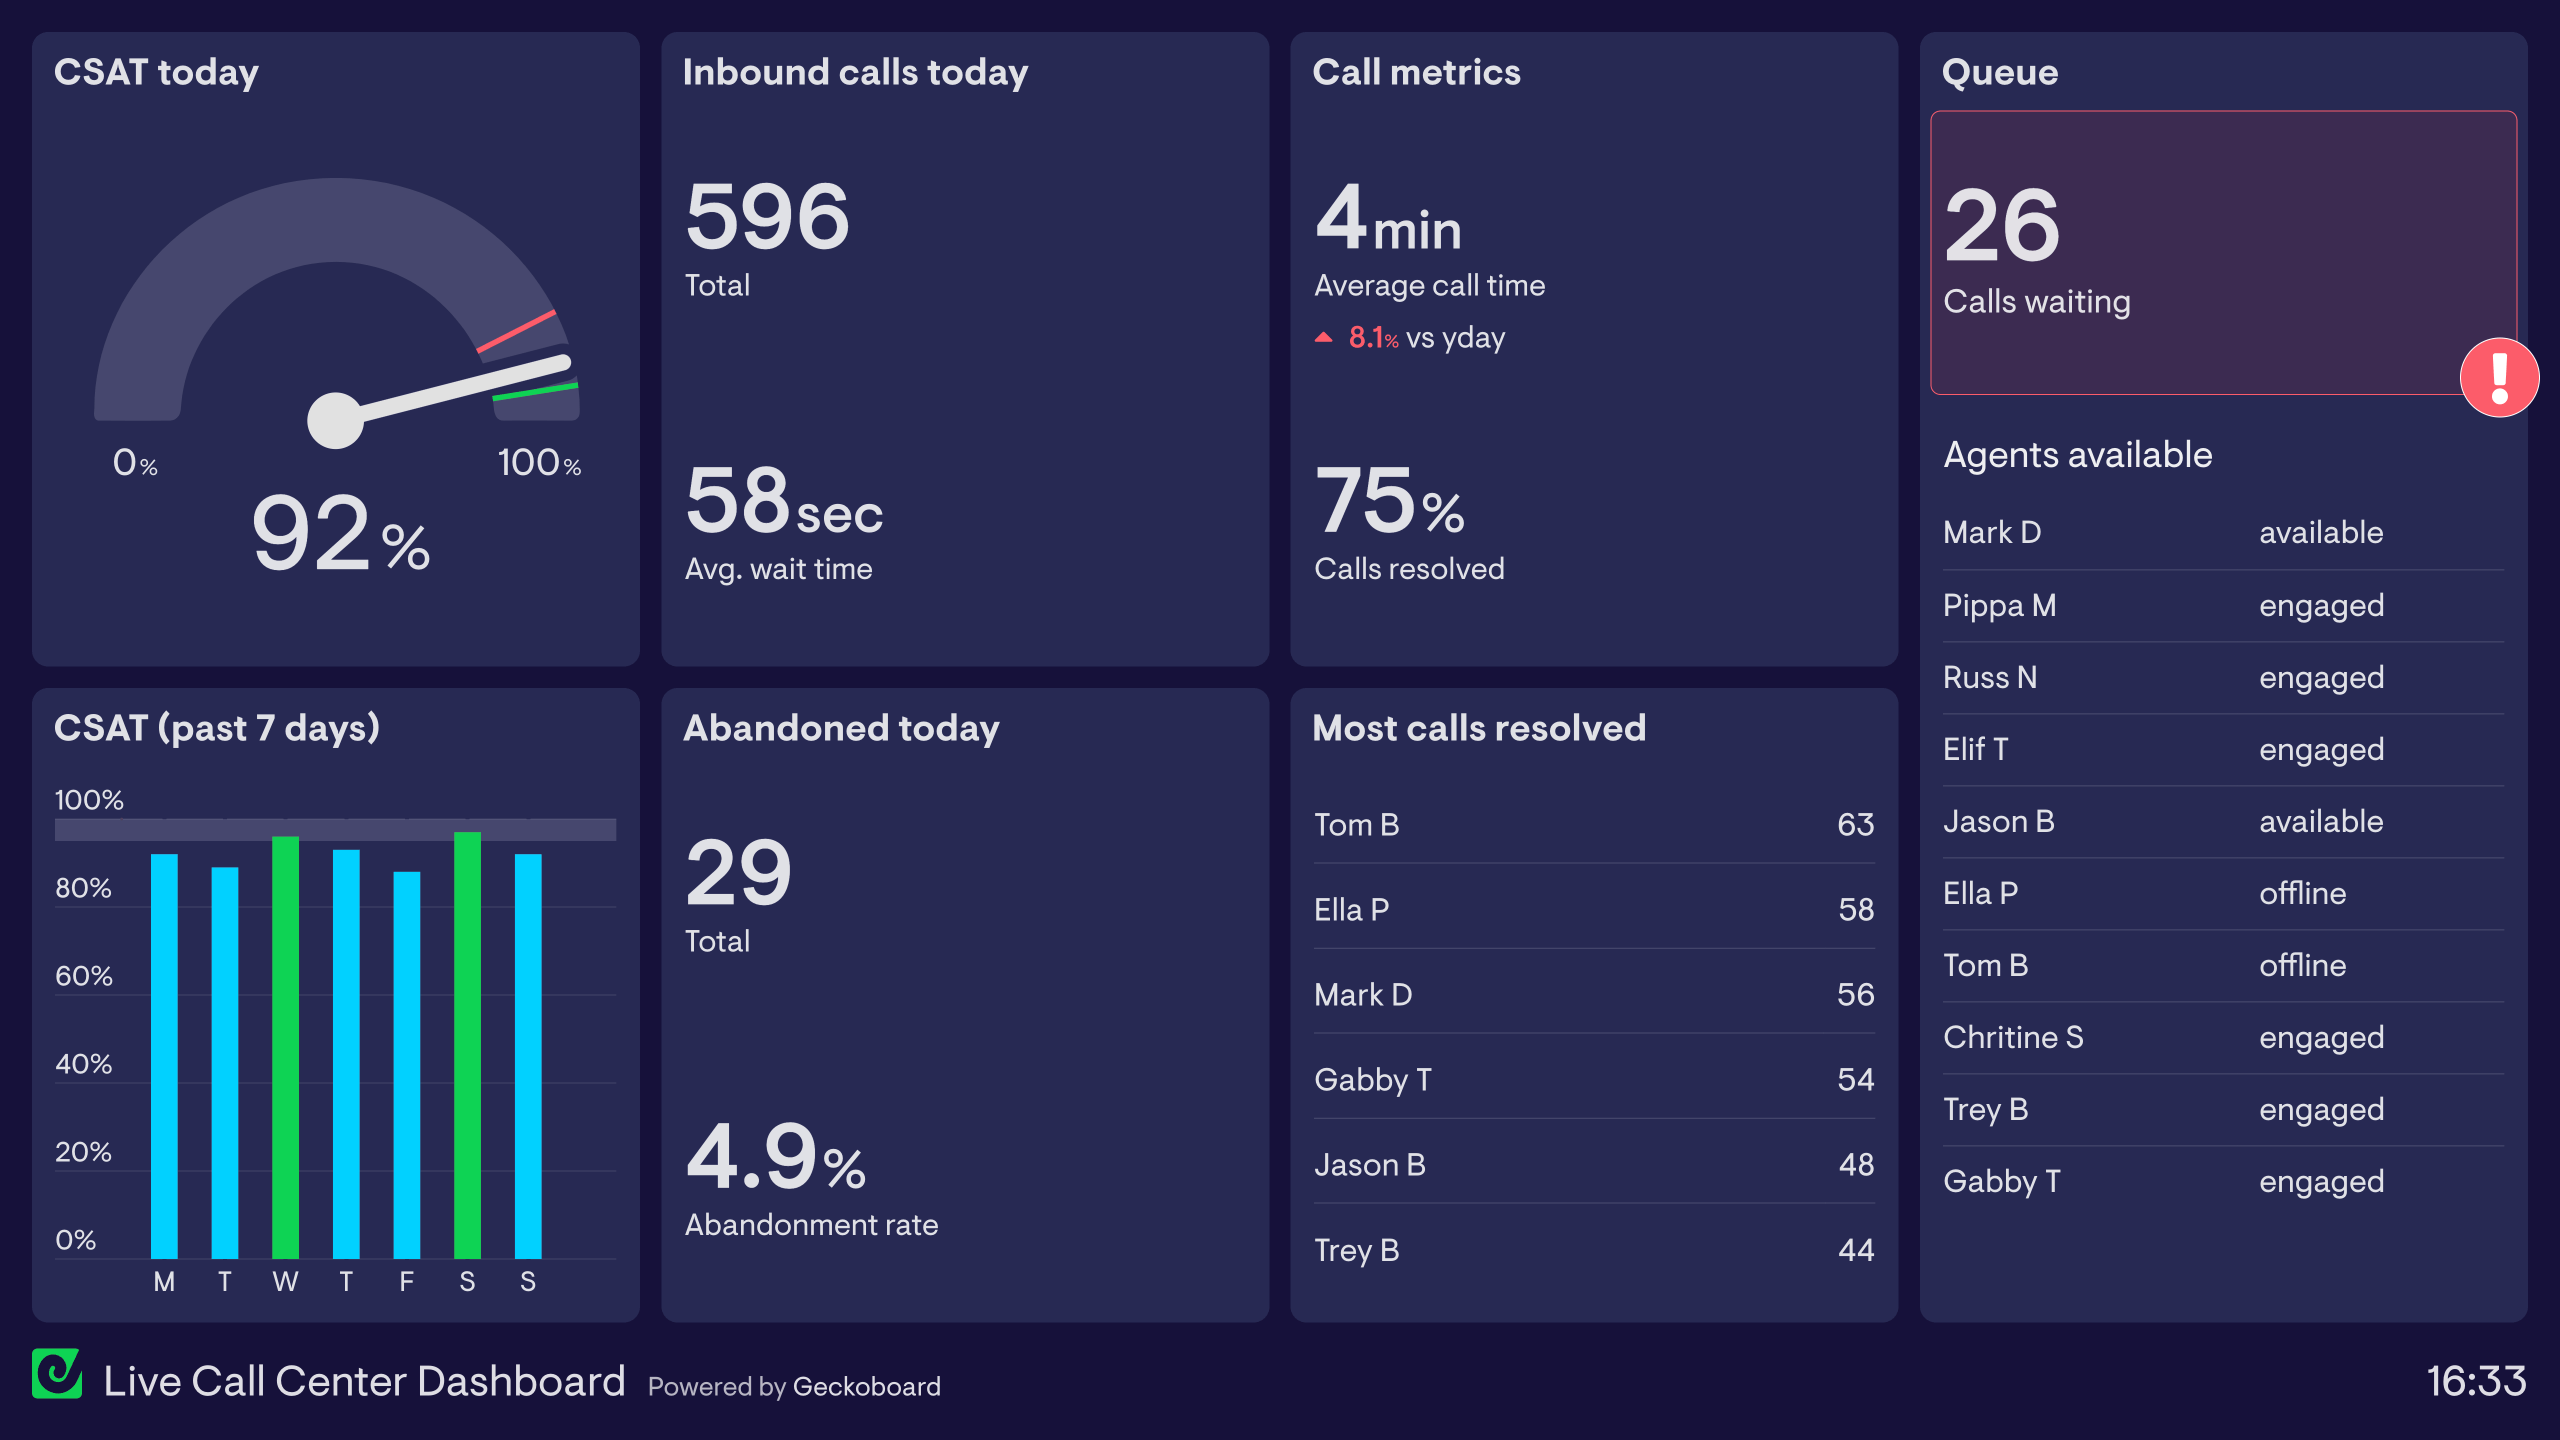
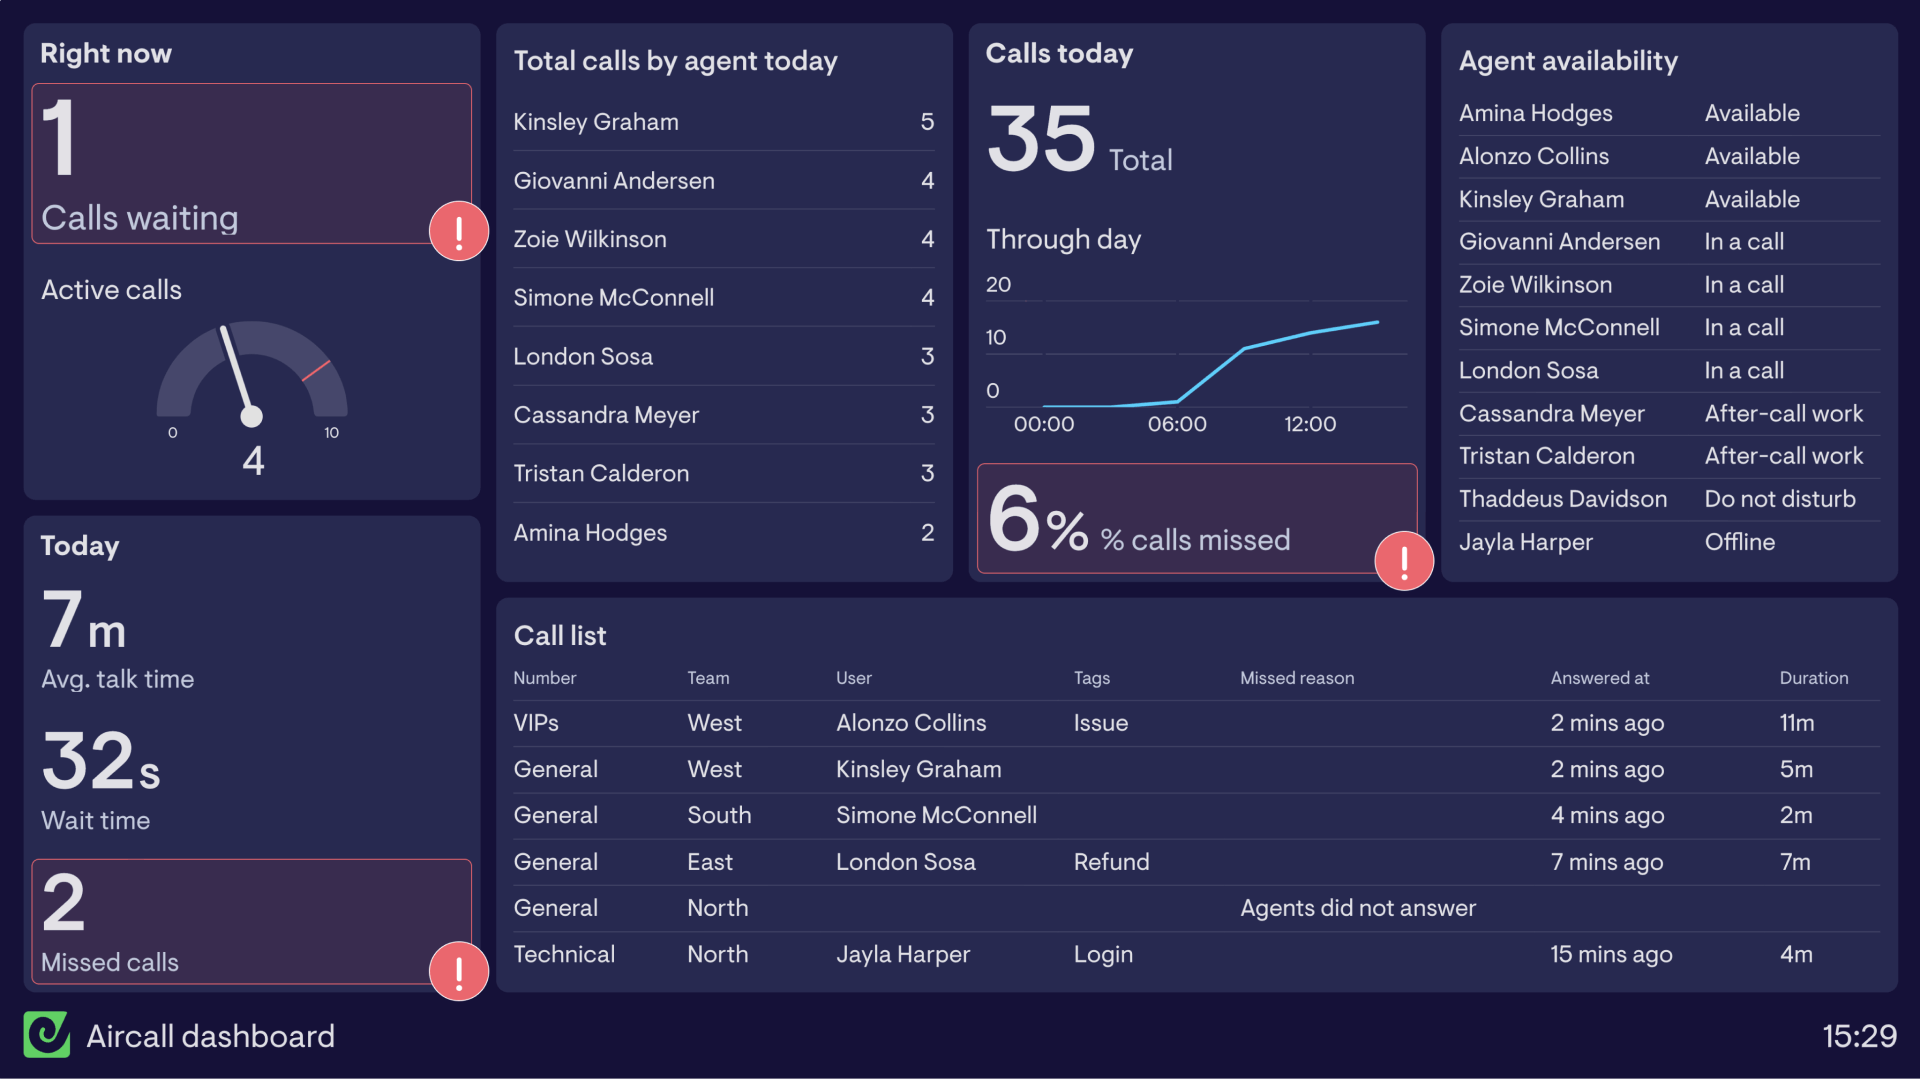
A HubSpot Service Hub dashboard displays real-time support operations data from HubSpot — giving support managers a live view of ticket queues, agent performance, and customer satisfaction. It surfaces what's happening in Service Hub on a shared screen, so the whole team can stay aligned without logging into HubSpot individually.
Geckoboard is a live dashboard tool that connects to HubSpot Service Hub alongside Zendesk, Intercom and more to display support metrics in real time. Dashboards are designed to run on a TV in the team's workspace, sent as automated snapshots, or shared via link — keeping the whole team aligned without anyone pulling a report.
Key metrics include open tickets, tickets resolved today, first response time, CSAT score, tickets by status, and agent activity. Agent performance dashboards often display individual stats alongside team totals.
Building a custom HubSpot Service Hub dashboard is straightforward with Geckoboard's dashboard builder. Connect HubSpot to pull ticket and agent data from Service Hub directly into a live dashboard, then pick your metrics and build the view you need. Share with your team as a TV dashboard, shared link, or scheduled snapshot. Start a free trial or learn more about how Geckoboard works.
Use it to track customer service performance live so support leads can see queue pressure building and act on it immediately. It also helps display agent-level metrics on a shared screen, which encourages accountability and keeps the team motivated throughout the day.